hoang tu Trend Indicatorthực nghiệm ngày 7/3/2025
hãy thử kiểm tra mua khi giá trị kiểm tra từ 0 lên 7%, mua tốt nhất quanh giá trị 10%
Indicateurs d'étendue

Daily High/Low by Enes🔥 Features:
✅ Daily high & low as continuous lines extending to the right
✅ Automatic daily updates
✅ Labels ("Daily High" & "Daily Low") directly on the chart

Ultimate Scalping Strategy - Enhancedltra-Clean Scalping Strategy + Enhanced RSI Box
This is a high-performance scalping strategy designed for 1-minute to 5-minute charts, with a focus on maximizing profitability and reducing false signals. It combines a series of advanced technical indicators to provide clean, actionable buy and sell signals for quick and efficient trading.
Key Features:
EMA Setup (Fast, Medium, Slow): Utilizes multiple EMAs to track the trend and identify optimal entry points.
RSI (Relative Strength Index): Includes an enhanced RSI box that visually displays the current RSI, with color-coding indicating overbought or oversold conditions.
MACD (Moving Average Convergence Divergence): Integrates the MACD for additional trend confirmation and helps filter out weaker signals.
Volume Filter: Filters trades based on volume spikes, ensuring that trades are supported by increased market activity.
Clean and Simple UI: The strategy provides clear buy and sell signals, along with a floating RSI box for quick reference.
Optimized for Scalping: Perfect for quick, short-term trades, maximizing profits while minimizing false signals.
Trade Logic:
Long Signal (Buy): Generated when the fast EMA crosses above the medium EMA, the price is above the slow EMA, RSI is under the overbought level, MACD is bullish, and volume spikes.
Short Signal (Sell): Generated when the fast EMA crosses below the medium EMA, the price is below the slow EMA, RSI is above the oversold level, MACD is bearish, and volume spikes.
Alerts: Set alerts for both buy and sell conditions to never miss a high-probability trade.

New York Session at 15:30 UTC+1 (Berlin)Verwendungszweck des Indikators:
📌 New York Session Opening:
Die Linie markiert den Beginn der New Yorker Handelssitzung (15:30 Uhr deutscher Zeit).
Diese Uhrzeit ist für Trader wichtig, da hohe Liquidität und Volatilität auftreten.
📌 Markierung eines wichtigen Marktzeitpunkts:
Viele Trader nutzen 15:30 Uhr als Einstiegspunkt oder zur Analyse von Preisbewegungen.
Die vertikale Linie hilft, historische Muster oder Preisreaktionen zum Session-Start zu identifizieren.
📌 Flexibilität und Anpassung:
Nutzer können die Linienfarbe und den Stil (durchgezogen oder gestrichelt) anpassen.
Funktioniert auf allen Timeframes und bleibt als visuelle Orientierung erhalten.

Thick ‘n’ Thin“Thick ‘n’ Thin (TNT) flags big volume moves and their sneaky inside bars on higher timeframes red dot above hints Potential Distribution (reversal?), green below whispers Potential Accumulation (consolidation?). Alerts ping setups with ticker and price; tweak lookback and percentile to dial it in. Best with key levels for reversal or range clues!”
Confluence is your VIP ticket; skip it, and the market’ll thin your stack with a cheeky grin!”
Breakdown
Higher Timeframes: “higher timeframes” (12H, D,W) suits the slower, meatier setups you’re eyeing.
Key Levels: Emphasized confluence with support/resistance thick candles at these zones scream louder, A HTF Pivot , a Naked POC or Single Print ?
Alerts: Noted they fire with ticker and price, so users know it’s got their back.
Controls: Highlighted lookback and percentile inputs lets traders tune the “thick” threshold and range.
Reversals/Consolidation: Positioned it as a reversal spotter (distribution = top, accumulation = bottom) or consolidation flag (inside bar pause).
When It Shines
Reversals: Thick bullish candle at resistance + inside bar (red dot)? Distribution might flip it. Thick bearish at support + inside (green dot)? Accumulation could lift it.
Consolidation: Inside bar after a fat move at a key level price might coil before breaking.
Higher TFs: 1H+ gives those thick candles more weight less noise, more signal.
Who’s It For
Swing traders hunting tops/bottoms at key zones.
Volume fans who love a high-timeframe story.
Anyone who’d rather sip coffee than scalp micros.

BTC 5-Min Trend Breakout📊 Strategy Overview:
✔ EMA Trend Confirmation → Trades only in the direction of the trend (EMA 50 & EMA 200).
✔ Breakout Strategy → Only buys breakouts above resistance and sells breakdowns below support.
✔ High Volume Filter → Confirms strong moves with high volume.
✔ RSI Check → Prevents entries in overbought/oversold conditions.
✔ Dynamic Stop Loss & Take Profit → Uses ATR to adjust risk levels dynamically.
✔ Alerts & Markers → Provides BUY/SELL signals and triggers alerts.

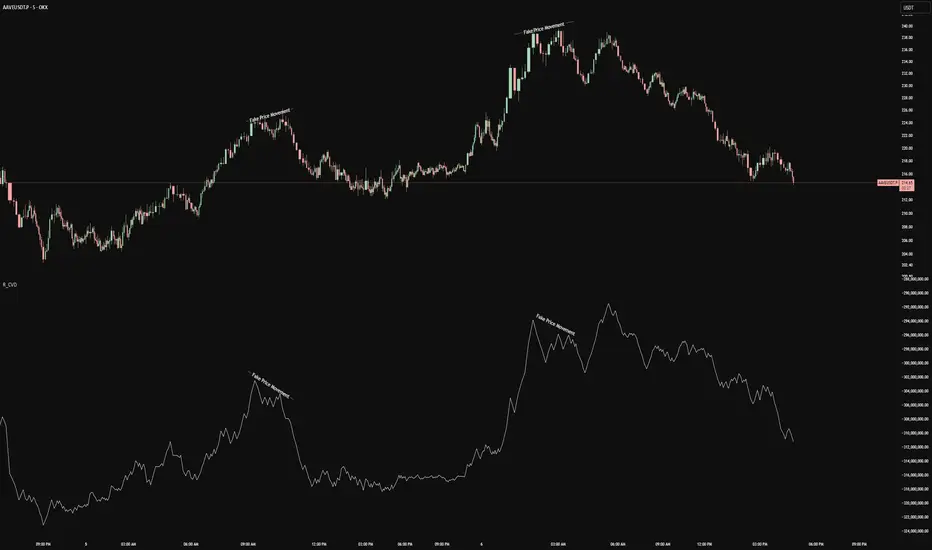
Rolling Cumulative Volume DeltaRolling CVD is your market’s lie detector no resets, just raw volume truth! checks: close > open? Add volume (buyers flexing). Close < open? Subtract it (sellers sulking). Ties = zero. It rolls forever, plotting the vibe.
Use it when price fakes you out rising but CVD dips? Trouble. Dropping but CVD climbs? Sneaky strength. Perfect for scalpers sniffing momentum, swing traders riding waves, or that volume-obsessed buddy who overanalyses everything!
Shines best on timeframes under 15m to catch those sneaky price fibs in action!
Don’t bet your lunch money on Rolling CVD alone, you wild child! Pair it with your fave indicators RSI, moving averages, tea leaves, whatever because confluence is king. It’s a sly hint, not a crystal ball, so trade smart or the market’ll spank ya!
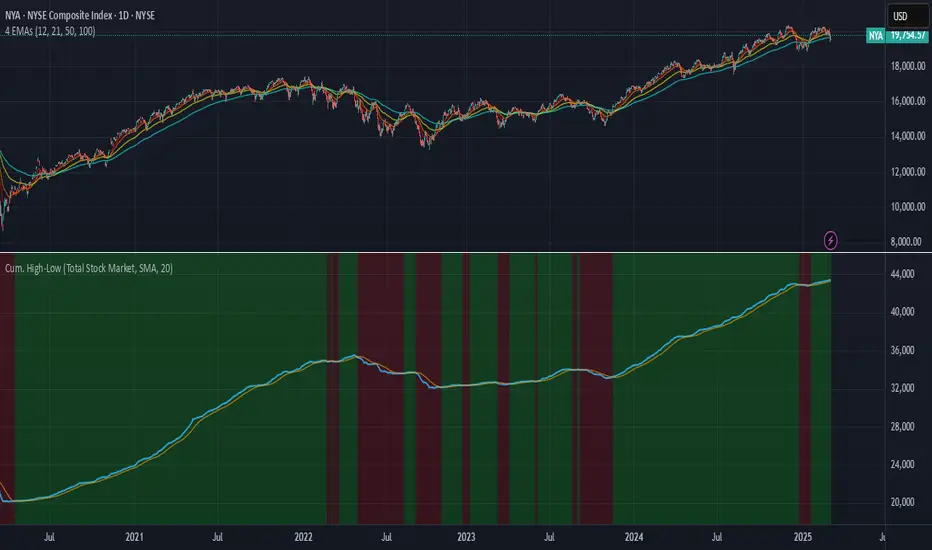
Cumulative New Highs - New Lows IndicatorThis indicator is designed to track market momentum by calculating and plotting the cumulative sum of 52 weeks High-Low for different indices, alongside a customizable moving average.
Index Selection:
Users can choose from multiple indices, including:
Total Stock Market (default)
NYSE Composite
Nasdaq Composite
S&P 500
Nasdaq 100
Russell 2000
Moving Average Customization:
The script allows you to select between a Simple Moving Average (SMA) or an Exponential Moving Average (EMA) for smoothing the cumulative data. The window length of the moving average is also adjustable, letting you tailor the sensitivity of the trend analysis.
Dynamic Background Plotting:
With the background plot option enabled, the indicator changes the chart's background color dynamically:
Green: When the cumulative sum is above its moving average, suggesting bullish momentum.
Red: When it is below the moving average, indicating bearish conditions.
Visual Representation:
Two key lines are plotted:
Cumulative Index Line: Displayed in a subtle blue, representing the aggregated market movement.
Moving Average Line: Shown in an orange tone, offering a smoothed perspective that aids in identifying trend shifts.
Inspiration:
I took inspiration from the indicator made by YoxTrades (I can't put links, but you can check their profile) and added a few features I wanted on top of it.
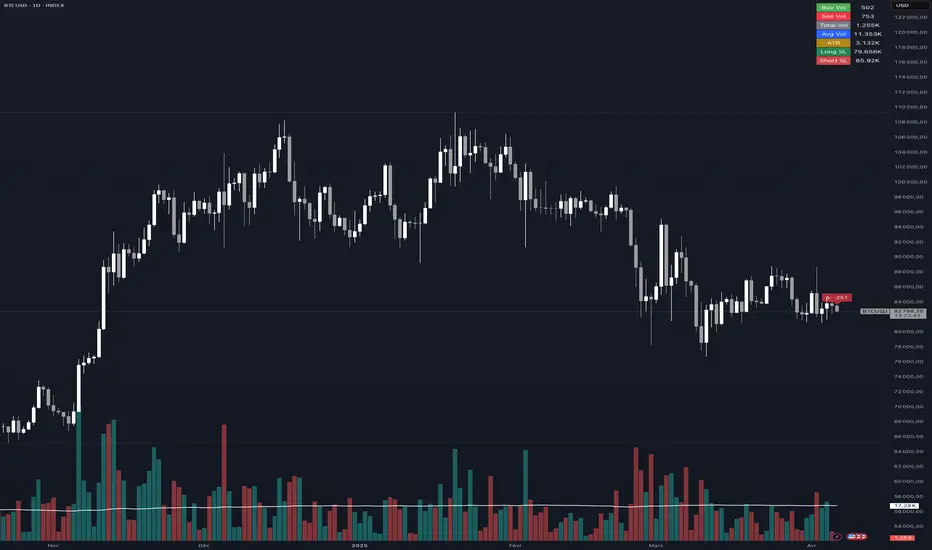
toolbox🔥 TOOLBOX - The Ultimate Trading Indicator 🔥
The Toolbox indicator is designed to provide advanced technical analysis while integrating essential risk management tools. It caters to both beginner and experienced traders, helping optimize decision-making through a combination of technical indicators and risk management strategies.
⚙️ Features & Detailed Explanation
📌 Built-in Risk Management
✅ Automatic position size calculation: Based on total capital and user-defined risk percentage per trade.
✅ Stop-Loss (SL) & Take-Profit (TP) levels display: Automatically calculated based on a customizable risk/reward ratio.
✅ Smart Break Even (BE): Option to move the stop-loss to entry price after reaching a certain profit level.
🔹 Available Settings:
Total Capital 💰: Defines the trading capital.
Risk Percentage per Trade ⚠: Adjusts position size dynamically.
TP/SL Ratio 🎯: Controls the Take-Profit based on the Stop-Loss.
Break Even Activation 🔹: Secure profits automatically.
📊 Included Technical Indicators
Toolbox combines several powerful technical indicators to identify the best market opportunities.
🔄 Exponential Moving Averages (EMA)
EMA 12 & 25: Used for crossover signals.
EMA 200: Acts as a major trend filter.
✔️ If the price is above EMA 200, the trend is bullish.
✔️ If the price is below EMA 200, the trend is bearish.
New: EMA 199 & EMA 260! 🎯
These two additional EMAs provide an independent trend filter, reducing false signals.
📈 Relative Strength Index (RSI)
A classic RSI (14-period) helps spot overbought and oversold conditions.
✔️ Potential buy when RSI crosses above 30.
✔️ Potential sell when RSI crosses below 70.
📉 Bollinger Bands (BB)
Bollinger Bands (20, 2) help identify volatility expansions and potential reversals.
✔️ A close outside the bands may indicate a reversal.
📊 MACD (Moving Average Convergence Divergence)
The MACD (12, 26, 9) detects momentum shifts in the market and confirms other indicator signals.
✔️ Bullish signal: MACD crosses above the signal line.
✔️ Bearish signal: MACD crosses below the signal line.
📉 Triple EMA (TEMA)
An advanced trend filter using TEMA 9, 21, and 50.
✔️ Crossovers between short and medium TEMA indicate momentum shifts.
🚀 Entry Signals & Graphical Display
The Toolbox indicator automatically generates buy and sell signals based on trend and indicator crossovers.
✔️ TP/SL levels displayed on the chart with text labels.
✔️ Break Even (BE) lines appear when a trade reaches a predefined profit level.
✔️ Entry points marked visually with black crosses.
✅ Each indicator can be individually enabled or disabled from the settings panel.
🎯 Why Use Toolbox?
✅ Comprehensive Indicator combining technical analysis & risk management.
✅ Suitable for all trading styles: scalping, day trading, swing trading.
✅ Fully customizable: Enable or disable any indicator as needed.
✅ Optimized trade execution & risk security through advanced risk settings.
🔥 Future Updates - Version 2 in Progress!
The goal of Toolbox is to continuously evolve based on user feedback to become an even more powerful and competitive indicator. 🚀
💡 Do you have suggestions for improvements or new features?
💬 Leave your feedback in the comments or send a message!
➡ Which additional indicators would you like to see in V2?
📩 Share your thoughts to help make Toolbox even better!
🔥 Thank you for using TOOLBOX - The Ultimate Trading Indicator! 🔥
📈 Happy trading, and stay tuned for V2! 🚀
🔥 TOOLBOX - L'Indicateur Ultime du Trader 🔥
L’indicateur Toolbox est conçu pour fournir une analyse technique avancée, tout en intégrant des outils essentiels de gestion du risque. Il s'adresse aux traders débutants comme expérimentés et permet d’optimiser la prise de décision grâce à une combinaison d’indicateurs techniques et de stratégies de gestion du risque.
⚙️ Fonctionnalités et Explications Détaillées
📌 Gestion du Risque Intégrée
✅ Calcul automatique de la taille de position : En fonction du capital total et du risque défini par l’utilisateur (exprimé en % par trade).
✅ Affichage des niveaux de Stop-Loss (SL) et Take-Profit (TP) : Les niveaux sont calculés dynamiquement en fonction d’un ratio risque/récompense personnalisable.
✅ Break Even (BE) intelligent : Option pour déplacer le stop-loss au point d’entrée après un certain seuil de profit atteint.
🔹 Paramètres disponibles :
Capital Total 💰 : Définit le capital à risque.
% de Risque par trade ⚠ : Ajuste automatiquement la taille de position.
Ratio TP/SL 🎯 : Ajuste le Take-Profit en fonction du Stop-Loss.
Activation du Break Even 🔹 : Permet une sécurisation automatique des gains.
📊 Indicateurs Techniques Inclus
L’outil combine plusieurs indicateurs techniques puissants pour identifier les meilleures opportunités de marché.
🔄 Moyennes Mobiles Exponentielles (EMA)
Les EMA 12 et 25 servent de signaux de croisement, tandis que la EMA 200 est utilisée comme barrière de tendance principale.
✔️ Si le prix est au-dessus de la EMA 200, la tendance est haussière.
✔️ Si le prix est en dessous, la tendance est baissière.
Nouveauté : EMA 199 & EMA 260 ! 🎯
Ces deux moyennes mobiles indépendantes permettent un filtrage supplémentaire de la tendance pour éviter les faux signaux.
📈 RSI (Relative Strength Index)
Un RSI classique en 14 périodes est inclus pour repérer les surachats et surventes.
✔️ Achat potentiel si le RSI passe au-dessus de 30
✔️ Vente potentielle si le RSI passe en dessous de 70
📉 Bandes de Bollinger (BB)
Les Bandes de Bollinger (20, 2) aident à repérer des ruptures de volatilité et des points de retournement.
✔️ Une clôture en dehors des bandes peut signaler une extension excessive et un possible retournement.
📊 MACD (Moving Average Convergence Divergence)
Le MACD (12, 26, 9) est utilisé pour détecter les changements d’élan du marché et confirmer les signaux des autres indicateurs.
✔️ Signal haussier : Croisement du MACD au-dessus de la ligne de signal.
✔️ Signal baissier : Croisement du MACD en dessous de la ligne de signal.
📉 Triple EMA (TEMA)
Un filtre de tendance avancé basé sur le TEMA 9, 21 et 50.
✔️ Les croisements du TEMA court avec le TEMA moyen indiquent des changements de dynamique.
🚀 Signaux d’Entrée & Affichage sur le Graphique
L’indicateur Toolbox génère automatiquement des signaux d’achat et de vente en fonction des tendances et des croisements d’indicateurs.
✔️ Affichage des niveaux TP/SL sur le graphique avec étiquettes textuelles.
✔️ Lignes de Break Even (BE) lorsqu’un certain niveau de profit est atteint.
✔️ Repères visuels pour les points d’entrée sous forme de croix noires.
✅ Option pour activer/désactiver chaque indicateur individuellement depuis le panneau de configuration.
🎯 Pourquoi utiliser Toolbox ?
✅ Indicateur complet combinant analyse technique et gestion du risque.
✅ Adapté à tous les styles de trading : scalping, day trading, swing trading.
✅ Personnalisable : chaque indicateur peut être activé ou désactivé selon les préférences.
✅ Idéal pour optimiser les prises de position tout en sécurisant les trades grâce aux paramètres de risque avancés.
🔥 Évolution et Améliorations Futures - Version 2 en Préparation !
L’objectif de Toolbox est d’évoluer en fonction des retours de la communauté pour devenir un indicateur toujours plus complet et performant. 🚀
💡 Vous avez des idées d’améliorations ou souhaitez voir de nouveaux indicateurs intégrés ?
💬 Laissez vos suggestions en commentaire ou envoyez un message !
➡ Quels autres indicateurs aimeriez-vous voir ajoutés dans la V2 ?
📩 Partagez votre feedback pour rendre Toolbox encore plus puissant !
🔥 Merci d’utiliser TOOLBOX - L’indicateur du trader exigeant ! 🔥
📈 Bon trading et à bientôt pour la V2 ! 🚀

Predictive Buy/Sell IndicatorĐây là mã Pine Script dự báo tín hiệu BUY/SELL trước khi nến chạy, dựa trên Fibonacci, Order Block, RSI và EMA. Chỉ báo sẽ:
✅ Hiển thị tín hiệu BUY (mua) khi giá phá vỡ Order Block, RSI thấp và nằm trên EMA.
✅ Hiển thị tín hiệu SELL (bán) khi giá giảm dưới Order Block, RSI cao và nằm dưới EMA.
✅ Tự động đặt Take Profit (TP) & Stop Loss (SL) dựa trên ATR.

biance Event Contract Road signThis event contract road sign echo for Binance hopes to bring you trading inspiration
Please use this indicator at the 1-minute level and adjust the LIMIT variable in the input to adapt to the time unit of the contract
If this indicator helps you, please give a thumbs up, thank you!
这个适用于币安的事件合约用户路珠回显 希望能给您带来交易灵感
该指标请在1分钟级别下使用 调整输入中的LIMIT变量以适应合约的时间单位
如果该指标帮助到您 请给予点赞谢谢!

Session Breaks, Market OpenSimple day breaker. Market Open with dashed lines for day and weekly breaks. Enjoy everyone!! Trade Safe Lads

Price Action and Key LevelsThe Price Action and Key Levels indicator is a powerful tool designed to help traders identify key price action patterns and significant support/resistance levels on their charts. It automatically detects swing highs and swing lows based on a user-defined lookback period and plots dynamic support and resistance levels. This indicator is ideal for traders who rely on price action and key levels for making informed trading decisions.

CBA PredictorPredicts by default 5 bars ahead. Uses a default lookback for calculations of 25 past bars, user can change look back period. User can change Fast and Slow moving averages. The predictor uses past data to predict forward data. The lookback data point default of 25 can be adjusted. When the value is less, example 10, it will be highly more accurate than default. Any comments or suggestions, let me know.

Kaufman Adaptive Moving Average (KAMA)A Média Móvel Adaptativa de Kaufman (KAMA) é um indicador técnico desenvolvido por Perry J. Kaufman em 1998. Diferentemente das médias móveis tradicionais, que atribuem pesos fixos aos dados, a KAMA ajusta dinamicamente sua sensibilidade às variações de preço, tornando-se mais responsiva em mercados com tendência definida e menos sensível em períodos de alta volatilidade ou movimentos laterais. 

Price Action Strategy - Engulfing with Trailing SLThis strategy:
Entry signals:
Bullish and bearish engulfing candle patterns
Optional volume filter (requires higher than average volume)
Optional trend filter (uses 50 EMA direction)
Optional RSI filter (buys oversold, sells overbought)
Exit mechanisms:
Trailing stop-loss based on percentage from current price
ATR-adjusted trailing to adapt to market volatility
Risk management:
ATR-based stop placement
Dynamic trailing that follows price momentum

Footprint Chart by Th16rryDescription of the "Footprint Chart" Indicator
This indicator is an approximation of a true **Footprint Chart** adapted for TradingView, which does not provide access to tick-by-tick data or detailed order book information. It relies on **heuristics** to estimate the distribution of volume between buyers and sellers for each candlestick.
Key Features:
- Estimation of Buy/Sell Volume:
The indicator splits the total volume of a candlestick into two parts based on the candle's nature:
- For a bullish candle (close > open), it assumes that **60% of the volume** is executed on the ask (buys) and **40% on the bid** (sells).
- For a bearish candle (close < open), the estimation is reversed (40% buys, 60% sells).
- For a neutral candle (close = open), the volume is evenly distributed at 50% for each side.
- Calculation of a Simplified Delta:
The delta is defined as the difference between the estimated buy volume and sell volume. This delta helps quickly identify the dominant market pressure—positive for buyer dominance and negative for seller dominance.
- Visual Display:
- A label is placed on each candlestick displaying the delta value, with a green background for a positive delta (indicating buying pressure) and red for a negative delta (indicating selling pressure).
- A table in the top-right corner of the chart summarizes the estimated volumes for the current candle: buy volume, sell volume, and total volume.
#### How to Use the Indicator:
- Analyzing Buy/Sell Pressure:
By observing the label's color and the delta value, a trader can quickly assess whether the market shows a dominant buying or selling pressure during a given candle.
- Complementing Other Tools:
This indicator can be used alongside other technical analysis tools, such as the Volume Profile or trend indicators, to gain a more comprehensive understanding of market behavior.
- Supporting Decision Making:
By providing a visual estimate of the volume distribution, it can help identify divergences between price movement and volume activity, which may signal potential reversals or confirm ongoing trends.
Limitations:
- Heuristic Approximation:
The method of volume distribution is based on simple assumptions and does not reflect the actual order flow, which would require tick-by-tick data to be accurately represented.
- Data Limitations on TradingView:
Due to TradingView’s restrictions on accessing detailed order book data, this indicator can only approximate a Footprint Chart and does not replace specialized tools.
In summary, the "Footprint Chart" indicator provides a visual and quick estimation of the volume distribution between buyers and sellers for each candlestick, offering valuable insights into order flow dynamics while remaining aware of its heuristic limitations.
Three Highs & Three Lows (Last 50 Candles) - Thicker Linesthis indicator shows three highs and three lows by analysis last 50 candles

Scalping Strategy//@version=5
strategy("Scalping Strategy", overlay=true)
// Indicators
ma50 = ta.sma(close, 50)
ema20 = ta.ema(close, 20)
ema200 = ta.ema(close, 200)
rsi = ta.rsi(close, 14)
osc = ta.stoch(close, high, low, 14)
vol = volume
// Trend Confirmation
bullishTrend = ema20 > ema200 and close > ma50
bearishTrend = ema20 < ema200 and close < ma50
// RSI Divergence Detection
rsiOverbought = rsi > 70
rsiOversold = rsi < 30
// Oscillator Confirmation
oscBull = osc < 20
oscBear = osc > 80
// Volume Confirmation
highVolume = vol > ta.sma(vol, 20)
// Entry Conditions
buySignal = bullishTrend and rsiOversold and oscBull and highVolume
sellSignal = bearishTrend and rsiOverbought and oscBear and highVolume
// Execute Trades
if buySignal
strategy.entry("Buy", strategy.long)
if sellSignal
strategy.entry("Sell", strategy.short)
// Plot indicators
plot(ma50, color=color.blue, title="MA 50")
plot(ema20, color=color.green, title="EMA 20")
plot(ema200, color=color.red, title="EMA 200")

Merged Trading Script [BigBeluga]Merger Of two pole oscillator and Volumatic variable dynamic average to create perfect sell and buy signals

Turtle Trading Mejorado para BTC 1Hturtle trading adapated to 1h
Canales Donchian:
Entrada: Periodo de 20 para detectar rupturas (largas y cortas).
Salida: Periodo de 10 para cerrar posiciones.
ATR (Average True Range):
Periodo de 14 para medir volatilidad y calcular el tamaño de las posiciones.
Gestión de Riesgo:
Riesgo por operación: 2% del capital.
Máximo de 4 unidades por posición.
Condiciones de Entrada:
Larga: Precio alto supera el máximo de 20 periodos.
Corta: Precio bajo cae por debajo del mínimo de 20 periodos.
Condiciones de Salida:
Larga: Precio bajo cae por debajo del mínimo de 10 periodos.
Corta: Precio alto supera el máximo de 10 periodos.
Añadir Unidades:
Se añaden unidades si el precio se mueve 0.5 ATR a favor, hasta 4 unidades.
Stop Loss:
Dinámico, basado en 2 ATR desde el precio de entrada.

FVG, Supply/Demand, Order Blocks with Volume & RSI Divergenceits a beginners analysis of using different strategies

Xtudo CCAIndicador com 5 ma, 5 ema, banda de Bollinger, nuvens Ichimoku, SuperTrend, vwma, ADX, MFI, RSI, MACD
