Hidden Zone Detector AI - Crypto/Forex/StockHidden Zone Detector AI - Crypto Forex Stock
Hidden Zone Detector AI is a professional TradingView indicator designed to find hidden supply and demand zones across markets — crypto, forex and stocks — and surface high-probability areas earlier than classical pivot-only methods. It combines price structure analysis, volatility/ATR sizing, volume profiling and multi-mode AI heuristics (Fast / Balanced / Accurate) to generate prediction zones, highlight tested areas, and visually mark zone breakouts. Built with practical trader workflow in mind: configurable anti-repaint options, adaptable Light/Dark UI, clear labels, and candle-coloring for immediate visual context.
How it works
• Detects hidden zones by scanning pivot formations and finding internal “hidden” bars that represent real institutional activity (not just visible swing points).
• Scores zones by size (ATR-relative), volume, and touch characteristics to produce a strength percentage (Weak/Medium/Strong).
• AI heuristics aggregate price, momentum, moving averages, RSI/MACD signals and volume patterns to propose prediction zones — adjustable for speed vs. accuracy.
• Zones are drawn as persistent boxes with optional midlines, labels, and tailored styling when broken or tested.
Main advantages
• Early edge: finds hidden zones that often act before obvious pivots.
• Actionable visuals: labeled zones, color-coded candles, and breakout styling speed decision-making.
• Flexible AI modes: choose Fast for responsiveness, Balanced for day-to-day use, or Accurate for stricter signals.
• Anti-repaint controls: require confirmed bars for predictions to improve signal reliability.
• Multi-market ready: tuned for crypto, forex and stock chart behavior.
• Light/Dark friendly: UI color handling ensures labels remain readable on any chart background.
• Open & reusable: released under Mozilla Public License 2.0 (MPL-2.0) — use and adapt freely with attribution.
Best practices & tips
• Start with Balanced mode and sensitivity ~5; increase sensitivity for earlier but noisier predictions.
• Use prediction confirmation (Require AI Prediction Confirmation) for lower repaint risk.
• Combine zone reads with higher-timeframe context and orderflow/volume tools for stronger entries.
• Adjust max active zones and opacity to keep charts clean on lower timeframes.
License & author
Mozilla Public License 2.0 (MPL-2.0).
Author: a_jabbaroff — created with care for the TradingView community and fellow traders.
Breakoutzone

Candle Breakout StrategyShort description (one-liner)
Candle Breakout Strategy — identifies a user-specified candle (UTC time), draws its high/low range, then enters on breakouts with configurable stop-loss, take-profit (via Risk:Reward) and optional alerts.
Full description (ready-to-paste)
Candle Breakout Strategy
Version 1.0 — Strategy script (Pine v5)
Overview
The Candle Breakout Strategy automatically captures a single "range candle" at a user-specified UTC time, draws its high/low as a visible box and dashed level lines, and waits for a breakout. When price closes above the range high it enters a Long; when price closes below the range low it enters a Short. Stop-loss is placed at the opposite range boundary and take-profit is calculated with a user-configurable Risk:Reward multiplier. Alerts for entries can be enabled.
This strategy is intended for breakout style trading where a clearly defined intraday range is established at a fixed time. It is simple, transparent and easy to adapt to multiple symbols and timeframes.
How it works (step-by-step)
On every bar the script checks the current UTC time.
When the first bar that matches the configured Target Hour:Target Minute (UTC) appears, the script records that candle’s high and low. This defines the breakout range.
A box and dashed lines are drawn on the chart to display the range and extended to the right while the range is active.
The script then waits for price to close outside the box:
Close > Range High → Long entry
Close < Range Low → Short entry
When an entry triggers:
Stop-loss = opposite range boundary (range low for longs, range high for shorts).
Take-profit = entry ± (risk × Risk:Reward). Risk is computed as the distance between entry price and stop-loss.
After entry the range becomes inactive (waitingForBreakout = false) until the next configured target time.
Inputs / Parameters
Target Hour (UTC) — the hour (0–23) in UTC when the range candle is detected.
Target Minute — minute (0–59) of the target candle.
Risk:Reward Ratio — multiplier for computing take profit from risk (0.5–10). Example: 2 means TP = entry + 2×risk.
Enable Alerts — turn on/off entry alerts (string message sent once per bar when an entry occurs).
Show Last Box Only (internal behavior) — when enabled the previous box is deleted at the next range creation so only the most recent range is visible (default behavior in the script).
Visuals & On-chart Info
A semi-transparent blue box shows the recorded range and extends to the right while active.
Dashed horizontal lines mark the range high and low.
On-chart shapes: green triangle below bar for Long signals, red triangle above bar for Short signals.
An information table (top-right) displays:
Target Time (UTC)
Active Range (Yes / No)
Range High
Range Low
Risk:Reward
Alerts
If Enable Alerts is on, the script sends an alert with the following formats when an entry occurs:
Long alert:
🟢 LONG SIGNAL
Entry Price:
Stop Loss:
Take Profit:
Short alert:
🔴 SHORT SIGNAL
Entry Price:
Stop Loss:
Take Profit:
Use TradingView's alert dialog to create alerts based on the script — select the script’s alert condition or use the alert() messages.
Recommended usage & tips
Timeframe: This strategy works on any timeframe but the definition of "candle at target time" depends on the chart timeframe. For intraday breakout styles, use 1m — 60m charts depending on the session you want to capture.
Target Time: Choose a time that is meaningful for the instrument (e.g., market open, economic release, session overlap). All times are handled in UTC.
Position Sizing: The script’s example uses strategy.percent_of_equity with 100% default — change default_qty_value or strategy settings to suit your risk management.
Filtering: Consider combining this breakout with trend filters (EMA, ADX, etc.) to reduce false breakouts.
Backtesting: Always backtest over a sufficiently large and recent sample. Pay attention to slippage and commission settings in TradingView’s strategy tester.
Known behavior & limitations
The script registers the breakout on close outside the recorded range. If you prefer intrabar breakout rules (e.g., high/low breach without close), you must adjust the condition accordingly.
The recorded range is taken from a single candle at the exact configured UTC time. If there are missing bars or the chart timeframe doesn't align, the intended candle may differ — choose the target time and chart timeframe consistently.
Only a single active position is allowed at a time (the script checks strategy.position_size == 0 before entries).
Example setups
EURUSD (Forex): Target Time 07:00 UTC — captures London open range.
Nifty / Index: Target Time 09:15 UTC — captures local session open range.
Crypto: Target Time 00:00 UTC — captures daily reset candle for breakout.
Risk disclaimer
This script is educational and provided as-is. Past performance is not indicative of future results. Use proper risk management, test on historical data, and consider slippage and commissions. Do not trade real capital without sufficient testing.
Change log
v1.0 — Initial release: range capture, box and level drawing, long/short entry by close breakout, SL at opposite boundary, TP via Risk:Reward, alerts, info table.
If you want, I can also:
Provide a short README version (2–3 lines) for the TradingView “Short description” field.
Add a couple of suggested alert templates for the TradingView alert dialog (if you want alerts that include variable placeholders).
Convert the disclaimer into multiple language versions.

HTF Cross Breakout [CHE] HTF Cross Breakout — Detects higher timeframe close crossovers for breakout signals, anchors VWAP for trend validation, and flags continuations or traps with visual extensions for delta percent and stop levels.
Summary
This indicator spots moments when the current chart's close price crosses a higher timeframe close, marking potential breakouts only when the current bar shows directional strength. It anchors a volume-weighted average price line from the breakout point to track trend health, updating labels to show if the move continues or reverses into a trap. Extensions add a dotted line linking the breakout level to the current close with percent change display, plus a stop-loss marker at the VWAP end. Signals gain robustness from higher timeframe confirmation and anti-repainting options, reducing noise in live bars compared to simple crossover tools.
Motivation: Why this design?
Traders often face false breakouts from intrabar wiggles on lower timeframes, especially without higher timeframe alignment, leading to whipsaws in volatile sessions. This design uses higher timeframe close as a stable reference for crossover detection, combined with anchored volume weighting to gauge sustained momentum. It addresses these by enforcing bar confirmation and directional filters, providing clearer entry validation and risk points without overcomplicating the chart.
What’s different vs. standard approaches?
Reference baseline
Standard crossover indicators like moving average crosses operate solely on the chart timeframe, ignoring higher timeframe context and lacking volume anchoring.
Architecture differences
- Higher timeframe data pulls via security calls with optional repainting control for stability.
- Anchored VWAP resets at each signal, accumulating from the breakout bar only.
- Label dynamics update in real-time for continuation checks, with extensions for visual delta and stop computation.
- Event-driven line finalization prunes old elements after a set bar extension.
Practical effect
Charts show persistent lines and labels that extend live but finalize cleanly on new events, avoiding clutter. This matters for spotting trap reversals early via label color shifts, and extensions provide quick risk visuals without manual calculations, improving decision speed in trend trades.
How it works (technical)
The indicator first determines a higher timeframe based on user selection, pulling its close price securely. It checks for crossovers or crossunders of the current close against this higher close, but only triggers on confirmed bars with matching directional opens and closes. On a valid event, a horizontal line and label mark the higher close level, while a dashed VWAP line starts accumulating typical price times volume from that bar onward. During the active phase, the breakout line extends to the current bar, the label repositions and updates text based on whether the current close holds above or below the level for bulls or bears. A background tint warns if the close deviates adversely from the current VWAP. Extensions draw a vertical dotted line at the last bar between the breakout level and close, placing a midpoint label with percent difference; separately, a label at the VWAP end shows a computed stop price. Persistent variables track the active state and accumulators, resetting on new events after briefly extending old elements. Repaint risk from security calls is mitigated by confirmed bar gating or user opt-in.
Parameter Guide
Plateau Length (reserved for future, currently unused): Sets a length for potential plateau detection in extensions; default 3, minimum 1. Higher values would increase stability but are not active yet—leave at default to avoid tuning.
Line Width: Controls thickness of breakout, VWAP, and extension lines; default 2, range 1 to 5. Thicker lines improve visibility on busy charts but may obscure price action—use 1 for clean views, 3 or more for emphasis.
+Bars after next HTF event (finalize old, then delete): Extends old lines and labels by this many bars before deletion on new signals; default 20, minimum 0. Shorter extensions keep charts tidy but risk cutting visuals prematurely; longer aids review but builds clutter over time.
Evaluate label only on HTF close (prevents gray traps intrabar): When true, label updates wait for higher timeframe confirmation; default true. Enabling reduces intrabar flips for stabler signals, though it may delay feedback—disable for faster live trading at repaint cost.
Allow Repainting: Permits real-time security data without confirmation offset; default false. False ensures historical accuracy but lags live bars; true speeds updates but can repaint on HTF closes.
Timeframe Type: Chooses HTF method—Auto Timeframe (dynamic steps up), Multiplier (chart multiple), or Manual (fixed string); default Auto Timeframe. Auto adapts to chart scale for convenience; Multiplier suits custom scaling like 5 times current; Manual for precise like 1D on any chart.
Multiplier for Alternate Resolution: Scales chart timeframe when Multiplier type selected; default 5, minimum 1. Values near 1 mimic current resolution for subtle shifts; higher like 10 jumps to broader context, increasing signal rarity.
Manual Resolution: Direct timeframe string like 60 for 1H when Manual type; default 60. Match to trading horizon—shorter for swing, longer for positional—to balance frequency and reliability.
Show Extension 1: Toggles dotted line and delta percent label between breakout level and current close; default true. Disable to simplify for basic use, enable for precise momentum tracking.
Dotted Line Width: Thickness for Extension 1 line; default 2, range 1 to 5. Align with main Line Width for consistency.
Text Size: Size for delta percent label; options tiny, small, normal, large; default normal. Smaller reduces overlap on dense charts; larger aids glance reads.
Decimals for Δ%: Precision in percent change display; default 2, range 0 to 6. Fewer decimals speed reading; more suit low-volatility assets.
Positive Δ Color: Hue for upward percent changes; default lime. Choose contrasting for visibility.
Negative Δ Color: Hue for downward percent changes; default red. Pair with positive for quick polarity scan.
Dotted Line Color: Color for Extension 1 line; default gray. Neutral tones blend well; brighter for emphasis.
Background Transparency (0..100): Opacity for delta label background; default 90. Higher values fade for subtlety; lower solidifies for readability.
Show Extension 2: Toggles stop-loss label at VWAP end; default true. Turn off for entry focus only.
Stop Method: Percent from VWAP end or fixed ticks; options Percent, Ticks; default Percent. Percent scales with price levels; Ticks suits tick-based instruments.
Stop %: Distance as fraction of VWAP for Percent method; default 1.0, step 0.05, minimum 0.0. Tighter like 0.5 reduces risk but increases stops; wider like 2.0 allows breathing room.
Stop Ticks: Tick count offset for Ticks method; default 20, minimum 0. Adjust per asset volatility—fewer for tight control.
Price Decimals: Rounding for stop price text; default 4, range 0 to 10. Match syminfo.precision for clean display.
Text Size: Size for stop label; options tiny, small, normal, large; default normal. Scale to chart zoom.
Text Color: Foreground for stop text; default white. Ensure contrast with background.
Inherit VWAP Color (BG tint): Bases stop label background on VWAP hue; default true. True maintains theme; false allows custom black base.
BG Transparency (0..100): Opacity for stop label background; default 0. Zero for no tint; up to 100 for full fade.
Reading & Interpretation
Breakout lines appear green for bullish crosses or red for bearish, extending live until a new event finalizes them briefly then deletes. Labels start blank, updating to Bull Cont. or Bear Cont. in matching colors if holding the level, or gray Bull Trap/Bear Trap on reversal. VWAP dashes yellow for bulls, orange for bears, sloping with accumulated volume weight—deviations trigger faint red background warnings. Extension 1's dotted vertical shows at the last bar, with midpoint label green/red for positive/negative percent from breakout to close. Extension 2 places a left-aligned label at VWAP end with stop price and method note, tinted to VWAP for context.
Practical Workflows & Combinations
For trend following, enter long on green Bull Cont. labels above VWAP with higher highs confirmation, filtering via rising structure; short on red Bear Cont. below. Pair with volume surges or RSI above 50 for bulls to avoid traps. For exits, trail stops using the Extension 2 level, tightening on warnings or gray labels—aggressive on continuations, conservative post-trap. In multi-timeframe setups, use default Auto on 15m charts for 1H signals, scaling multiplier to 4 for daily context on hourly; test on forex/stocks where volume is reliable, avoiding low-liquidity assets.
Behavior, Constraints & Performance
Signals confirm on bar close with HTF gating when strict mode active, but live bars may update if repainting enabled—opt false for backtest fidelity, true for intraday speed. Security calls risk minor repaints on HTF closes, mitigated by confirmation offsets. Resources cap at 1000 bars back, 50 lines/labels total, with event prunes to stay under budgets—no loops, minimal arrays. Limits include VWAP lag in low-volume periods and dependency on accurate HTF data; gaps or holidays may skew anchors.
Sensible Defaults & Quick Tuning
Defaults suit 5m-1H charts on liquid assets: Auto HTF, no repaint, 1% stops. For choppy markets with excess signals, enable strict eval and bump multiplier to 10 for rarer triggers. If sluggish in trends, shorten extend bars to 10 and allow repainting for quicker visuals. On high-vol like crypto, widen stop % to 2.0 and use Ticks method; for stables like indices, tighten to 0.5% and keep Percent.
What this indicator is—and isn’t
This is a signal visualization layer for breakout confirmation and basic risk marking, best as a filter in discretionary setups. It isn’t a standalone system or predictive oracle—combine with price structure, news awareness, and sizing rules for real edges.
Disclaimer
The content provided, including all code and materials, is strictly for educational and informational purposes only. It is not intended as, and should not be interpreted as, financial advice, a recommendation to buy or sell any financial instrument, or an offer of any financial product or service. All strategies, tools, and examples discussed are provided for illustrative purposes to demonstrate coding techniques and the functionality of Pine Script within a trading context.
Any results from strategies or tools provided are hypothetical, and past performance is not indicative of future results. Trading and investing involve high risk, including the potential loss of principal, and may not be suitable for all individuals. Before making any trading decisions, please consult with a qualified financial professional to understand the risks involved.
By using this script, you acknowledge and agree that any trading decisions are made solely at your discretion and risk.
Do not use this indicator on Heikin-Ashi, Renko, Kagi, Point-and-Figure, or Range charts, as these chart types can produce unrealistic results for signal markers and alerts.
Best regards and happy trading
Chervolino

RSI Strength & Consolidation Zones (Zeiierman)█ Overview
RSI Strength & Consolidation Zones (Zeiierman) is a hybrid momentum and volatility visualization tool that blends enhanced RSI interpretation with ADX-driven consolidation detection. This indicator doesn't just show where RSI is trending — it interprets how strong that trend is, when that strength changes, and where the market may be consolidating in anticipation of breakout movement.
Using a combination of Kalman-filtered RSI, custom-built DMI/ADX, and low-volatility zone recognition, it gives traders a dynamic RSI with strength-based coloring, while also highlighting consolidation zones to spot breakout opportunities.
█ Its uniqueness
Traditional RSI indicators lack context. They may show you when the market is overbought or oversold, but they won’t tell you how strong that condition is, or whether it’s likely to result in continuation or consolidation.
This tool aims to solve that by introducing adaptive strength metrics and structural compression zones, allowing traders to anticipate when the market is likely preparing for a move.
█ How It Works
⚪ Enhanced RSI
Combines traditional RSI and a custom RSI implementation
Smooths both through a Kalman filter for trend direction
Final RSI line reflects smoothed consensus between manual and built-in RSI
Adds an RSI + Strength overlay to show when the directional conviction is increasing
⚪ ADX-Driven Strength Layer
Directional Movement Index (DMI) is calculated both manually and with built-in smoothing
The average ADX value is used to calculate a strength modifier
When ADX exceeds 20, RSI is dynamically enhanced or dampened to reflect directional force
Resulting visual: RSI appears stronger or weaker based on confirmed trend conditions
⚪ Consolidation Zone Detection
When ADX falls below 20, the indicator enters a consolidation zone state
Boxes are drawn dynamically to contain the price within these low-volatility structures
Once the price breaks out of the zone, the indicator plots a breakout signal (▲ or ▼)
⚪ Breakouts
Breakout markers are placed at the first close outside the consolidation box
These signals serve as early indicators for potential trend continuation or reversal
█ How to Use
⚪ Confirm Momentum Strength
Use the RSI + Strength line to determine whether current momentum is backed by trend conviction. If strength expands alongside rising RSI, the move has confirmation.
⚪ Consolidations Zones
When RSI is around the midline, and a consolidation box appears, expect lower volatility and a range-bound market, followed by a breakout.
⚪ Use Breakout Signals for Entry
Look for ▲ or ▼ markers as early triggers. These often coincide with volume expansions or structural breaks.
█ Settings Explained
RSI Length – Number of bars used for RSI. Shorter = more sensitive.
DMI Length – Used in both custom and built-in ADX/DI calculations.
ADX Smoothing – Smooths the trend strength signal. Higher values = smoother strength detection.
Trend Confirmation (Filter Strength) – Adjusts the responsiveness of the Kalman filter.
-----------------
Disclaimer
The content provided in my scripts, indicators, ideas, algorithms, and systems is for educational and informational purposes only. It does not constitute financial advice, investment recommendations, or a solicitation to buy or sell any financial instruments. I will not accept liability for any loss or damage, including without limitation any loss of profit, which may arise directly or indirectly from the use of or reliance on such information.
All investments involve risk, and the past performance of a security, industry, sector, market, financial product, trading strategy, backtest, or individual's trading does not guarantee future results or returns. Investors are fully responsible for any investment decisions they make. Such decisions should be based solely on an evaluation of their financial circumstances, investment objectives, risk tolerance, and liquidity needs.

ORB - Futures and Stocks (Breakouts + Alerts + ORB Selector)This indicator shows the Opening Range Breakout (ORB) based on the time range you choose.
Important:
It only works for intraday trading on time frames less than 1 day (like 1-minute, 5-minute, or hourly charts).
You can use it with any stock or futures, such as US500, NAS100, or GER40.
Inputs:
ORB Range - Your preference.
Session Start
Time Zone Offset
Examples:
for EU Frankfurt, DAX (GER40):
Set your ORB range
Session Start 0900
Time Zone Offset +1
For US Stock Market and US500, NAS100:
Set your ORB range
Session Start 0930
Time Zone Offset -5
Created using ChatGPT

ADR Checker - Breakouts📈 ADR Checker – Breakouts
Gain the edge by knowing when a stock has already made its move.
🚀 What It Does:
The ADR Checker - Breakouts is a powerful yet simple visual tool that helps traders instantly assess whether a stock has already exceeded its Average Daily Range (ADR) for the day — a critical piece of information for momentum traders, swing traders, and especially those following breakout, VCP, or CANSLIM strategies.
Using a customizable on-screen table that always stays in view (regardless of zoom or chart scaling), this script shows:
✅ Average ADR% – 20-day average range, calculated in %.
📊 Today’s Move – how much the stock has moved today.
🔥 % of Avg ADR – today's move relative to its historical average, with live color feedback:
🟥 Over 100% (Overextended – danger!)
🟧 70-100% (Caution zone)
🟩 Below 70% (Room to move)
💡 Why It Matters:
One of the most overlooked mistakes by breakout traders is entering a trade after the move has already happened. If a stock has already moved more than its typical daily range, the odds of further continuation sharply decrease, while the risk of pullback or chop increases.
With this tool, you can:
🚫 Avoid chasing extended breakouts
🎯 Time entries before the real move
⚠️ Quickly assess risk/reward potential intraday
🧠 Example Use Case:
Imagine you're watching a classic VCP setup or flat base breakout. The stock breaks out on volume—but when you check this indicator, you see:
Today’s Move: 7.2%
Avg ADR: 5.3%
% of ADR: 135% 🟥
This tells you the stock is already well beyond its average daily range. While it may continue higher, odds now favor a consolidation, shakeout, or pullback. This is your cue to wait for a better entry or pass entirely.
On the flip side, if the breakout just started and the % of ADR is still under 50%, you have confirmation that there’s room to run — giving you more confidence to enter early.
⚙️ Fully Customizable:
Choose position on screen (top/bottom left/right)
Customize text color, background, and size
🔧 Install This Tool and:
✅ Stop chasing extended moves
✅ Add discipline to your entries
✅ Improve your breakout win rate
Perfect for VCP, CANSLIM, and BREAKOUT traders who want a clean, edge-enhancing visual guide.

Volatility Breaker Blocks [BigBeluga]The Volatility Breaker Blocks indicator identifies key market levels based on significant volatility at pivot highs and lows. It plots blocks that act as potential support and resistance zones, marked in green (support) and blue (resistance). Even after a breakout, these blocks leave behind shadow boxes that continue to impact price action. The sensitivity of block detection can be adjusted in the settings, allowing traders to customize the identification of volatility breakouts. The blocks print triangle labels (up or down) after breakouts, indicating potential areas of interest.
🔵 IDEA
The Volatility Breaker Blocks indicator is designed to highlight key areas in the market where volatility has created significant price action. These blocks, created at pivot highs and lows with increased volatility, act as potential support and resistance levels.
The idea is that even after price breaks through these blocks, the remaining shadow boxes continue to influence price movements. By focusing on volatility-driven pivot points, traders can better anticipate how price may react when it revisits these areas. The indicator also captures the natural tendency for price to retest broken resistance or support levels.
🔵 KEY FEATURES & USAGE
◉ High Volatility Breaker Blocks:
The indicator identifies areas of high volatility at pivot highs and lows, plotting blocks that represent these zones. Green blocks represent support zones (identified at pivot lows), while blue blocks represent resistance zones (identified at pivot highs).
Support:
Resistance:
◉ Shadow Blocks after Breakouts:
When price breaks through a block, the block doesn't disappear. Instead, it leaves behind a shadow box, which can still influence future price action. These shadow blocks act as secondary support or resistance levels.
If the price crosses these shadow blocks, the block stops extending, and the right edge of the box is fixed at the point where the price crosses it. This feature helps traders monitor important price levels even after the initial breakout has occurred.
◉ Triangle Labels for Breakouts:
After the price breaks through a volatility block, the indicator prints triangle labels (up or down) at the breakout points.
◉ Support and Resistance Retests:
One of the key concepts in this indicator is the retesting of broken blocks. After breaking a resistance block, price often returns to the shadow box, which then acts as support. Similarly, after breaking a support block, price tends to return to the shadow box, which becomes a resistance level. This concept of price retesting and bouncing off these levels is essential for understanding how the indicator can be used to identify potential entries and exits.
The natural tendency of price to retest broken resistance or support levels.
Additionaly indicator can display retest signals of broken support or resistance
◉ Customizable Sensitivity:
The sensitivity of volatility detection can be adjusted in the settings. A higher sensitivity captures fewer but more significant breakouts, while a lower sensitivity captures more frequent volatility breakouts. This flexibility allows traders to adapt the indicator to different trading styles and market conditions.
🔵 CUSTOMIZATION
Calculation Window: Defines the window of bars over which the breaker blocks are calculated. A larger window will capture longer-term levels, while a smaller window focuses on more recent volatility areas.
Volatility Sensitivity: Adjusts the threshold for volatility detection. Lower sensitivity captures smaller breakouts, while higher sensitivity focuses on larger, more significant moves.
Retest Signals: Display or hide retest signals of shadow boxes

Price & Volume Breakout Fibonacci Probability [TradeDots]📝 OVERVIEW
The "Price & Volume Breakout Fibonacci Probability" indicator is designed to detect the probability of the maximum run-up and drawdown of each breakout trade on an asset, assisting traders in optimizing their take profit and stop loss strategies.
🧮 CALCULATIONS
The algorithm detects price and volume breakouts to activate the Fibonacci levels displayed on the chart. It calculates these levels using the period pivot high and low, with the close price of the breakout bar as the reference price.
The indicator then forward-tests within an user-selected number of bars, detecting the maximum run-up and drawdown during that period. Consequently, it calculates the probability of the price hitting either side of the Fibonacci levels, showing the likelihood of reaching take profit and stop loss targets for each breakout trade.
📊 EXAMPLE
The above example shows two breakout trades, circled within the yellow rectangle zone.
The first trade has a maximum run-up above the +0.382 Fibonacci level zone and a maximum drawdown below the -0.618 Fibonacci level zone.
When the price reaches the maximum run-up, it only has a ~45% probability of moving further upward into the last two zones (25% + 19.44%). This indicates that setting a take profit at a higher level may have less than a 50% chance of success.
Conversely, when the price reaches its maximum drawdown, there is only an ~8% probability of moving further downward into the last drawdown zone. This could indicate a potential reversal.
⚙️ SETTINGS
Breakout Condition: Determines the type of breakout condition to track: "Price", "Volume", "Price & Volume".
Backtest Period: The maximum run-up and drawdown are detected within this bar period.
Price Breakout Period: Specifies the number of bars the price needs to break out from.
Volume Breakout Period: Specifies the number of bars the volume needs to break out from.
Trendline Confirmation: Confirms that the close price needs to be above the trendline.
📈 HOW TO USE
By understanding the probabilities of price movements to both the upside and downside, traders can set take profit and stop loss targets with greater accuracy.
For instance, placing a stop loss order below the zone with the highest probability minimizes the chances of being stopped out of a profitable trade. Conversely, setting a take profit target at the zone with the highest probability increases the win rate.
Additionally, if the price breaches multiple Fibonacci levels during the breakout period, it may indicate an abnormal state, signaling a potential reversal or pullback. This can help traders exit trades in a timely manner.
Traders can adjust their take profit and stop loss levels based on their individual risk tolerance.
RISK DISCLAIMER
Trading entails substantial risk, and most day traders incur losses. All content, tools, scripts, articles, and education provided by TradeDots serve purely informational and educational purposes. Past performances are not definitive predictors of future results.

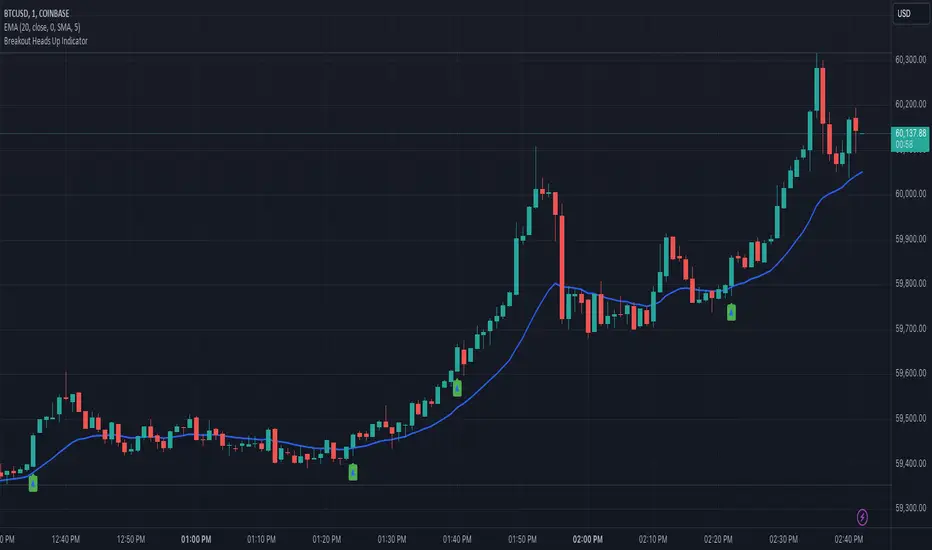
Heads UpAn indicator that gives you the "heads up" that that bullish/ bearish strength is increasing.
I wanted an indicator that could give me the "heads up" that bullish/ bearish strength is increasing. This would help me get into a breakout early or avoid entering a breakout that had a high probability of failure.
Here are my definitions for this indicator:
My bull bar definition:
- A green candle that closes above 75% of it's candle range.
- The candle's body does not overlap the previous candle's body. Tails/ wicks CAN overlap.
My bear bar definition:
- A red candle that closes below 75% of it's candle range.
- the candle's body does not overlap the previous candle's body. Tails/ ticks CAN overlap.
Bullish strength increasing (arrow up):
- Bull bars are increasing in size (the candle's range) compared to previous 5 bars.
- 2 consecutive bull bars.
Bearish strength increasing (arrow down):
- Bear bars are increasing in size (the candle's range) compared to previous 5 bars.
- 2 consecutive bear bars.
You will not see this indicator trigger very often but when it does - it's because there is a change in bullish bearish strength.
Things to be aware of:
Use the indicator in line with the context of the previous trend. You will get triggers that fail. These are usually because they appear counter trend. When in doubt zoom out.
It will not call every successful breakout. If you understand the definitions you'll understand why it appears.
This is my first indicator and used for my personal use. Feedback and other ideas are welcome.
Main Market Opener Breakout [RH]Based on my observations while analyzing the crypto and forex charts, particularly BTCUSDT and EURUSD, I have noticed that the prices exhibit significant movements during most stock market sessions, particularly during New York main market session.
With the aim of capturing these moves, I embarked on extensive research. Through this research, I discovered that by considering the very first "15m" or "30m" candle of the main market trading session and marking that first candle's high and low points, we can create potential trigger points.
A break above the high point indicates a bullish signal, while a break below the low point suggests a bearish signal. To further refine our analysis and filter out some noise, we can incorporate the Average True Range (ATR) value of that candle.
Candle time is very important here. We will mark the candle when the actual trading begins in New York stock exchange. The trading hours for the New York Stock Exchange (NYSE) typically begin at 9:30 AM and end at 4:00 PM Eastern Time (ET), Monday through Friday. This is known as the "NYSE Regular Trading Session." However, it's important to note that there are also pre-market and after-hours trading sessions that occur outside of these core hours. We will not consider these pre and after-hours.
Example:
First break-above and break-below is marked automatically and alerts are also available for first breaks.
Example:
I have also added the option to add the, London Stock Exchange Main Market and Tokyo Stock Exchange Regular Trading Session. You can add those sessions also and test with different symbols.
Stocks symbols from different stock exchanges just mark the very first candle of the day(main market trading session).
Alerts are available.
