EMA Buy/Sell & Smart Zones(5Min TF only)### **Indicator Title:**
**EMA Buy/Sell & Smart Zones**
---
### **Description:**
**EMA Buy/Sell & Smart Zones** is a specialized intraday trading tool designed to combine trend analysis with precise market structure zones. This script utilizes a custom tracking algorithm to identify the **specific candle** that formed the previous session's high or low, allowing it to plot accurate Supply and Demand zones for the current trading day.
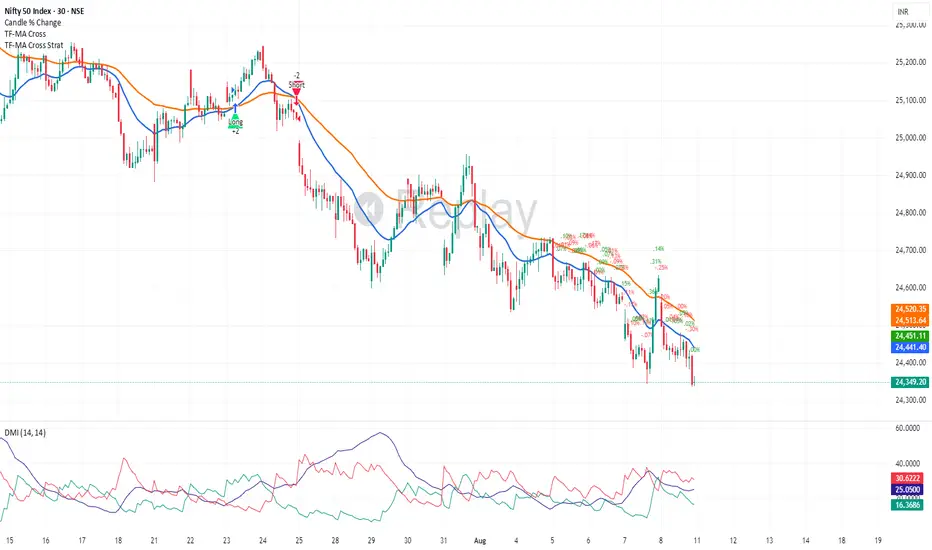
This indicator has been rigorously tested on the **Nifty Index** and is optimized for use on the **5-minute timeframe**.
### **Key Features**
**1. Smart Session Wick Zones ("True Wick" Logic)**
The indicator automatically scans every candle of the previous session to locate the exact price action that formed the day's extremes.
* **Smart High Zone:** Identifies the specific candle that made yesterday's High and plots a zone from that High down to that candle's Open or Close (based on body direction).
* **Smart Low Zone:** Identifies the specific candle that made yesterday's Low and plots a zone from that Low up to that candle's Open or Close.
* **Close Range:** Highlights the High-Low range of the very last candle of the previous session to show the closing sentiment.
*All zones automatically stop extending at the end of the current session, ensuring the chart remains clean and historically accurate.*
**2. EMA Trend System**
The script plots three key Exponential Moving Averages to define market direction:
* **EMA 21:** Captures short-term momentum.
* **EMA 63:** Defines the medium-term trend.
* **EMA 1575:** Establishes the long-term baseline.
**3. Buy/Sell Signals**
Clear signals are generated on the chart based on specific criteria:
* **BUY Signal:** Generated when a green candle closes above the EMA 21 and EMA 63.
* **SELL Signal:** Generated when a red candle closes below the EMA 21 and EMA 63.
* *Note: The logic includes a filter to alternate signals (Buy -> Sell -> Buy), preventing clutter during choppy markets.*
### **How to Use**
* **Recommended Timeframe:** **5 Minutes**.
* **Recommended Markets:** Indices (Nifty, Bank Nifty) and high-volume stocks.
* **Workflow:**
* Use the **Smart Zones** (Red/Green boxes) to identify potential rejection areas or breakout targets.
* Use the **Buy/Sell Labels** as confirmation triggers when price is reacting near these zones or trending strongly above/below the EMAs.
### **Settings & Customization**
* **Visibility Control:** Toggle each box type (High, Low, Close) and text labels on or off individually.
* **Color Customization:** Fully adjustable colors for all EMAs, Zone Backgrounds, Borders, and Text Labels to suit your chart theme.
* **Label Size:** Adjust the text size of the zone labels directly from the settings menu.
---
**Disclaimer:** This tool is for educational purposes and should be used to assist your analysis. Always manage your risk appropriately.