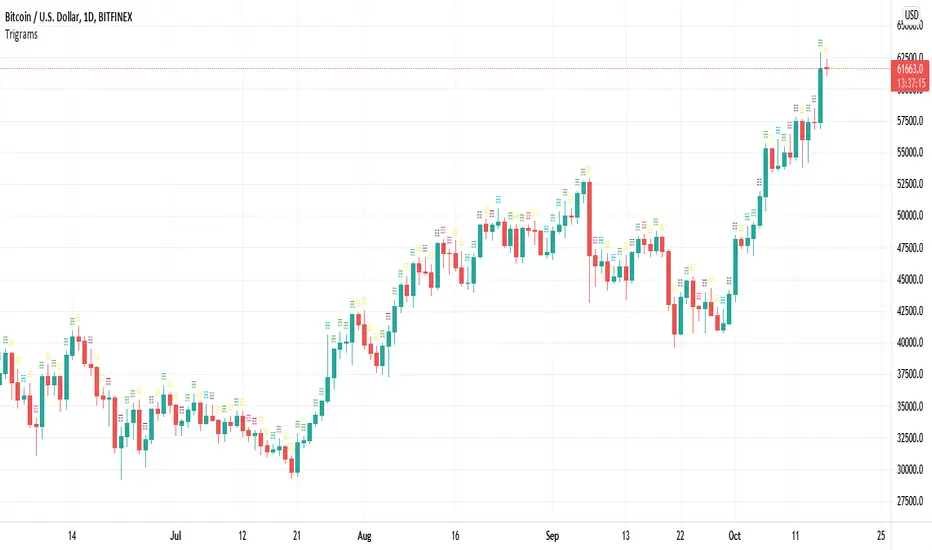
Trigrams based on Candle PatternThis script matches a Trigram for the current candle from its pattern Bullish/Bearish: Marubozu, Hammer, Inverted Hammer, Spinning Top.
The source for Trigram to candlestick pattern can be found online. I'm missing the reputation to add the link here.
Heaven = Bearish Marubozu
Earth = Bullish Marubozu
Thunder = Bearish Spinning Top
Water = Bullish Inverted Hammer
Mountain = Bullish Hammer
Wind = Bullish Spinning Top
Flame = Bearish Hammer
Lake = Bearish Inverted Hammer
The idea is simple. It takes the current candles pattern to match the Trigram.
Inspired by the Trigram Script from ByzantineSC
Anyways, not sure what use it is yet, but if there is anyone else out there interested in I Ching, Yin/Yang theory and trading, this is for you.
Analyse en chandelier
Zigzag Candles MAWe have the candles here: Zigzag-Candles
Lets create moving average!!
Just simple moving average at the moment. Since, items are in array. Not so easy to use standard functions of pine. Hence, will take that for future enhancements.
ATR and Supertrend next!!
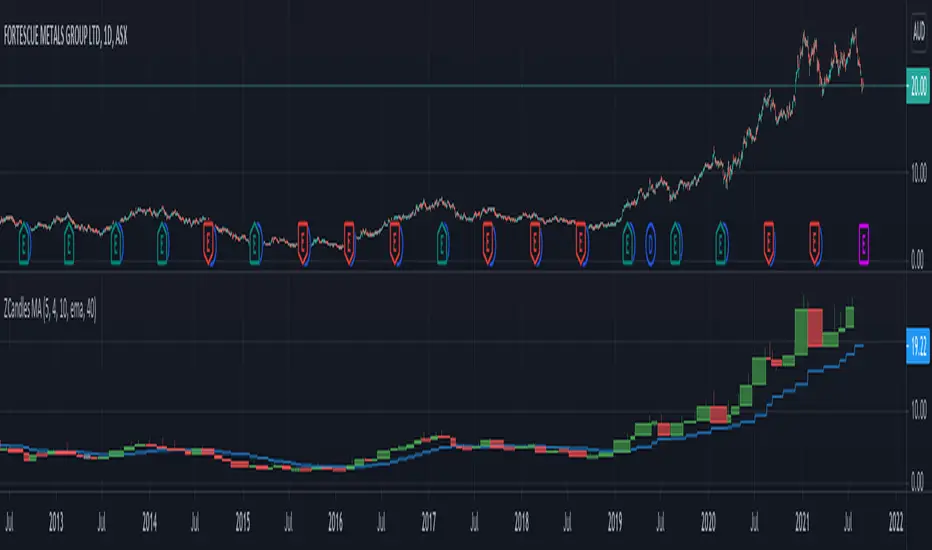
Zigzag CandlesCan't deny that I am obsessed with zigzags. Been doing some crazy experiments with it and have many more in pipeline. I believe zigzag can be used to derive better trend following methods. Here is an attempt to visualize zigzag as candlesticks. Next steps probably to derive moving average, atr (although there was an attempt of AZR made earlier) and probably supertrend too ;)
Input parameters include ZigzagLength (to calculate zigzag) and CandleSize (number of zigzag pivots in each candle)
CandleSize can be 3 or more. Every time we collect pivots which are equal to CandleSize, we derive one candle. And when we derive a candle, we remove all old pivots except the last one. Becauase, the last pivot acts as open to the next bar and is required.
Body of the candle tells the start and end zigzag pivot in the range. And Wicks signify highest and lowest pivots in the range. High and Low wicks are placed at the pivot where high and lows are formed. Hence, you can see them at different positions each time.
Thanks to @RicardoSantos for suggesting boxes for candles - while I was trying to achieve this with plotbar

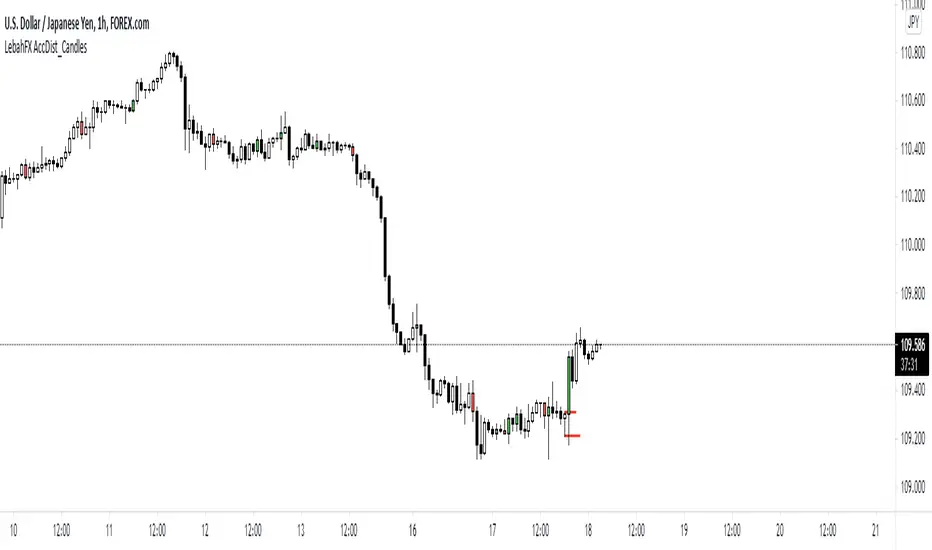
LebahFX AccDist_CandlesLebahFX Indicator that showing Accumulation and Distribution Signal in HTF Candlestick
Price ActionFirst, you have to know price action, RTM price action Handbook could help you
this indicator shows you base and momentum candles
base candles could be zones of trade that show you fighting of bulls and bears, and momentum candles could show the power of those zones.
Base candles are white in the chart, and you can place your order at the good zone.
Rally candles and drop candles are momentum candles, and bold rally and bold drop show that it is more powerful than its before candle.
Zigzag compression is one way that shows the compression in trend.
it looks like the Wedges pattern at classic technical that shows pending orders are closed, so the target zone could be powerful to reverse the trend.
Black background of candle means that candle doesn't reach its before candle and so it is poor candle, I named it domination.
It is better to do not trade at poor candles.
At the end, I find Price action the best way to trade, and it makes you free of other indicator, even volume indicator.
This indicator is good for those who use price action strategy to trade and those who want to learn the price action.
It could be so helpful and reliable way to find the zones, and place buy or sell order and the target, specially for scalping.

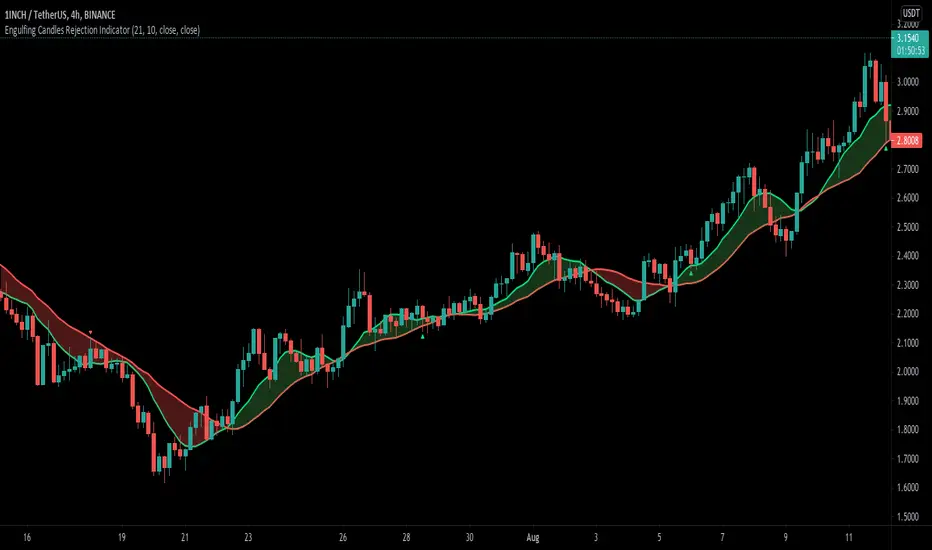
Engulfing Candle Rejection IndicatorThis indicator allows you to filter noisy chart, with engulfing candles which have been rejected from current trend lines. Trend lines by default are 21 MA (fast) and 10 MA (slow one). If fast moving average is greater than slower one, automatically indicator would represent that like uptrend, and if opposite then like a downtrend.
Consider to work only on higher time frames like 1H and higher, so you really can find only best entries.
Have fun, best wishes!
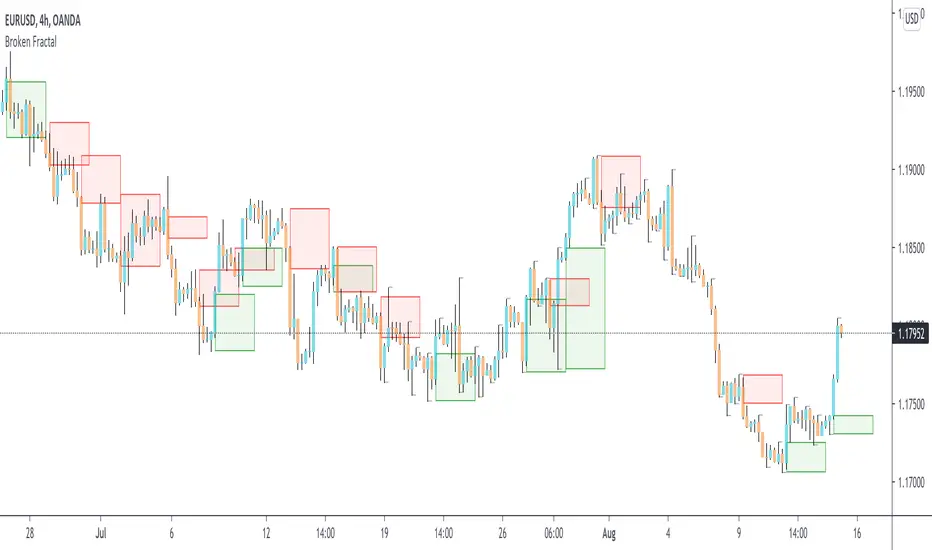
Broken Fractal : Someone's broken dream is your profit!Idea
The idea is simple : when market turns around, it traps a bunch of traders off guard. We trade with them, in the same direction of their exit!
Method
We let the market first create a fractal
We then let the market create an opposite fractal
We then let the market break the first fractal it created, thereby trapping lots of trades in the process
We then patiently wait till the market gives these trapped traders a chance to exit - and we trade in the same direction
How to use?
Green boxes are for long entry, red boxes are for short.
Whenever a box appears, that's the risk criteria - setup limit orders and trade along!
Works on all timeframes
If you like this script, please leave a note on how you are using it.
I personally use it with Higher Timeframe bias.
PS1 : some traders call this Break of market structure, some call it Breaker, I just call it "Broken Fractal"
PS2 : Break of a broken fractal is also very potent. Watch out for those!
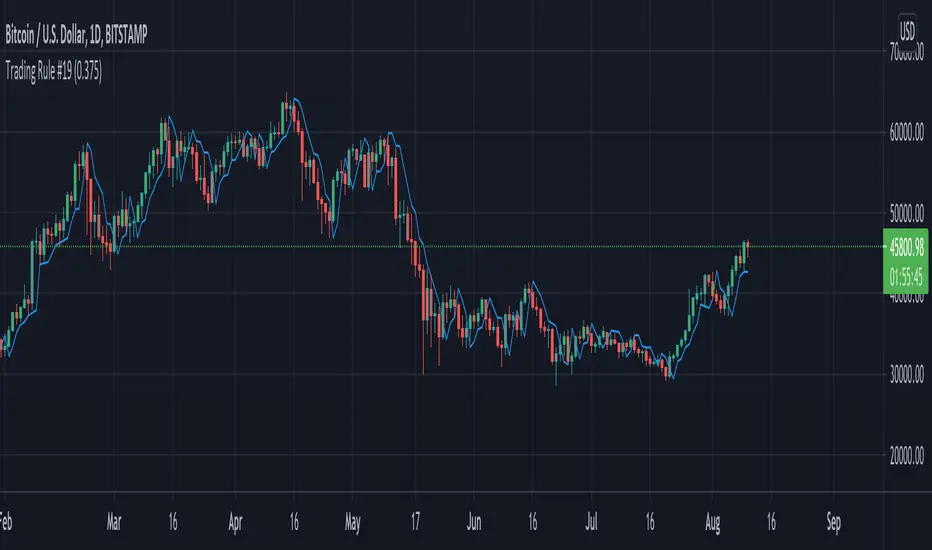
Trading Rule #19This script is based on Trading Rule #19 from Chester Keltner's book How To Make Money On Commodities. It is best applied to candlestick charts with longer time frames and plans with minimal losses (i.e. swing trades). The rule is based on "Key" trend days (this is applied to daily charts in the book).
An initial Key-Up day is established on the third day of 3 consecutive new highs. Subsequent key-up days are determined as follows:
1. The first day following an initial key-up day trades 0.375% above the previous key-up day
2. The second day or any following day trades 0.125% above the previous key-up day
An initial Key-Down day is established on the third day of 3 consecutive new lows. Subsequent key-down days are determined as follows:
1. The first day following an initial key-up day trades 0.375% below the previous key-down day
2. The second day or any following day trades 0.125% below the previous key-down day
Green candles are considered up-trend, red candles are down-trend. Gray candles are undecided - when there is a new high and low in the same time frame, when there is no new high or low in that time frame, or the order price was cleared.
Order prices are represented as a blue line, with some days being "na" when order prices remain unchanged. On key-up days, orders are placed 0.375% below the low of the previous key-up day or the day previous (whichever is lower). Order prices on key-down days are placed 0.375% above the high of the previous key-down day or the day previous (whichever is higher).
The tolerance setting mainly effects the plot point of order price, at a certain point key-trend rules will take priority over order price (meaning if tolerance is high enough, order price will have no effect on determining key-trends).
HammersPlots an arrow above a hammer candle or candle with big lower wick. Yellow signifies a candle with higher than average volume. Blue is a lower than average volume candle. Hammers/Lower Wick candles are best after a drop in price or near bottoms.

Weekly Options Expiry CandleThis script shows weekly expiry candle on daily chart. In weekly expiry, week starts on Friday and end on next Thursday.
How the candle is constructed:
Open= Open price of Friday, if Friday is a holiday, next available open price
High= Highest high price of Friday, Monday, Tuesday, Wednesday, Thursday
Low= Lowest low price of Friday, Monday, Tuesday, Wednesday, Thursday
Close=Close price of Thursday, if Thursday is a holiday, previously available close price
I am very new to Pine script, so waiting for your comments and review.

Bull and Bear Marubozus Candlestick PatternMarubozus are an interesting candle pattern wherein the close and open of the candle are also the high / low points of the candle. In other words, a candle with no shadows or wicks.
How reliable are they, though? Probably not very reliable on their own. It may also depend on the size of the candle. You would probably want to incorporate this candle pattern with other filters, like RSI, MACD, to filter trade opportunities.

No gaps candlesThis indicator repaints the candles so that every candle's open price is the previous candle's close price. This helps visualize stocks and ETFs that have big gaps, usually between trading days.
You should hide visibility of the ticker for this to be displayed properly.

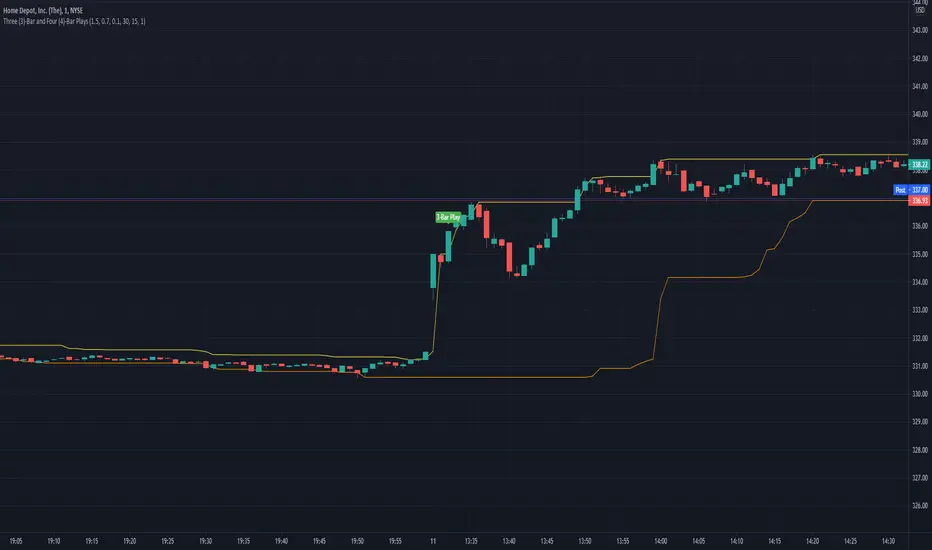
Three (3)-Bar and Four (4)-Bar PlaysThis indicator shows the three and four-bar play which is when price action has a wide igniting bar that has a full body, then one or two narrow bars which have a relatively equal high for long plays and relatively equal low for short plays, then a continuation bar. You should not take plays that will encounter resistance.
Jared Wesley is one of the more notable traders that use this setup. There will be a label placed on the chart when a play occurs. You can edit as an input the igniting bar size, the body percentage of the igniting bar, and the relative equality of the 2nd (and 3rd bar for 4 bar play) compared to the igniting bar.
ATH FinderFind the all time high (ATH) and plot a horizontal line extended from the ATH out to the right. Script also produces a label near the current candle indicating location and value of the ATH. If the ATH is higher than the current candle's high the label will be red and pointing up to indicate the ATH is above the current candle. If that current candle's high is the ATH, the label is green and pointing at the current candle's high.

Sweep TrackerThe script marks the bullish and bearish sweeps. You can change the number of lines drawn by modifying the value of max_lines_count in the first line of the code. Limiting feature will be available from menu in the next update.

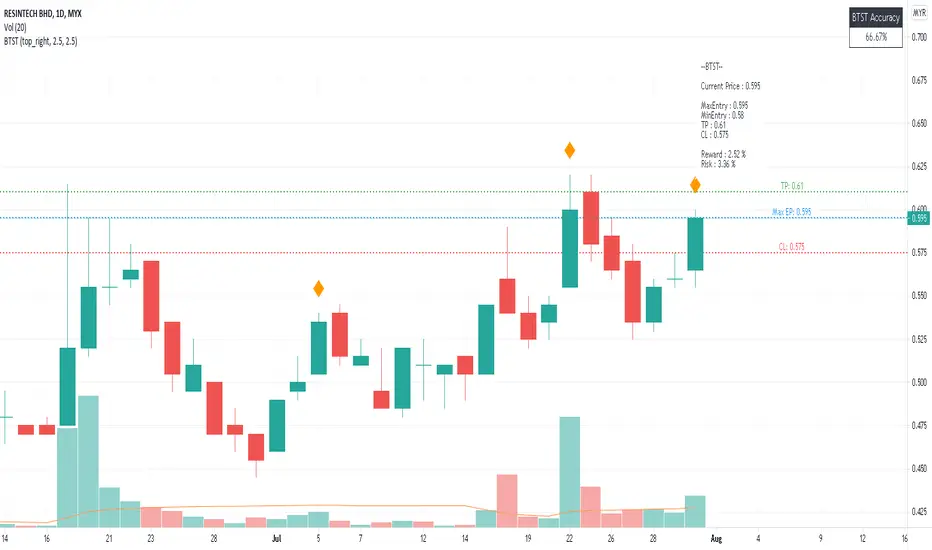
BTST Risk & Reward- BTST stands for Buy Today Sell Tomorrow which is trading is done on high momentum stock and selling is done on next day.
- Max Entry is one bid below intraday highest price
- TP is 2.5% above Max Entry and CL is one bid below 2.5% from Max Entry
Candle CurtainWHAT
This indicator hides the colour of the currently printing candle to avoid poor decisions being made.
WHY
Many trading strategies rely upon assessing the state of closed candles. Making trading decisions based on the currently printing candle's state can lead to poor trading outcomes (emotional decisions, FOMO, lack of restraint, etc) as it can be bullish one moment and bearish the next. This indicator acts to remind the trader to disregard the currently printing candle and wait for it to close.
IMPORTANT: Please click the three dots beside the indicator's name and select 'Visual Order' -> 'Bring to Front'

Weth to USDTplot candles for WETH charts in USDT
uses BINANCE:ETHUSDT by default for ETH prices, but can be edited under Settings > Inputs > eth

Unfilled Gap DetectorThis indicator displays gaps on a chart within a specified range which have not been filled. It offers the ability to set the minimum gap size to detect as a multiple of the average true range (ATR), as well as the allowed distance from a gap fill for the gap to be considered filled. The use of ATR allows the gap threshold to dynamically change as the stock price and volatility change over time. Lastly, it offers the ability to show gaps which have been filled in addition to unfilled gaps.
The following describes each input's effect on the indicator.
Bars to Search Back: specifies how many bars back in the chart to search for gaps and gap fills (maximum 5000).
ATR Length: specifies the length of the ATR() function used for thresholding
Minimum ATR Multiple For Gap Detection: The minimum gap size as a multiple of the ATR
Minimum ATR Multiple For Gap Fill: The minimum distance between a bar high/low and a gap for it to be considered "filled" as a multiple of ATR

DAYOFWEEK performance1 -Objective
"What is the ''best'' day to trade .. Monday, Tuesday...."
This script aims to determine if there are different results depending on the day of the week.
The way it works is by dividing data by day of the week (Monday, Tuesday, Wednesday ... ) and perform calculations for each day of the week.
1 - Objective
2 - Features
3 - How to use (Examples)
4 - Inputs
5 - Limitations
6 - Notes
7 - Final Tooughs
2 - Features
AVG OPEN-CLOSE
Calculate de Percentage change from day open to close
Green % (O-C)
Percentage of days green (open to close)
Average Change
Absolute day change (O-C)
AVG PrevD. Close-Close
Percentage change from the previous day close to the day of the week close
(Example: Monday (C-C) = Friday Close to Monday close
Tuesday (C-C) = Monday C. to Tuesday C.
Green % (C1-C)
Percentage of days green (open to close)
AVG Volume
Day of the week Average Volume
Notes:
*Mon(Nº) - Nº = Number days is currently calculated
Example: Monday (12) calculation based on the last 12 Mondays. Note: Discrepancies in numbers example Monday (12) - Friday (11) depend on the initial/end date or the market was closed (Holidays).
3 - How to use (Examples)
For the following example, NASDAQ:AAPL from 1 Jan 21 to 1 Jul 21 the results are following.
The highest probability of a Close being higher than the Open is Monday with 52.17 % and the Lowest Tuesday with 38.46 %. Meaning that there's a higher chance (for NASDAQ:AAPL ) of closing at a higher value on Monday while the highest chance of closing is lower is Tuesday. With an average gain on Tuesday of 0.21%
Long - The best day to buy (long) at open (on average) is Monday with a 52.2% probability of closing higher
Short - The best day to sell (short) at open (on average) is Tuesday with a 38.5% probability of closing higher (better chance of closing lower)
Since the values change from ticker to ticker, there is a substantial change in the percentages and days of the week. For example let's compare the previous example ( NASDAQ:AAPL ) to NYSE:GM (same settings)
For the same period, there is a substantial difference where there is a 62.5% probability Friday to close higher than the open, while Tuesday there is only a 28% probability.
With an average gain of 0.59% on Friday and an average loss of -0.34%
Also, the size of the table (number of days ) depends if the ticker is traded or not on that day as an example COINBASE:BTCUSD
4 - Inputs
DATE RANGE
Initial Date - Date from which the script will start the calculation.
End Date - Date to which the script will calculate.
TABLE SETTINGS
Text Color - Color of the displayed text
Cell Color - Background color of table cells
Header Color - Color of the column and row names
Table Location - Change the position where the table is located.
Table Size - Changes text size and by consequence the size of the table
5 - LIMITATIONS
The code determines average values based on the stored data, therefore, the range (Initial data) is limited to the first bar time.
As a consequence the lower the timeframe the shorter the initial date can be and fewer weeks can be calculated. To warn about this limitation there's a warning text that appears in case the initial date exceeds the bar limit.
Example with initial date 1 Jan 2021 and end date 18 Jul 2021 in 5m and 10 m timeframe:
6 - Notes and Disclosers
The script can be moved around to a new pane if need. -> Object Tree > Right Click Script > Move To > New pane
The code has not been tested in higher subscriptions tiers that allow for more bars and as a consequence more data, but as far I can tell, it should work without problems and should be in fact better at lower timeframes since it allows more weeks.
The values displayed represent previous data and at no point is guaranteed future values
7 - Final Tooughs
This script was quite fun to work on since it analysis behavioral patterns (since from an abstract point a Tuesday is no different than a Thursday), but after analyzing multiple tickers there are some days that tend to close higher than the open.
PS: If you find any mistake ex: code/misspelling please comment.

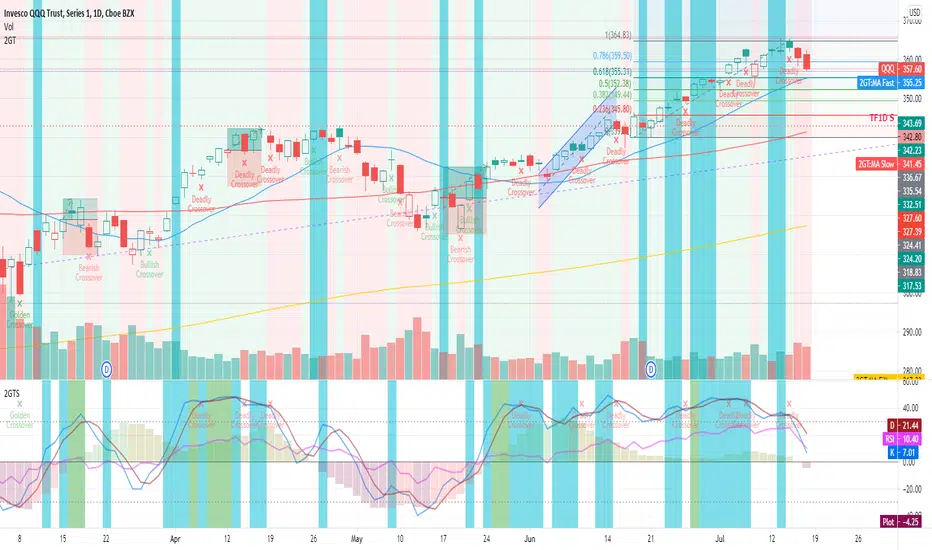
2nd Grade TechniqueThis is comprises of multiple popularly used indicators to help decide on whether to go long or short. This indicator will overlay the MA lines and background colours on your chart.
The heikin-ashi colour will be shown as the background colour. This will help you identify a trend more easily while using bars, candles, hollow candles, etc. When the background is green, it means that it is a green HA and vice versa.
The blue MA line is for showing the short-term trend. The red MA line is for showing the medium-term trend. You can select the moving average flavour of your choice in the settings.
The yellow MA line is the long-term trend that is mainly used as a filter to indicate bullish/bearish trend. The MA type for this filter can be different from the short/mid term MA.
This indicator will also show Stochastic crossovers (GC, DC, BC) on the chart. This will help to always keep your eye on the chart candles.
In the settings, you can also turn on/off bullish/bearish signals.
Rules for bullish signals on this indicator:-
1. MA: Blue > Red > Yellow (FastMA > SlowMA > FilterMA)
2. Stochastic: K > D and both are heading upwards
3. 2nd Green HA
When 2 out of the 3 rules are met, the candle background will be Aqua in colour. When all 3 rules are met, the candle background will be Green .
Rules for bearish signals on this indicator:-
1. MA: Yellow > Red > Blue (FilterMA > SlowMA > FastMA)
2. Stochastic: D > K and both are heading downwards
3. 2nd Red HA
When 2 out of the 3 rules are met, the candle background will be Orange in colour. When all 3 rules are met, the candle background will be Red .
Do note that you can show/hide any of these elements via the settings.
If you find this useful, do smash the LIKE and FOLLOW button.
WSLM
Narrow Range (NR) IndicatorNarrow Range (NR) trading strategy is a breakout-based method that assumes that the price of security trends up or down after a brief consolidation in a narrow range. This indicator can plot:
1. Narrow Range (NR) 4, 7, and 21
2. Narrow Range (NR) 4, 7, and 21 + Inside Bars (IB)
NR 4/NR 7/NR 21 day acts as a confirming factor on where the price will move further. Breakout of NR 4/NR 7/NR 21 candle with high volumes indicates bullishness, while the breakdown candle indicates bearishness.

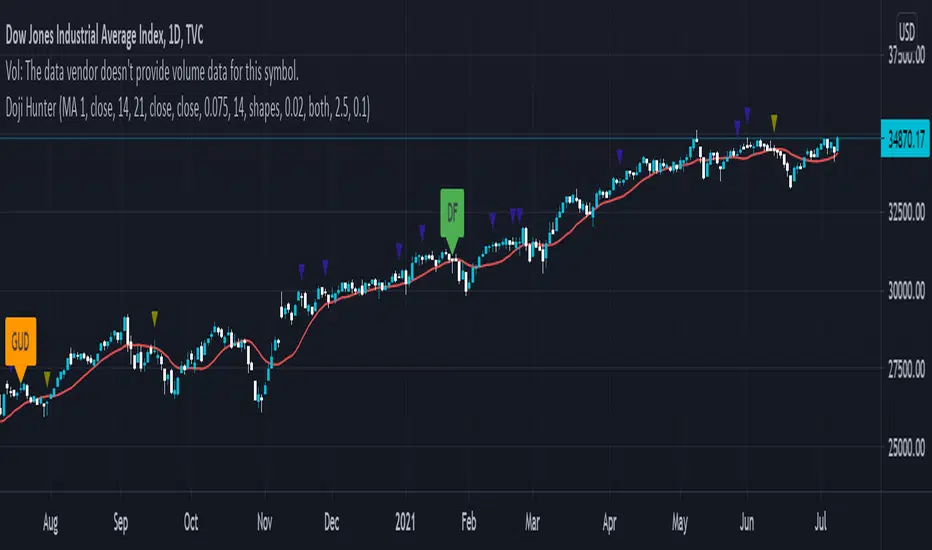
Doji Hunter█ OVERVIEW
This script is built to search for 8 different Doji candlestick patterns in markets and makes them appear on screen with bar coloring and creating color-coded labels/shapes. It will identify the following variants based upon user input for various rules to abide by:
Gapping Up
Gapping Down
Gravestone
Dragonfly
Long-Legged
Rickshaw Man
Northern (Doji in uptrend)
Southern (Doji in downtrend)
Note: for the remainder of this description, the types for inputs will be marked by italic text.
█ OPTIONS
This script features a wide range of options available to the user to modify how it functions. The first set of inputs dictate how the trend analysis is done with moving averages. The second and third sets of inputs dictate specific rules for how Doji candles are analyzed and the colors used for when they appear.
█ INPUTS (short)
1 — Moving Average Rules:
The Northern and Southern Doji variants require some trend analysis which will be done by Moving Averages. The inputs in this section change various things about the moving average(s) to be used. In the second section of inputs, there is one boolean option that will nullify the need for trend detection and consolidates the Northern and Southern Doji variants into one.
2/3 — Doji Rules and Colors:
The next two sections of inputs correspond to the various rules that dictate how various doji variants will be analyzed, as well as the colors that correspond to each variant. The colors will also apply to each of the labels/shapes used.
4 — Diagnostics:
The last boolean will allow the user to see extra detail with regards to how and when dojis are detected. Note: This is not a part of any prior section and is simply included as a last functional item to the list of all inputs.
An example of multiple labels being shown on screen for various types of Dojis (DJI 1D chart):
█ INPUTS (extended)
1 — Moving Average Rules:
This section consists of 10 different inputs specific to the rules on how the moving average functions for trend analysis.
"Trend Rule" ( string list) determines which Moving Average will be used for trend detection. It has 3 options: "MA 1", "MA 2", or "BOTH". The second input "Trend Source" determines which OHLC (or combination) value to use in comparison to either MA 1 or MA 2 (EX: Trend Rule -> "MA 1" and Trend Source -> "close": if close > MA 1 -> uptrend, downtrend otherwise). If "BOTH" is selected then "Trend Source" is ignored and added nuance in the script ensures that the shorter MA being above the longer MA yields an uptrend (downtrend otherwise).
The next 8 inputs focus on 4 different parts of both MA 1 and 2.
Length ( integer(s) )
Color
Switch between SMA/EMA ( boolean(s) )
Source for MA
Note: Additional attention to detail has been made here as trend direction is ignored if "BOTH" is selected for the MA Rules and the lengths of both Moving Averages are set to be the same.
2/3 — Doji Rules and Colors:
The next two sections include 19 inputs that are related to how this script will analyze and identify the different variants of Doji candles.
"Identify Pattern On Close" ( boolean ) modifies which candles are to be used for determining when Doji candles are recognized. This changes an offset used for historical reference on some global variables which will force the script to only identify patterns after the current candle has closed.
"Doji Body Tolerance" ( float ) tells the script the maximum % the candle body may be of the high-low range to be considered a Doji candle.
"Doji Wick Sample" ( integer ) defines how many prior candles to sample from in calculating the current average upper and lower wick sizes.
"Simplify Northern/Southern Dojis" ( boolean ) makes this script ignore trend direction for Doji detection and consolidates Northern and Southern Dojis into being recognized as the same. This has an added effect of removing the plotted moving averages from the screen.
"Northern/Southern Display" ( string list ) that has multiple options for how Northern and Southern Dojis will be displayed on screen. Because of how labels may be extremely taxing on TradingView's servers to display, the default setting is "shapes" where Northern and Southern (N/S) Dojis will be marked with a colored triangle at the top of the candle. If "Simplify Northern/Southern Dojis" is true, all N/S Dojis will be marked with an x-cross instead. Other options include "labels" which enables the use of labels accompanied by their respective tooltip and color, or "none" where N/S Dojis will be only noticeable by their changed barcolor.
"Allow Gravestone/Dragonfly Shadows" ( boolean ) allows a bit of additional nuance to the definition of Gravestone or Dragonfly Dojis with small shadows.
"Gravestone/Dragonfly Shadow Tolerance" ( float ) defines the maximum % that the lower wick/upper wick (respectively) may be relative to the high-low range for Gravestone or Dragonfly Dojis to still be considered valid.
"Doji Long Wick Setting" ( string list) is a list of settings for three different ways of confirming if a Doji is Long-Legged. The settings are "one", "two", and "average". These define how many wick lengths of a candle need to exceed the calculated average wick lengths (EX: "both" -> upper wick length > upper wick average and lower wick length > lower wick average). The "average" setting will combine the lengths of both wicks and both prior wick averages, divide both of these sums by 2 and compare them instead.
"Doji Long Wick Tolerance" ( float ) defines how large compared to the averages that wick lengths need to be in order for them to be considered "Long-Legged" (EX: 1.50 -> upper/lower wick needs to exceed 150% the average of previous upper/lower wicks).
"Rickshaw Man Body Placement Tolerance" ( float ) defines how close to the high-low range's midpoint the candle body's midpoint needs to be in order for it to be considered a Rickshaw Man Doji candle instead.
The remaining 9 inputs define the colors to use for differentiating between all Doji variants this script will recognize.
█ USAGE
My hope for this script is that users find this easy to use/understand and will tinker with the input values to better identify Doji candlesticks across a wide range of markets.
Suggestions for changes in the future are welcome.