Commencez
Communauté Scripts

CBOE

Idée de trading 3
Scripts 11

Indicateurs, stratégies et bibliothèques

Tous types
Tous types
Indicateurs
Stratégies
Bibliothèques
Open Source Uniquement
ILM CFTC COT Disaggregated Plot
ZC1!: ILM CFTC COT Disaggregated Plot
ILuvMarkets ILuvMarkets P Mis à jour 

Use this indicator on Daily Timeframe Please refer to the below link for CFTC Disaggregated COT www.cftc.gov This script is very similar to COT Financial Plot indicator except that it plots the data for Disaggregated Futures

32
0
vol_box
CL1!: vol_box
voided voided P Mis à jour 

A simple script to draw a realized volatility forecast, in the form of a box. The script calculates realized volatility using the EWMA method, using a number of periods of your choosing. Using the "periods per year", you can adjust the script to work on any time frame. For example, if you are using an hourly chart with bitcoin, there are 24 periods * 365 = 8760...

36
8
rv_iv_vrp
EWZ: rv_iv_vrp
voided voided P

This script provides realized volatility (rv), implied volatility (iv), and volatility risk premium (vrp) information for each of CBOE's volatility indices. The individual outputs are: - Blue/red line: the realized volatility. This is an annualized, 20-period moving average estimate of realized volatility--in other words, the variability in the instrument's...

154
2
Daily Crypto Strategy
BTCUSDT: Daily Crypto Strategy
SoftKill21 SoftKill21 P

This is a long only strategy. This strategy measures and creates a signal when an asset is moving out of a correlation with CBOE VIX into an inverse correlation. It also has a risk management with TP/SL based on percentages. If you have any questions let me know.

123
2
Velocity To Inverse Correlation to VIX/Bonds Strategy (2020)
ETHUSD: Velocity To Inverse Correlation to VIX/Bonds Strategy (2020)
givingdesk givingdesk

This strategy measures and creates a signal when an asset is moving out of a correlation with high yield bonds or the CBOE VIX into an inverse correlation, as well as when an asset is losing correlation with a top corporate bonds ETF. When this signal is triggered, the simulation has the portfolio asset go long. Additionally, exits are based on a 2% stop loss...

104
1
Call / All Ratio ( C / A ) - Noldo
CBOE: Call / All Ratio ( C / A ) - Noldo
Noldo Noldo Mis à jour 

First of all this script inspired by MagicEins' Put/Call-Ratio-Buschi script . What is the Put-Call Ratio The put-call ratio is an indicator ratio that provides information about relative trading volumes of an underlying security's put options to its call options. The put-call ratio has long been viewed as an indicator of investor sentiment in the markets, where...

308
2
CBOE PCR Factor Dependent Variable Odd Generator
CBOE: CBOE PCR Factor Dependent Variable Odd Generator
Noldo Noldo

This script is the my Dependent Variable Odd Generator script : with the Put / Call Ratio ( PCR ) appended, only for CBOE and the instruments connected to it. For CBOE this script is more accurate and faster than Dependent Variable Odd Generator. And the stagnant market odds are better and more realistic. Do not use for timeframe periods less than 1 day. Because...

730
25
Put/Call-Ratio-Buschi
SPX: Put/Call-Ratio-Buschi
MagicEins MagicEins P Mis à jour 

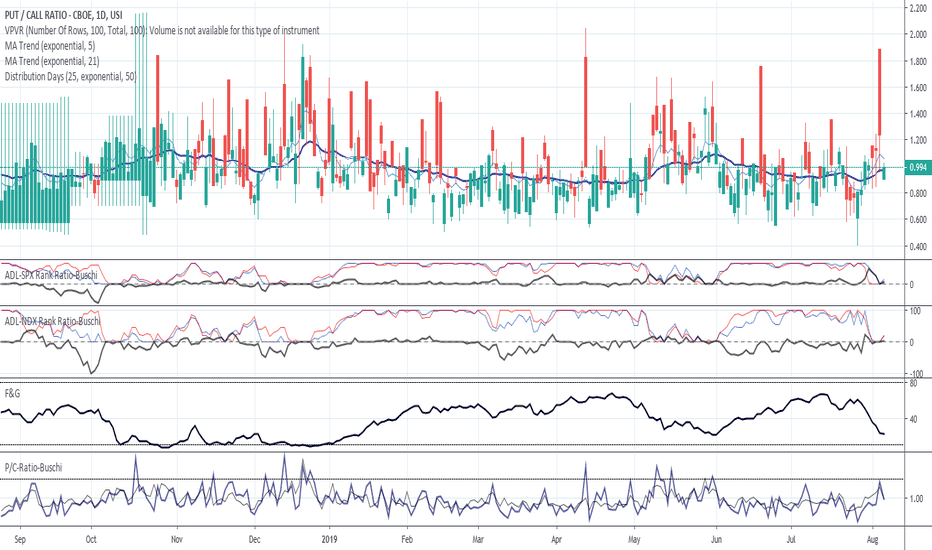
English: This script shows the Put/Call-Ratio as seen on the Cboe-Website: www.cboe.com A higher Put/Call-Ratio means a higher trading volume of puts compared to calls, which is a sign of a higher need for protection in the market. For best reflection of the Cboe's data, which is shown in 30 minutes intervals, a 30 min-chart is recommended. 30 min-data as...

2012
11
CBOE/CME BTC FUTURE LIST
BTCUSD: CBOE/CME BTC FUTURE LIST
madoqa madoqa P

how to pull data from quandl.com this script for CBOE/CME BTC FUTURE ex. if you want to pull www.quandl.com you input "QUANDL:CFTC/1330E1_FO_ALL|n" as TV symbol.("n" is table number)

101
2
IV/HV ratio 1.0 [dime]
SPX:  IV/HV ratio 1.0 [dime]
dime dime

This script compares the implied volatility to the historic volatility as a ratio. The plot indicates how high the current implied volatility for the next 30 days is relative to the actual volatility realized over the set period. This is most useful for options traders as it may show when the premiums paid on options are over valued relative to the historic...

437
2
BTC Futures Settlement Dates by scarf - update date by Mualchon
BTCUSD: BTC Futures Settlement Dates by scarf - update date by Mualchon
Real_inwCoin Real_inwCoin P Mis à jour 

just update the settlement date.

87
8
#TradingView C'est que de l'amour
M+50

Traders et investisseurs qui visitent notre site chaque mois.

#1

Le meilleur site web au monde pour tout ce qui concerne les investissements

4.9

Selon 1M+ de commentaires. Aucune autre application de finance n'est plus appréciée

M+10

Scripts personnalisés et idées partagés par nos utilisateurs

TradingView Chart sur @life_of_lorena.fx Instagram

@life_of_lorena.fx

TradingView Chart sur @Facu Mendizabal Instagram

@Facu Mendizabal

TradingView Chart sur @Kameleon Instagram

@Kameleon

TradingView Chart sur @tradingsignalio Instagram

@tradingsignalio

TradingView Chart sur @TradingView Instagram

@TradingView

TradingView Chart sur @nasdaq.forex Instagram

@nasdaq.forex

TradingView Chart sur @tradeindicators Instagram

@tradeindicators

TradingView Chart sur @richardwilliam251 Instagram

@richardwilliam251

TradingView Chart sur @carlosvalenciafx Instagram

@carlosvalenciafx

TradingView Chart sur @azp.fx Instagram

@azp.fx

TradingView Chart sur @malikriv Instagram

@malikriv

TradingView Chart sur @mytradingsetup Instagram

@mytradingsetup

TradingView Chart sur @matttomillion Instagram

@matttomillion

TradingView Chart sur @bella_tradesurfer Instagram

@bella_tradesurfer

TradingView Chart sur @sophie.burrell__ Instagram

@sophie.burrell__

TradingView Chart sur @Cenobar Instagram

@Cenobar

TradingView Chart sur @sopht_fx Instagram

@sopht_fx

TradingView Chart sur @elnaaz_sadeghi01 Instagram

@elnaaz_sadeghi01

Alex Honnold on the rock

Quel que soit le trade

Voyez pourquoiVoyez pourquoi
Produits
  • Graphique
  • Langage Pine Script™
  • Screener d'actions
  • Screener Forex
  • Screener de paires Crypto
  • Screener Crypto Coins
  • Carte thermique des marchés boursiers
  • Crypto Heatmap
  • Calendrier économique
  • Calendrier des bénéfices
  • Sparks
  • Flux de nouvelles
  • TradingView Desktop
  • Application mobile
  • Contrats à terme de CME Group
Société
  • A propos
  • Caractéristiques
  • Prix
  • Mur d'Amour
  • Athlètes
  • Manifeste
  • Carrières
  • Blog
  • Failles dans la sécurité
  • Page du statut
  • Conditions d'utilisation
  • Clause de non-responsabilité
  • Politique de confidentialité
  • Politique en matière de cookies
Communauté
  • Parrainer un ami
  • Idées
  • Scripts
  • Streams
  • Règles de Conduite
  • Modérateurs
  • Les Magiciens de Pine Script™
  • Chat
Pour Business
  • Widgets
  • Publicité
  • Solutions site web & courtier
  • Solutions pour la création de graphiques
  • Bibliothèque des Lightweight Charts™
  • Intégration de courtage
  • Programme de partenariat
Téléchargez sur l'App Store Téléchargez sur l'App Store Obtenir sur Google Play Obtenir sur Google Play
Télécharger l'application Desktop Télécharger l'application Desktop Tradez sur TradingView Tradez sur TradingView
Choisissez les données du marché fournies par ICE Data Services © 2023 TradingView, Inc.