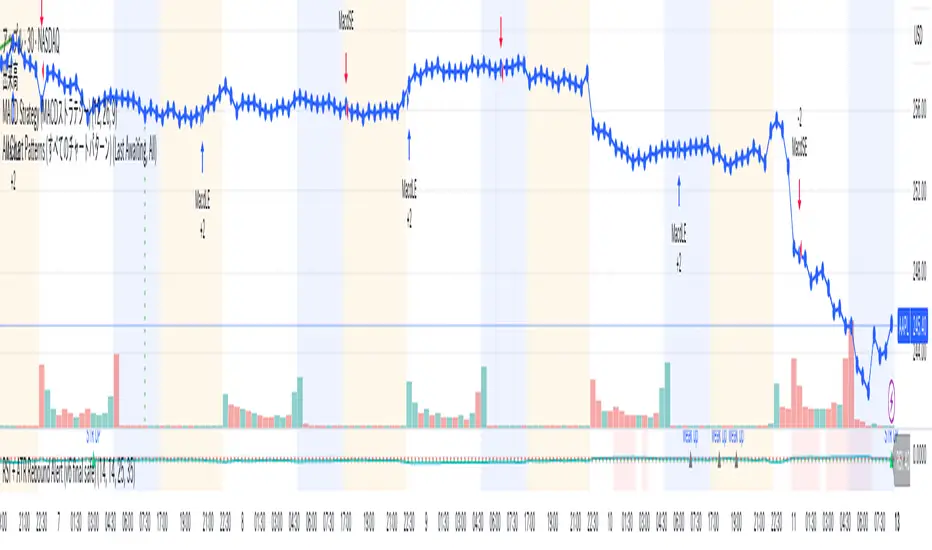
Inspired by Linda Bradford Raschke. Entry criteria: This strategy is used to capture momentum effects on the daily periodicities. Once prices have had a run of 8 or more consecutive closes above or below the 5-period simple moving average the strategy is primed to trade. It will then enter a short on the first close above the 5sma after a run of 8 or more...
ACBR, or, Average Candle Bodies Range is a volatility and momentum indicator designed to indicate periods of increasing volatility and/or momentum. The genesis of the idea formed from my pondering what a trend trader is really looking for in terms of a volatility indicator. Most indicators I've come across haven't, in my opinion, done a satisfactory job of...
Multiple Standard Momentum The momentum indicator is a technical indicator that measures the speed and strength of the price movement of a financial asset. This indicator is used to identify the underlying strength of a trend and predict potential changes in price direction. The calculation of the momentum indicator is based on the difference between the...
Strategy is based on "Divergence for Many Indicators v4 ST" strategy by CannyTolany01 which is based on "Divergence for Many Indicator" indicator by LonesomeTheBlue This strategy is searching for divergences on 18 indicators which you can select and optimise one by one. Additionally you can connect any other External Indicator value. (just add this indicator the...
Super 6x: RSI , MACD , Stoch , Loxxer, CCI , & Velocity is a combination of 6 indicators into one histogram. This includes the option to allow repainting. What is MACD? Moving average convergence divergence ( MACD ) is a trend-following momentum indicator that shows the relationship between two moving averages of a security’s price. The MACD is calculated by...
The Return Abnormality Score indicator is designed to help traders identify potential reversals in price by detecting abnormal daily returns beyond a certain significance level. The indicator uses a normal cumulative distribution function to calculate the probability of the daily return and flags it when it exceeds the specified significance level. Traders can...
The Detrending Filter was created by John Ehlers and this is a complementary indicator to one of my previous scripts: This indicator builds upon his previous work by attempting to detrend the underlying source data that is used to calculate the final result. He was able to create a leading indicator by removing the trend data and by using his previous...
Stochastic MACD - Slow and Fast The "Stochastic MACD - Slow and Fast" indicator combines two popular technical indicators, the Stochastic Oscillator and the Moving Average Convergence Divergence ( MACD ). The Stochastic Oscillator is a momentum indicator that measures the current closing position of an asset relative to its recent price range. This indicator...
what is Faytterro oscillator? An oscillator that perfectly identifies overbought and oversold zones. what it does? this places the price between 0 and 100 perfectly but with a little delay. To eliminate this delay, it predicts the price to come, and the indicator becomes clearer as the probability of its prediction increases. how it does it? This indicator is...
A simple indicator in a table format, is effective for determining when an individual stock or cryptocurrency is oversold or overbought. Using the indicator In the column "2σ" , up arrows indicate that the asset is very overbought , down arrows indicate that an asset is very oversold , and an equals sign indicates that the indicator is neutral. In the ...
Smart QQE - Chart Overlay Smart QQE shows QQE Trend and RSI plot on chart to determine the trend direction and eliminate false signals. QQE is obtained from original code by Glaz and rescaled to fit on chart. RSI 50 level acts as Zero which is plotted as a Bollinger on chart. This is not a Bollinger band . its an RSI channel with levels 0-100 plotted around the...
The Reflex Indicator was created by John Ehlers (Stocks and Commodities Feb 2020) and this is a zero lag indicator that works similar to an overbought/oversold indicator but with the current stock cycle data. I find that this indicator works well as a leading indicator as well as a divergence indicator. Generally speaking, this indicator indicates a medium to long...
The Data Sampling Indicator was created by John Ehlers (Stocks and Commodities Mar 2023) and this is a genius method to reduce noise in the market data but also doesn't introduce any lag while doing so. The way this works is because traditionally, people have always relied on the close price as the default input for many indicators such as the RSI or MACD as...
This script quantifies the energy in a price move by comparing the relationship of 3 configurable exponential moving averages present on a slightly higher timeframe (chosen automatically based on the charts current period). It uses the closing price by default, but this is also configurable using the Source input. There are a few ways to use the information in...
This oscillator comprehends two different indicators: - The first one is a MACD but calculated using the Hull Moving Average. - The second one is to show the direction in which the Hull Moving Average is going. Notice that in the first indicator, the histogram is colored as follows: - If the volume pressure (difference between the volume-weighted moving average...
Bars with positive MACD histogram value and closing above VWAP are colored, long positions should be taken in areas made of those bars. Similarly, bars with negative MACD histogram value and closing below VWAP are also colored, short positions should be taken there. This indicator by default should be a part of your trend following trading system. In the...
what is Limited Fisher Transform? This indicator is a compressed version of the Fisher transform indicator between 100 and 0 values. what it does? It allows us to define overbought and oversold zones by compressing the values of the "fisher transform" indicator between 0 and 100. also these zones are the same for every timeframe and trading pair, just like...
This indicator will show how fast the rsi of a symbol is changing. you can see this as a differentiation function on rsi . this will show the change in rsi in percentage. Ex: suppose the rsi of a symbol at present is 60 and the previous value of rsi was 52, as you can see the rsi has increased, which is a sign of the symbol being bullish . this indicator will...