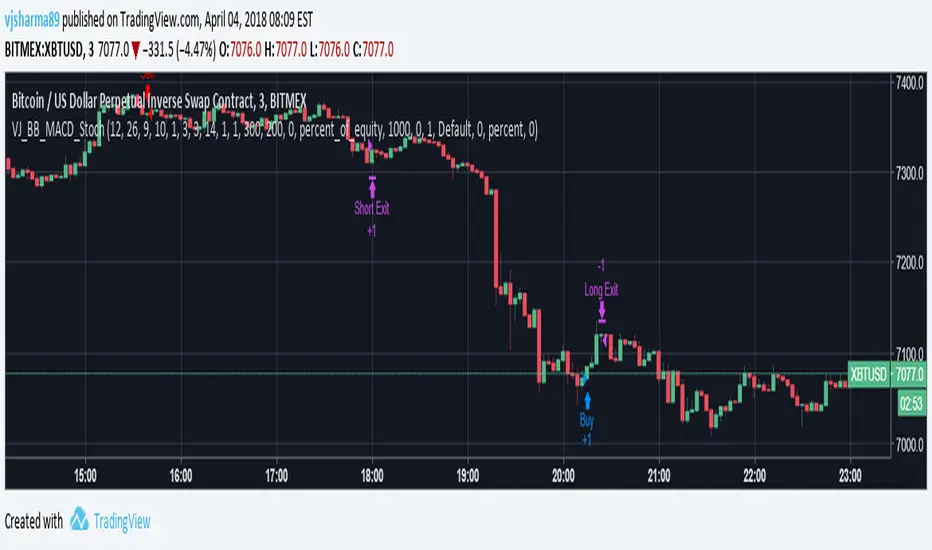
VJSHARMA_BB_MACD_Stoch_Short_Trade_StrategyThis strategy was developed keeping in mind the accuracy of signals. Due to which the time-frame had to be small as in longer timeframe, the probability of a particular movement decreases. The best application of this strategy is with Margin Trading as the signals achieved have really high accuracy.
To get the best out of this strategy, keep in mind the following
1. Choose 3 min time frame
2. Changing the stoploss and trailing stop settings could/would interfere with the accuracy of the trades.
3. Pyramiding affects the profitability of trades.
Oscillateurs centrés
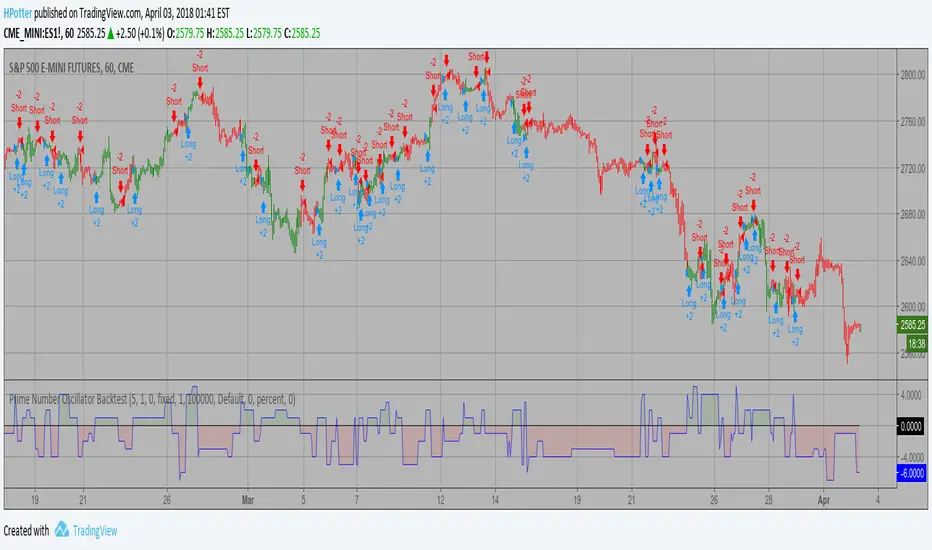
Prime Number Oscillator Backtest Determining market trends has become a science even though a high number or people
still believe it’s a gambling game. Mathematicians, technicians, brokers and investors
have worked together in developing quite several indicators to help them better understand
and forecast market movements.
Developed by Modulus Financial Engineering Inc., the prime number oscillator indicates the
nearest prime number, be it at the top or the bottom of the series, and outlines the
difference between that prime number and the respective series.
You can change long to short in the Input Settings
WARNING:
- For purpose educate only
- This script to change bars colors.
CryptoVN - Commodity Channel Index (CCI) - BacktestHere is a backtest the CryptoVN - Commodity Channel Index (CCI) has published :
With condition for Buy/Sell:
Buy signals: the CCI for movement above +100
Sell signals:the CCI for movements below -100
- The Trend Is Your Friend. TRADE WHAT YOU SEE, NOT WHAT YOU THINK.


Ichimoku + Daily-Candle_X + Gaussian Smooth + MacDI take no credit for this script. I swapped the Hull moving average used the original program made by SeaSide420 for a gaussian smooth function made by jjaskulowski. This script seems to consistently outperform the original strategy for the long condition. I'm mainly focused on crypto, so I removed the "short" option because most crypto exchanges don't have this function as of right now.

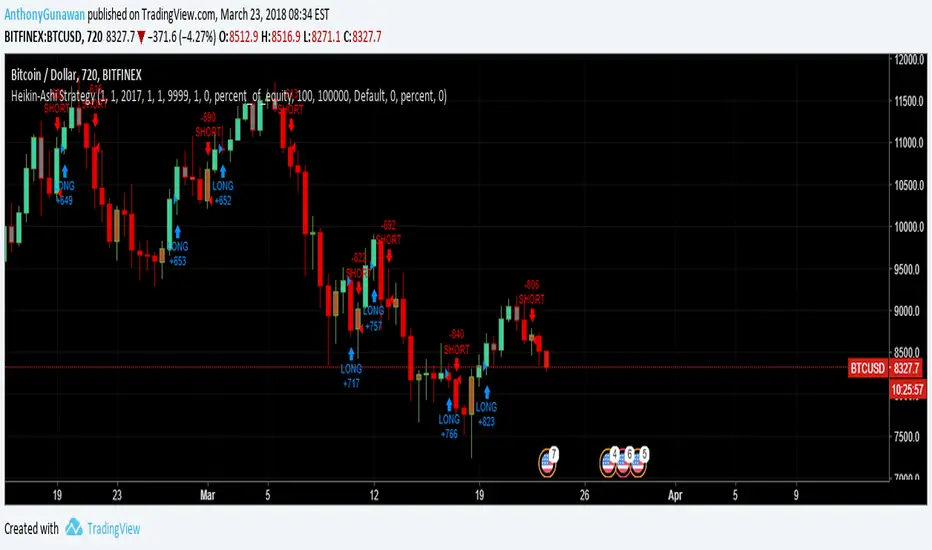
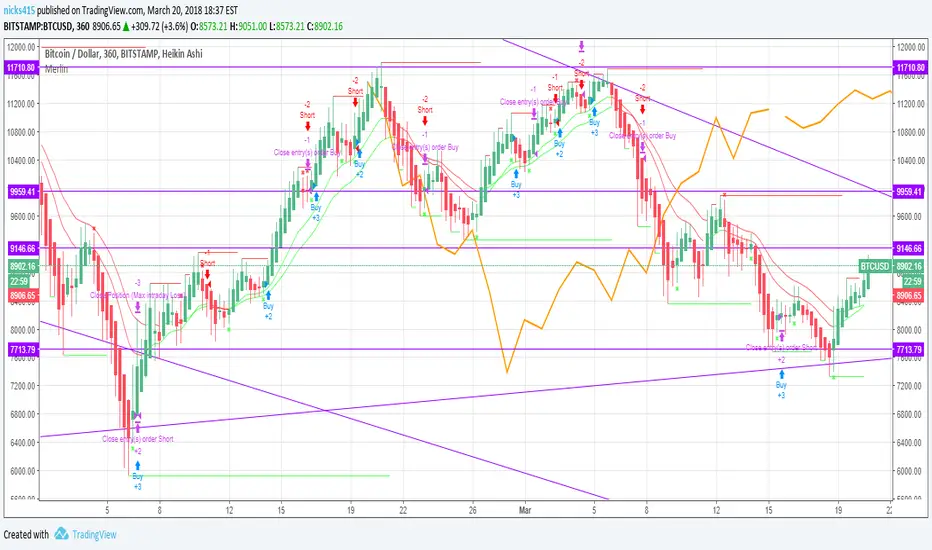
Heikin-Ashi Strategy + backtest rangeThis is Heikin-Ashi Strategy + Backtest range that I think useful for BTCUSD pair.
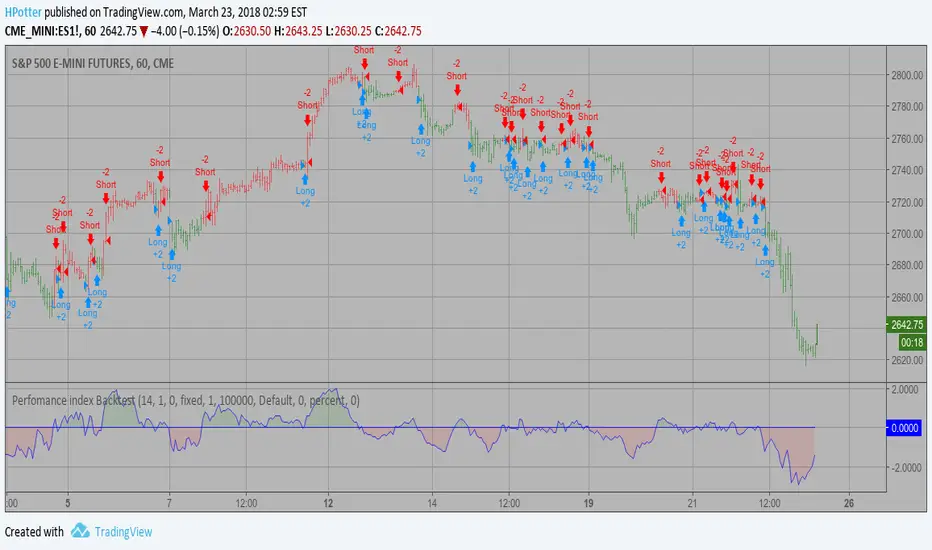
Perfomance index Backtest The Performance indicator or a more familiar term, KPI (key performance indicator),
is an industry term that measures the performance. Generally used by organizations,
they determine whether the company is successful or not, and the degree of success.
It is used on a business’ different levels, to quantify the progress or regress of a
department, of an employee or even of a certain program or activity. For a manager
it’s extremely important to determine which KPIs are relevant for his activity, and
what is important almost always depends on which department he wants to measure the
performance for. So the indicators set for the financial team will be different than
the ones for the marketing department and so on.
Similar to the KPIs companies use to measure their performance on a monthly, quarterly
and yearly basis, the stock market makes use of a performance indicator as well, although
on the market, the performance index is calculated on a daily basis. The stock market
performance indicates the direction of the stock market as a whole, or of a specific stock
and gives traders an overall impression over the future security prices, helping them decide
the best move. A change in the indicator gives information about future trends a stock could
adopt, information about a sector or even on the whole economy. The financial sector is the
most relevant department of the economy and the indicators provide information on its overall
health, so when a stock price moves upwards, the indicators are a signal of good news. On the
other hand, if the price of a particular stock decreases, that is because bad news about its
performance are out and they generate negative signals to the market, causing the price to go
downwards. One could state that the movement of the security prices and consequently, the movement
of the indicators are an overall evaluation of a country’s economic trend.
You can change long to short in the Input Settings
WARNING:
- For purpose educate only
- This script to change bars colors.

[NG] Strategy: CryptoMine - v1 - Low Drawdown - Beats Buy&Hold!So, I created this strategy that works on BTCUSD 0.28% pair along with almost all ALT-BTC pairs, and ALT-USD pairs (i.e. the cryptosphere). Here are some of the considerations I had when creating this script:
- Should work on BTCUSD 0.28% , along with most ALT-BTC and ALT-USD pairs without modifying strategy parameters for individual pairs.
- Should work with several timeframes, esp -0.67% . 15m-4hr timeframes. Better if the parameters are adjusted for these timeframes, automatically.
- Should have a small MaxDrawdown. Arguably <50% for cryptos.
- Should beat buy and hold profits for the pair.
- Should have multiple modes for switching between: Higher Returns vs Lower Drawdowns, multiple Long/Short versions - one which allows me to do margin trading by using the short calls (so, LONG, SHORT and FLAT), and another one where I can use the short calls by exiting out of the market and entering when the short call ends (so, LONG and SHORT only).
- Should have proper risk management built-in. Moreover, TakeProfit and StopLoss will be defined at a fixed 20% each, which is reasonable for crypto markets. Most strategies I see on tradingview fail on this count.
After several weeks of building such a script, and testing it successfully on multiple pairs - here are the results. :)
ETHBTC
=======================================================================================
Mode 1 (LONG and SHORT only)
--------------------------------------
First Trade: 2015-08-10 09:30, Final Profit: 1474649.65%, Drawdown: 66.21%, PF: 2.149, Trades: 1059
--------------------------------------
Mode 2 (LONG, SHORT and FLAT positions)
First Trade: 2015-08-14 05:30, Final Profit: 715274.55%, Drawdown: 36.34%, PF: 2.806, Trades: 589
BTCUSD 0.28%
=======================================================================================
Mode 1 (LONG and SHORT only)
--------------------------------------
First Trade: 2015-01-03 21:30, Final Profit: 28944.04%, Drawdown: 44.87%, PF: 1.353, Trades: 1222
--------------------------------------
Mode 2 (LONG, SHORT and FLAT positions)
First Trade: 2015-01-11 13:30, Final Profit: 22522.28%, Drawdown: 27.77%, PF: 1.877, Trades: 669
NANOBNB
=======================================================================================
Mode 1 (LONG and SHORT only)
--------------------------------------
First Trade: 2018-02-04 23:30, Final Profit: 365.5%, Drawdown: 39.4%, PF: 1.967, Trades: 51
--------------------------------------
Mode 2 (LONG, SHORT and FLAT positions)
First Trade: 2015-01-11 13:30, Final Profit: 236.91%, Drawdown: 25.62%, PF: 3.692, Trades: 25
NOTE: I will not be sharing access to this script, since market saturation is a real thing. Send me an email at menikhguptacom - if you are really interested in this script.

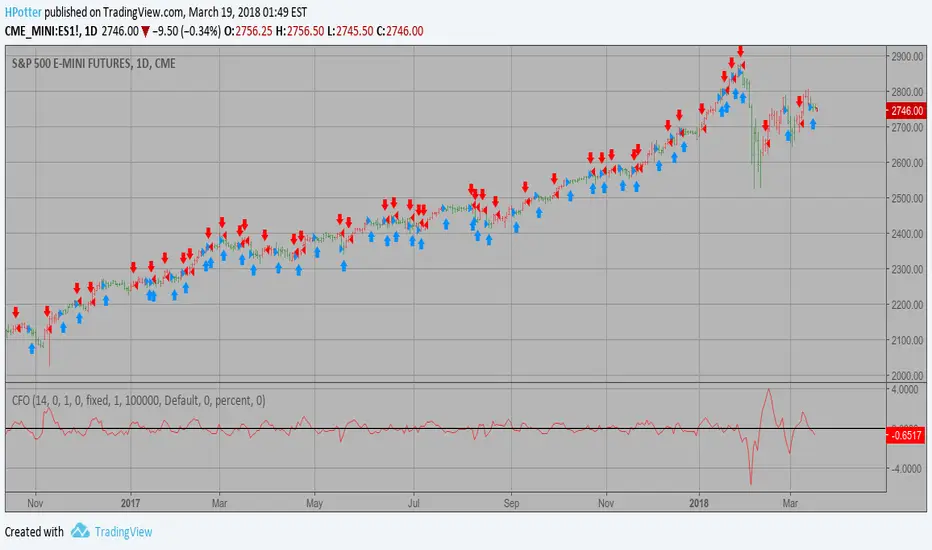
Chande Forecast Oscillator Backtest The Chande Forecast Oscillator developed by Tushar Chande The Forecast
Oscillator plots the percentage difference between the closing price and
the n-period linear regression forecasted price. The oscillator is above
zero when the forecast price is greater than the closing price and less
than zero if it is below.
You can change long to short in the Input Settings
WARNING:
- For purpose educate only
- This script to change bars colors.


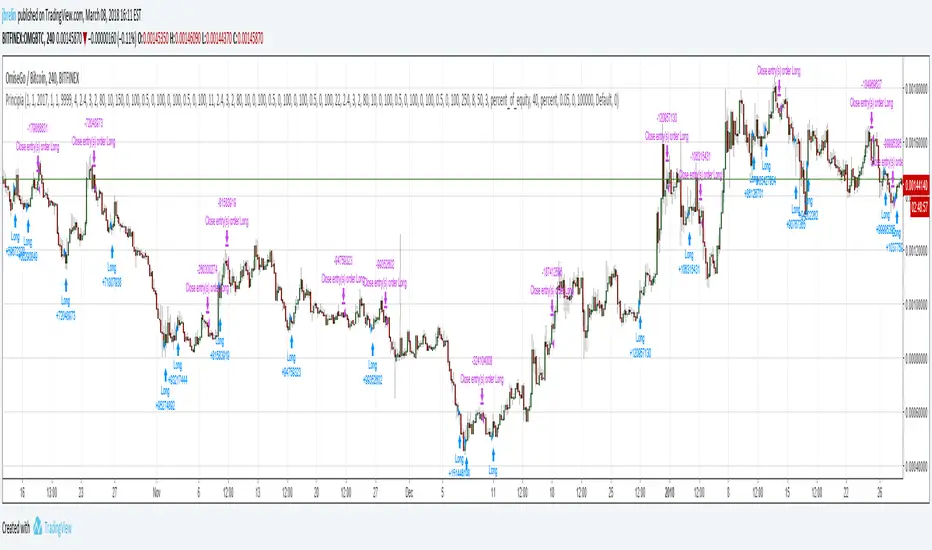
Principia StrategyThis is the Principia Script that uses principles from Isaac Newton's Principia Mathematica.
Slickwater Strategy [frac]This indicator is the culmination of various other indicators and attempts to help traders assess the actual current trend and filter out all the noise.
In reality, this indicator is extremely similar to the Traders Dynamic Index in concept and the overall results of the indicator across any time frame. The differences though are that while TDI uses just RSI, this uses RSI, CCI, MFI, and TSI, and also includes an assessment of the momentum associated with the move, to better enable traders to detect divergence.
The default settings generate the best returns across any time frame, however can be ultra sensitive and generate too many trade signals on high resolution time frames (i.e., the 15M or 30M). If one desires less sensitive results, one can use (14,12,9) for the first 3 inputs. This generates consistent signals, but is not as sensitive as the default.
In general:
GO LONG:
- Scalp: Wt1 crosses over Wt2
- Short Term: Wt1 crosses over Wt2 and the middle band. Wt2 is above the middle band as well
- Medium Term: Same as short term, but there are extended oversold trading signals (yellow dots)
- Long term: Same as medium term, but there is divergence in the momentum as well (i.e. it is increasing while price decreases)
GO SHORT:
- Scalp: Wt1 crosses under Wt2
- Short Term: Wt1 crosses under Wt2 and the middle band. Wt2 is below the middle band as well.
- Medium Term: Same as short term, but there are extended overbought trading signals (yellow dots)
- Long term: Same as medium term, but there is divergence in the momentum as well (i.e., it is decreasing while price increases)

SB_CM_MacD_Ult_MTFThis strategy places the order based on the MACD signal.
Original Indicator: MacD Custom Indicator-Multiple Time Frame+All Available Options! by ChrisMoody
Link to the Indicator:
If your risk appetite is high you can replace the first statement with the below statement:
strategy(title="SB_CM_MacD_Ult_MTF", shorttitle="SB_CM_MacD_Ult_MTF", default_qty_type = strategy.percent_of_equity, default_qty_value = 100, pyramiding = 5)
You can check for repainting. Did not check for that.
Message if you think of any modifications/ enhancements/ any opportunities. :)
Donations/Tips... :) -
BTC: 1BjswGcRR6c23pka7qh5t5k56j46cuyyy2
ETH: 0x64fed71c9d6c931639c7ba4671aeb6b05e6b3781
LTC: LKT2ykQ8QSzzfTDB6Tnsf12xwYPjgq95h4

Magical M's Mk2 with rudimentary strategyContinuation of the Magic M indicator with strategy ....bunch of changes for this update including bull/bear trap prevention. new strategy (needs alot of work) still better if you eyeball it (have not implemented bear markets correctly).
have also added dark mode friendliness !
More examples
even more
considerable amount of repainting prevention/checking

SB_Elder Impulse SystemThe strategy is based on LazyBear's Elder Impulse System
Strategy(in layman terms):
Long: When the green bar in the Elder Impulse System's indicator shows up
Short: When the red bar in the Elder Impulse System's indicator shows up
Close trade/Profit booking: When the blue bar in the Elder Impulse System's indicator shows up
Original Idea:
Message in the script if you think of any modifications/ enhancements.
Donations/Tips... :) -
BTC: 1BjswGcRR6c23pka7qh5t5k56j46cuyyy2
ETH: 0x64fed71c9d6c931639c7ba4671aeb6b05e6b3781
LTC: LKT2ykQ8QSzzfTDB6Tnsf12xwYPjgq95h4


SB_CCI coded OBV StrategyStrategy-
Buy Order: Previous obv value is green and obv_cci coded line crosses over ema line
Sell Order: Previous obv value is red and obv_cci coded line crosses under ema line.
Original Idea:
Preferable for day/week intervals.
For Tips to continue :) -
BTC: 1BjswGcRR6c23pka7qh5t5k56j46cuyyy2
ETH: 0x64fed71c9d6c931639c7ba4671aeb6b05e6b3781
LTC: LKT2ykQ8QSzzfTDB6Tnsf12xwYPjgq95h4

Fractal Chaos Oscillator Backtest The value of Fractal Chaos Oscillator is calculated as the difference between
the most subtle movements of the market. In general, its value moves between
-1.000 and 1.000. The higher the value of the Fractal Chaos Oscillator, the
more one can say that it follows a certain trend – an increase in prices trend,
or a decrease in prices trend.
Being an indicator expressed in a numeric value, traders say that this is an
indicator that puts a value on the trendiness of the markets. When the FCO reaches
a high value, they initiate the “buy” operation, contrarily when the FCO reaches a
low value, they signal the “sell” action. This is an excellent indicator to use in
intra-day trading.
You can change long to short in the Input Settings
WARNING:
- For purpose educate only
- This script to change bars colors.


Momentum Trader Strategy 3.0Momentum Trader 3.0 is a momentum trading strategy which uses volume to confirm market momentum driven moves.
By default it only trades between 0900 and 1530 (designed for futures trading and can be toggled to 24/7)
No repaint issues, what you see is real
Toggles allow you to enable Long or Short independently which may work better or worse for your market
Designed primarily for Day Trading (1-15m interval)
Presently only the Short side is optimized, the Long works but overtrades a bit. I will be adding an option to remove the less useful signals and improve performance.
Momentum Trader is a real and successful momentum strategy (which I use myself). It isn't a miracle 'always win' strategy but it is a steady workhorse. By combining high probability momentum trades and auto stop-losses, it takes a good slice of most rallies, a big slice of the grand drops, and avoids heavy sudden losses.
Momentum Trader can be used in any timeframe. Your success depends on the volatility of the individual market. I recommend trading at 10m and below for high volatility instruments like ES/SPX while low volatility instruments can be traded at the 1h and beyond. At the level of 1D+ it also works as well but naturally as a momentum strategy it may take a while to pivot.
Momentum Trader provides you with 3 long and 2 short entries which represent different levels of risk/reward. Like any real strategy, there can be periods of chop where the strategy will lose (small based on stop-loss) if the market is chopping very quickly back and forth or pivoting suddenly. As a rule, Momentum Trader attempts to avoid most of that by typically flagging trends which are established and confirmed. Different signals give you different degrees of confirmation and thus different risk/reward.
