Custom Choppiness HistogramThe Custom Choppiness Histogram is a visually enhanced, multi-timeframe version of the traditional Choppiness Index , designed to make it easier to spot when the market is trending vs. ranging.
🔹 Key Features:
Histogram Visualization: Clear, color-coded bars for instant interpretation.
Two Coloring Modes:
1.Change Mode → Colors based on increase/decrease vs. previous CI value.
2.Absolute Levels → Uses common CI thresholds (e.g., >61.8 = choppy, <38.2 = trending).
Grey Bars / Neutral Zone: Bars turn grey when the market is neither strongly trending nor strongly choppy — signaling a neutral or indecisive market.
Multi-Timeframe Option: Analyze Choppiness from any higher timeframe while trading on a lower chart.
Custom Thresholds: Adjust high/low CI levels to fit your strategy.
🔹 How to Use:
Green bars → Market is becoming more trending.
Red bars → Market is becoming more choppy/ranging.
Grey bars → Market is in a neutral zone; use caution and combine with other signals.
Use the timeframe input to filter trades (e.g., check if the 1H is trending before entering on the 5M).
🔹 Best Practice:
Use as a context filter alongside your entry/exit strategy (e.g., MACD, ICT/Smart Money, Supply & Demand).
Helps reduce false entries by avoiding trades during sideways conditions.
⚠️ Disclaimer:
This script is provided for educational purposes only. It is not financial advice and should not be used as a sole basis for making trading decisions. Always do your own research and test thoroughly before applying to live markets. Trading carries risk, and you are solely responsible for your decisions.
Chopiness
Advanced Choppiness Indicator with CPMA"The Advanced Choppiness Indicator with CPMA is a technical analysis tool designed to assist traders in identifying choppy market conditions and determining trend direction. It combines two key components: the Choppiness Index and a Custom Price Moving Average (CPMA).
The Choppiness Index is calculated using the Average True Range (ATR), which measures market volatility. It compares the ATR to the highest high and lowest low over a specified period. A higher Choppiness Index value indicates choppier market conditions, while a lower value suggests smoother and more directional price movements.
The CPMA is a custom moving average that takes into account various price types, including the close, high, low, and other combinations. It calculates the average of these price types over a specific length. The CPMA provides a smoother trend line that can help identify support and resistance levels more accurately than traditional moving averages.
When using this indicator, pay attention to the following elements:
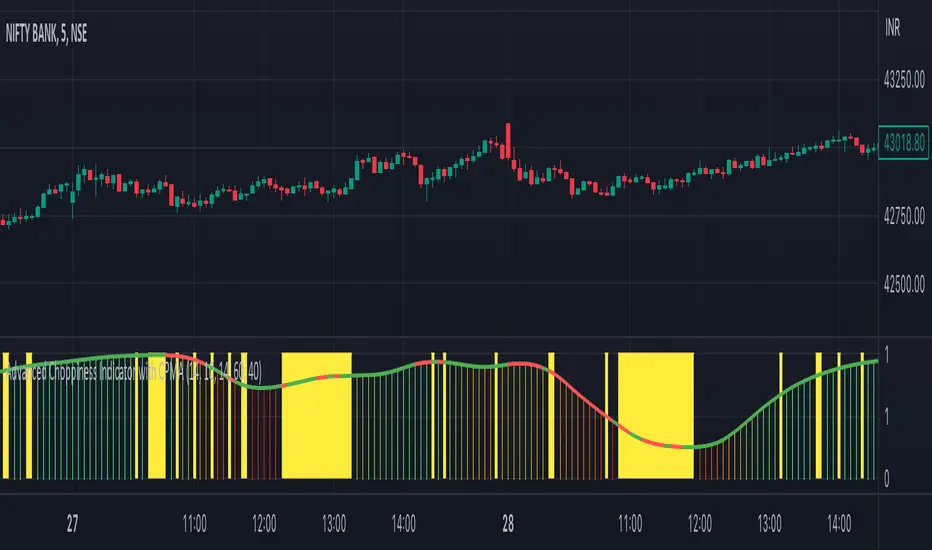
Yellow range boxes: These indicate choppy zones, where market conditions are characterized by low momentum and erratic price action. Avoid entering trades during these periods.
Histogram bars: Green bars suggest an uptrend, while red bars indicate a downtrend. These bars are based on the CPMA and can help confirm the prevailing trend direction.
CPMA angle: The angle of the CPMA line provides further insight into the trend. A positive angle indicates an uptrend, while a negative angle suggests a downtrend.
Choppiness thresholds: The indicator includes user-defined thresholds for choppiness. Values above the high threshold indicate high choppiness, while values below the low threshold suggest low choppiness.
Trade decisions: Consider the information provided by the indicator to make informed trading decisions. Avoid trading during choppy zones and consider entering trades in the direction of the prevailing trend.
Remember that the indicator's parameters, such as ATR length and CPMA length, can be adjusted to suit your trading preferences and timeframe. However, it's important to use this indicator in conjunction with other technical analysis tools and your trading strategy for comprehensive market analysis."
By combining the Choppiness Index, CPMA, and other visual cues, this indicator aims to help traders identify suitable trading conditions and make more informed decisions based on market trends and volatility.
Choppiness Index TileA simple tile on the chart that indicates the choppiness index on the chart for the chart's timeframe. The index tile will show 3 different colors based on the value of the choppiness index. 61.8 for the high threshold and 38.2 for the lower threshold.
Berzerker IndexSome pairs have their own distinct behavior. That includes volatility, news reactiveness, trend x chop day discrepancy, and other qualities.
At first, I tried to measure this with the Choppiness Index, but it looks pretty much alike when you compare symbols like EURNZD and GBPCAD, but my testing shows some major behavioral differences between the two. Hence, I decided to build my own measurement which I later decided to call Berzerker Index.
• The calculation takes the previous value and adds 1, 3, 7, or 15 depending on how many standard deviations the price beats.
• Deviations use Jurik Moving Average as a central line. If there is no new penetration, the total value will not be increased.
• At the end of the value update, the result will decay whether it is changed or not. The readings decay significantly faster if the price is between the bands.
• The beginning of the calculation is the beginning of the chart. There isn't any period for the calculation.
As you can see, from the beginning of the year, the maximum readings on EURNZD are 49.8 and 73.6 for GBPCAD. This is what I wanted to achieve - find some way to clearly differentiate the pairs. Later, I went on EURUSD to confirm the results. EURUSD should be a calmer pair and it shows 33.5 which supports the theory.
The symbols with small bars and explosions on events and bank meetings will reach high values, whereas those that are more predictable with less extreme movements will be found below 45.
Lastly, you may identify long periods of continuous descend on the indicator as setting up for a large explosion. This is not the original idea but could work nevertheless.
Of course, I will further update this indicator if I get improvement ideas...
FAQ:
► Does this repaint?
• No.
► Where is the buy signal?
• There isn't one. The purpose is to study repeated behavioral patterns of different symbols, not to drink from the holy grail.
► Why is it called the 'Berzerker' Index?
• I don't know.
I used @everget's version of Jurik's Moving Average with his consent.
What do ya thing?