BNG MACD / Blue and Green MACDJust publish it again so it's easier to search this indicator. Just inspired from macd 4c. I changed it to blue and green color so it's looks better.Indicateur Pine Script®par c07372
Moving Average Colored 6 EMA MultipleMoving Average Colored 6 EMAIndicateur Pine Script®par aballard1122208
Moving Average Shaded Fill Area Crossover EMA Color - EditableMoving Average Shaded Fill Area Crossover EMA Color with option to change EMA valueIndicateur Pine Script®par aballard111111 4.8 K
TSS_MACDDefault MACD with Histogram color change based on levelIndicateur Pine Script®par saiography40
Colored EMAThis is a modified version of the exponential moving average indicator to change color based on trend (red/bearish if price has closed below EMA, green/bullish if price has closed above EMA).Indicateur Pine Script®par ZenAndTheArtOfTradingMis à jour 66 1.6 K
Volume Strength Candles / Colored BarsIs Price Action Higher or Lower on STRONG or WEAK VOLUME from lookback (Strong or Weak Bulls // Strong or Weak Bears) Candles / Bars Indicate the Following (default 13 period lookback / Length) MAROON Bear Candle with STRONG VOLUME more than 150% of the lookback / length (13 default), STRONG Bear Candle Confirmed With Volume RED Bear Candle while VOLUME is BETWEEN 50% & 150% of the Lookback / Length (13 default), Neutral Bear Volume Neither strong or weak ORANGE Bear Candle with WEAK VOLUME (Less than 50% of the Length / Lookback) DARK GREEN Bull Candle with STRONG VOLUME MORE than 150% of lookback GREEN Bull Candle with Neutral VOLUME BETWEEN 50% & 150% of the lookback / Length AQUA Bull Candle with WEAK VOLUME less than 50% of the Lookback Is price confirmed by volume? Can Change the Lookback / Length from 13 Can Change the Colors and Transparency to easily see based off your chart background colors I recommend ZERO Transparency to easily identify volume strength (i use white background but many use black or other) Indicateur Pine Script®par stokedstocks44583
Ichimoku Signal + Candle Color + Candle Pattern1. Ichimoku Signal: Bullish Signal: - UP-S: A strong bullish signal occurs when the Tenkan Sen crosses from below to above the Kijun Sen and the cross is above the Kumo. - UP: An neutral bullish signal occurs when the Tenkan Sen crosses from below to above the Kijun Sen and the cross is in the Kumo. - UP-W: A weak bullish signal occurs when the Tenkan Sen crosses from below to above the Kijun Sen and the cross is bellow the Kumo. - Fly: A strong bullish signal when Chikou Span raise above the Kumo. Bearish Signal: - DN-S: A strong bearish signal occurs when the Tenkan Sen crosses from above to bellow the Kijun Sen and the cross is bellow the Kumo. - DN: An neutral bearish signal occurs when the Tenkan Sen crosses from above to bellow the Kijun Sen and the cross is in the Kumo. - DN-W: A weak bearish signal occurs when the Tenkan Sen crosses from above to bellow the Kijun Sen and the cross is above the Kumo. - Dig: A strong bearish signal when Chikou Span fall bellow the Kumo. 2. Candle Color based on RSI (from NazcaProjections) - Yellow represents Super OverBought - Lime Green represents OverBought - Green represents Slightly OverBought - Red represents Slightly OverSold - Dark Red represents OverSold - Gray White represents Super OverSold 3. Candlestick Patterns Identified: Doji , Evening Star , Morning Star , Shooting Star , Hammer , Inverted Hammer , Bearish Harami, Bullish Harami, Bearish Engulfing , Bullish EngulfingIndicateur Pine Script®par Crypto_level_UPMis à jour 33397
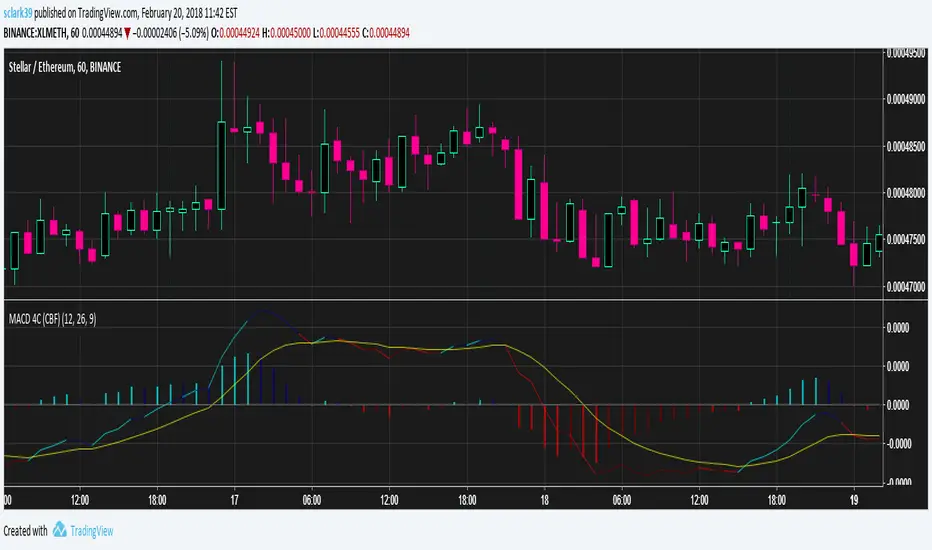
MACD (4 Color, Color-Blind Friendly)Working MACD Histogram which colors bars based on the slope from the previous. The default colors will work for both Deuteranopia and Protonopia color-blind people but can be modified. There is a bug with 'MACD 4C' by vkno422 + signal line - squattter and 'MACD for colour blind people' by cfhrtd in that it draws the MACD line itself as a histogram, rather than drawing an MACD histogram (which is the MACD line - signal line). Bad indicators that this should replace: Indicateur Pine Script®par sclark39Mis à jour 83
On Balance Volume (CCI-coded) [Krypt]This is a straightforward modification of LazyBear's CCI-coded OBV indicator with the following changes: 1) uses log-hl2 as source, which seems to be a more stable indicator of price change than close 2) adds optional price smoothingIndicateur Pine Script®par fskryptMis à jour 33479
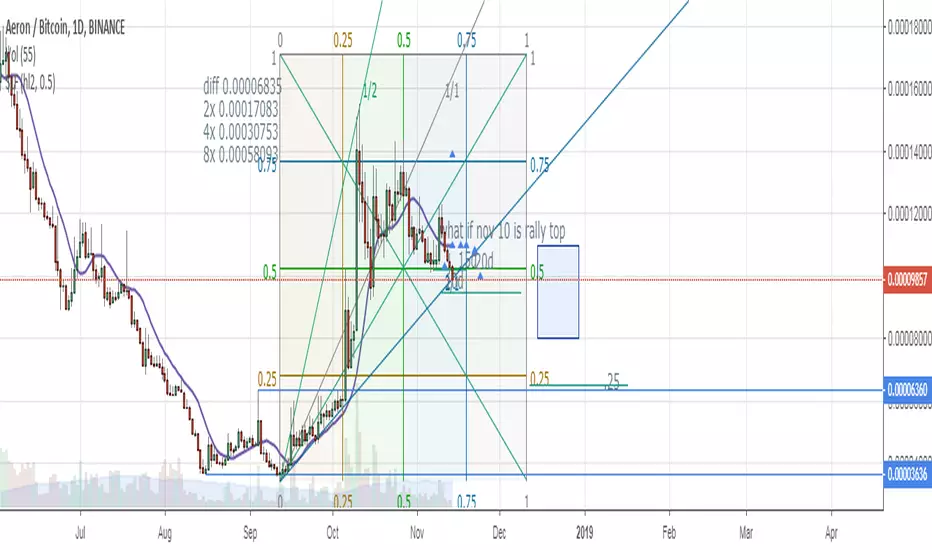
HiLo Daily Fibonacci R1 by JustUncleLThis is another indicator in my Pivot level series. This one automatically draw Fibonacci levels based on the previous day's lowest (0%) and highest (100%) values, similar to a Fibonacci retracement. Manual TimeFrames can be given, it is just a text string though and is not checked, so needs to be a valid resolution eg: 60, 120, 240, 360, 480, 720, 1D, 1W, 1M, 2D, 2W, 3M LEVELS: Green = 100% - 200% Levels Blue = 0 - 100% Levels Red = -100% - 0 Levels Optionally can display historical Daily Fibonacci Levels. Indicateur Pine Script®par JustUncleLMis à jour 33 1.1 K
B3 Stochastic FullA colorful take on the classic stochastic indicator, coded from scratch. Enjoy! :)Indicateur Pine Script®par HammondB366433
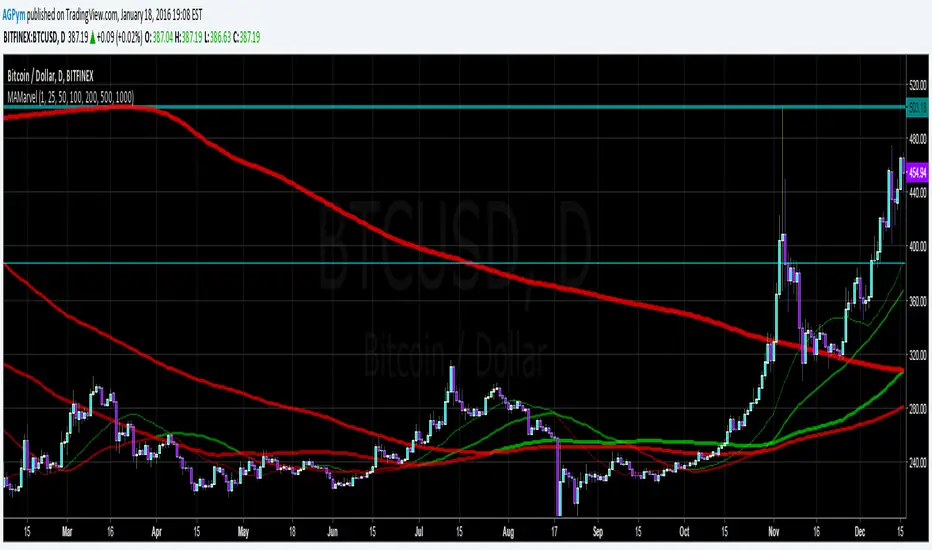
MA Marvel - MultiMA by AGPymMulti-Moving Average in a single color changing indicator. Lines change color when they cross.Indicateur Pine Script®par AGPym110
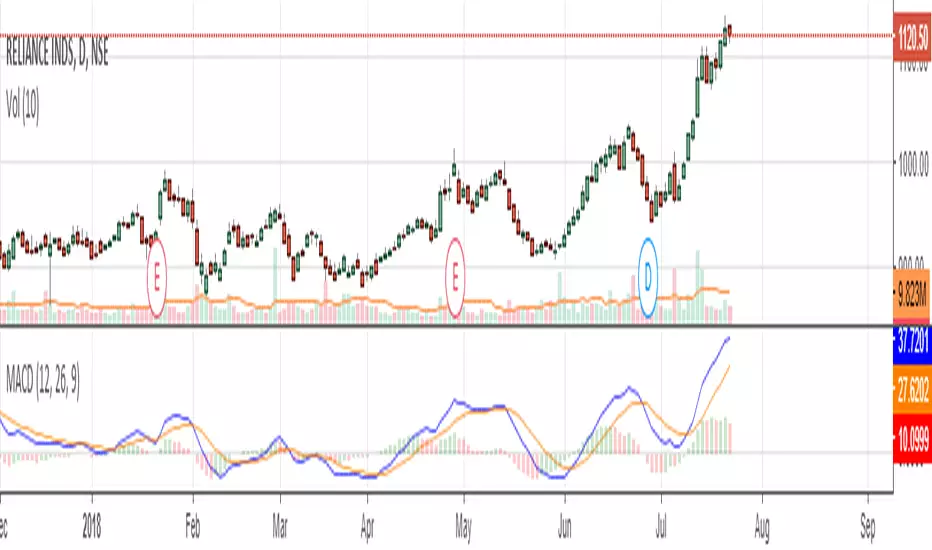
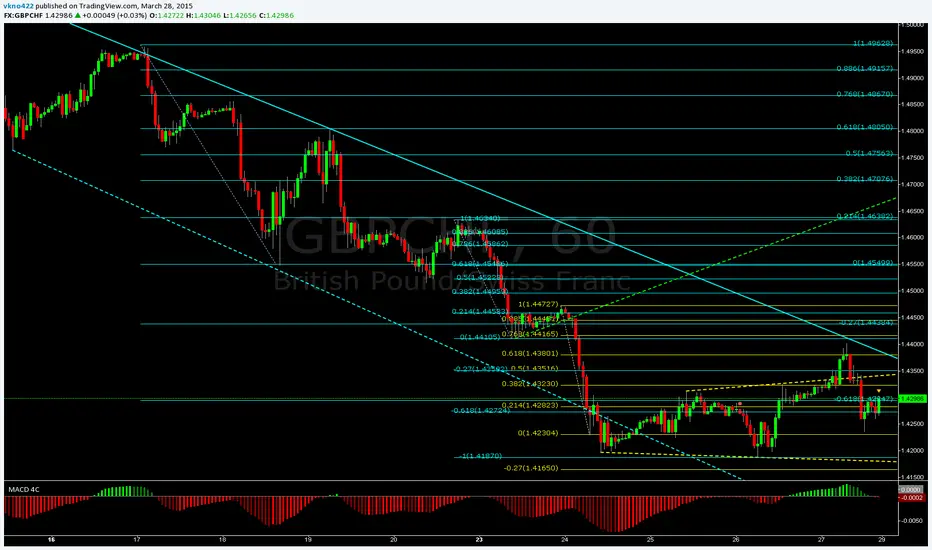
4 colour MACD with signal lineThis is the same as the MACD 4C but it also has the signal line. Indicateur Pine Script®par vkno4221010 1.1 K
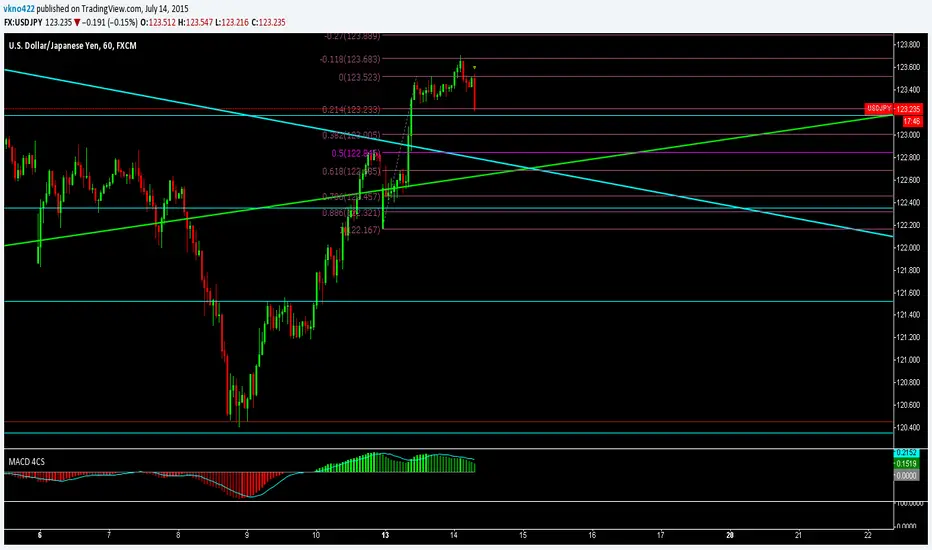
MACD 4C4 Coloured MACD lime = positive rising green = positive descending red = positive rising maroon = positive descendingIndicateur Pine Script®par vkno4226060 19.2 K
MACD 4C4 Coloured MACD lime = positive rising green = positive descending red = positive rising maroon = positive descendingIndicateur Pine Script®par vkno42266 3.6 K
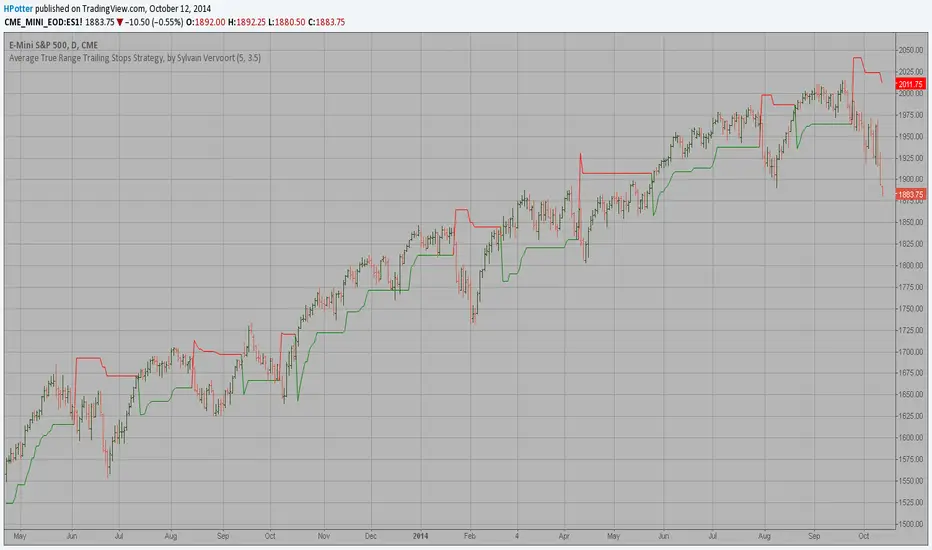
Average True Range Trailing Stops ColoredAverage True Range Trailing Stops Strategy, by Sylvain Vervoort The related article is copyrighted material from Stocks & Commodities Jun 2009 Indicateur Pine Script®par HPotter3030 4.3 K