Exponential Grid [Phi, Pi, Euler]If you disagree with one of the EMH principles that price is too random, then by definition you must agree that historic price has deterministic function to a scenario ahead.
I personally believe that constants like phi, pi and e can mimic exponential growth of the price.
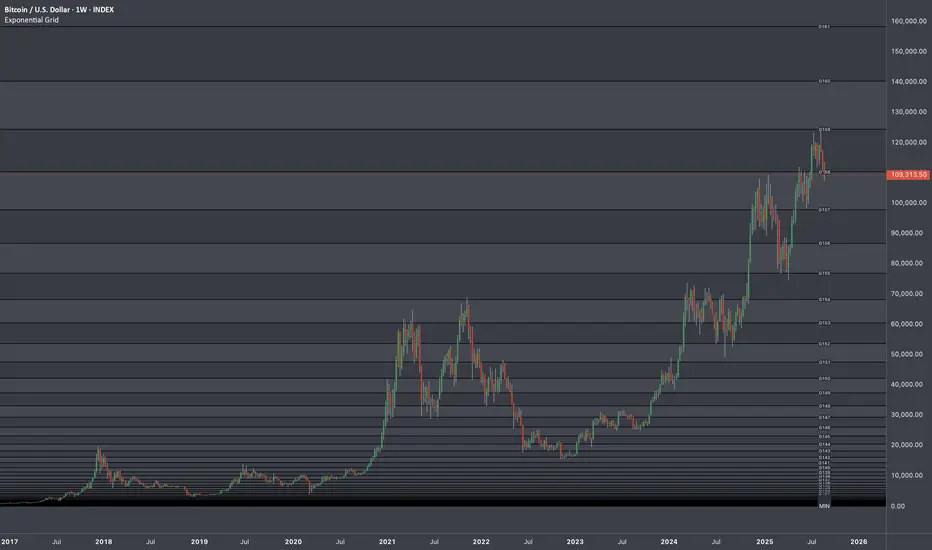
In this script, first grid is based on the Lowest price multiplied with self fraction of the constant.
For example:
If you are familiar with fib ratio 1.272, then you must know that it is 1.618 to the power of 0.5.
With default settings of exponent step 0.25
First grid = Lowest price x phi^0.25
Second grid = Lowest price x phi^0.25x2
Third grid = Lowest price x phi^0.25x3 and so on
The script will automatically find the lowest price and update the grid values.
Or you can set up your custom Lowest price manually if you feel like the All Time Low level loses its relevance value after long period.
There are 64 grids including Lowest price level. And it wasn't by a chance. Pine Script has a limitation of max 64 plots. Number of grids shown in the chart depends on the highest price. Once price breaks above ATH a couple of next grids will be plotted automatically. In most cases if everything is plotted, the chart appears squeezed and you'll need to zoom in to see it. Therefore, I adjusted it relatively to the scale of the chart for the comfort.
In some cases 64 plots aren't enough to cover the whole chart. For example, let's take a look at NVIDIA chart:
Since the price has started with 0.0333, it is way too small to cover all with default settings.
We are left with 2 choices:
Either Enable "Round"
OR increase Exponent Step (from 0.25 to 0.5 in the particular example below)
If you set constant to pi or e which is a bigger number than phi, expect the gaps to be bigger. To reduce it to a more gradual way of expansion you can decrease Exponent Step.
Indicateur Pine Script®