Crude Oil: Backwardation Vs ContangoCrude Oil, CL
Plots Futures Curve: Futures contract prices over the next 3.5 years; to easily visualize Backwardation Vs Contango(carrying charge) markets.
Carrying charge (contract prices increasing into the future) = normal, representing the costs of carrying/storage of a commodity. When this is flipped to Backwardation(As the above; contract prices decreasing into the future): it's a bullish sign: Buyers want this commodity, and they want it NOW.
Note: indicator does not map to time axis in the same way as price; it simply plots the progression of contract months out into the future; left to right; so timeframe DOESN'T MATTER for this plot
TO UPDATE (every year or so): in REQUEST CONTRACTS section, delete old contracts (top) and add new ones (bottom). Then in PLOTTING section, Delete old contract labels (bottom); add new contract labels (top); adjust the X in 'bar_index-(X+_historical)' numbers accordingly
This is one of several similar Futures Curve indicators: Meats | Metals | Grains | VIX | Crude Oil
If you want to build from this; to work on other commodities; be aware that Tradingview limits the number of contract calls to 40 (hence the multiple indicators)
Tips:
-Right click and reset chart if you can't see the plot; or if you have trouble with the scaling.
-Right click and add to new scale if you prefer this not to overlay directly on price. Or move to new pane below.
-If this takes too long to load (due to so many security calls); comment out the more distant future half of the contracts; and their respective labels. Or comment out every other contract and every other label if you prefer.
--Added historical input: input days back in time; to see the historical shape of the Futures curve via selecting 'days back' snapshot
updated 20th June 2022
© twingall
Crude

Accurate BUY & SELL 5 mins TF by RRAlways trade using 5 mins Time frame of chart.
For Buy entry always buy 1 point above the candle closing price & SL would be previous candle low or 30 points.
For Sell Entry Always Sell 1 point below the candle opening price & SL would be previous candle high or 30 points.
Do not take trades using 3 mins Time frame, as there is lot of noise. It works best with 5 mins Time frame.
I have adjusted/set according my trading pattern, if needed use the settings options to set accordingly .
Removed range highlighter to keep the chart simple.
Original Version credits to ZacVaughn
Actual Version i just set alerts and change the parameters for Crude OIL 5min Chart.
NO REPAINT.
Wait For Barclose

Bollinger Band Strategy (Basic) Version 1 This strategy is for learning purposes only. Pay special attention to these strategies on longer aggregation periods (like 1 hr chart or more). Don't expect accurate results when you set a limit to 10 cents above your entry to be accurate. For example if you set the chart to 1 day, the price may move down and hit a stop 10 times then tag your limit. If this doesn't make sense, just don't use strategies here. Learn more first. That being said, I don't have specific recommendations for each aggregation period, backtesting isn't always perfect.
Now then, this strategy can be used as the traditional BB method by setting the "Stop" and "Limit Out" to like 10000, check "Reversal Entry" and uncheck "Limit Time of Day" This will keep the strategy running just reverse your position when price crosses outside each band.
INPUTS:
Length - length of WMA that I used for mean of Bollinger Band (this may suppose to be SMA, too bad)
Source - O-H-L-C basis for WMA
Deviation - normal Standard deviation that would be set when using Bollinger Band
Trailing stop check box - your stop value will be either a hard stop or trailing stop for an exit
Stop - the stop value - remember you can set this really high and it won't stop out
Limit Out - the limit value for exit
Reversal Entry check box - This changes each entry from a reversal (traditional idea of BB) to enter a trend trade - hopefully version 2 will have choice to trend one direction and reversal in the other.
Limit Time of Day - Especially when trading futures, you may want to only trade a specific time of day, when this box is checked, you can set the entry times below, exit will still only occur based on limit/stop or a flip entry order (the opposite entry condition is met)
Tips:
when I don't know a thing about a price range, like gold. I can set the limit out to 10000 and play with a trailing stop to get a better idea of what is even possible before tuning further.

Powerfull strategy MACD+RSI+STOCH ATR stop best on Crude OilMy strategy uses a combination of three indicators MACD Stochastic RSI .
The Idea is to buy when ( MACD > Signal and RSI > 50 and Stochastic > 50) occures at the same time the BUY STop we place on previous day HIGH
and sell (short) when the opposite condition occurs we place SELL STOP on previous day LOW
We exit on Take profit or Stop loss which is calculated by ATR (10) or on the opposite signal "Volatility breakout"
This strategy works well on stocks, commodities and cryptos especially during market breaking up after consolidation
The best results are on Daily charts , so its NOT a scalping strategy. But it can work also on 1H charts.
The strategy does not have any stops and profit targets, so we can take all the market can give us at the moment.
The exit point only when MACD goes under Signal
Its Preformance is significantly better with "buy stop on High.1 and sell stop on Low.1" idea and exit on "volatility price breakout"
So, use it, trade it.
If it will help you to imprive your trading results, please donate me
BTC: 12kd1F8buWisUBdq27BBwRkUvzW7Ey3og

Dhananjay Volatility stop strategy v1.0
Sharing one more strategy after getting good feedback on my earlier published strategy.
This is simple volatility stop strategy where in we are using VStop as entry and exit point.
Again smart traders can add MA to decide the trend and can avoid trading in opposite direction of trend which will help them to minimize loss making trades.
There are more than 1 parameters which traders can use/change to make this strategy compatible to their instrument.
To understand what is VStop use google.com :-)
Looking forward to receiving feedback from all of you.

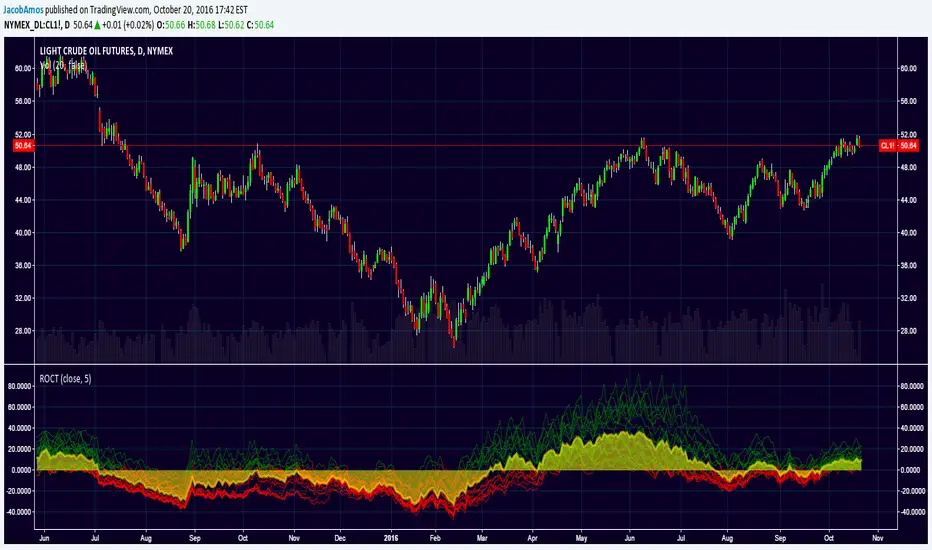
ROC TideAdds some depth to the traditional rate of change (ROC) indicator. Instead of just having one ROC line with a single lookback period, this takes a minimum lookback period, n , and plots 20 ROC lines with lookback periods of n, 2n, 3n, ..., 20n . These lines will appear green when greater than zero, red when less than zero, and yellow when equal to zero by default.
Then it plots the average of those 20 ROC's as a yellow filled area so as to make it easier to see where the balance (or "tide") of the ROC waves are located.