Ichimoku Cloud & ADX & MACD with TSL [tg1]Hi There! Used the time at home during the corona to learn Pinescript and work on this strategy. Its finetuned for BTCUSDT on mid-high timeframe, can be used for other TF/markets, but be extra careful).
The strategy is mainly build around Ichimoku Kinko Hyo and its Tenkan and Kijun crosses. It aims to only buy/sell when there is a strong trend in any direction (using MAs, ADX and ATR) and enters a trade based on these conditions:
1) Tenkan > Kijun
2) Close > Kumo
3) MACD > Signal
4) ADX > Custom value
The same applies for shorts, just the other way around.
I added a TSL based on either % or ATR fixed % for improved risk management. Let me know if any questions.
Crypto-monnaie

Takashi Bows Autopilot | 2nd Gen | [Strategy]This is a strategy tester for Takashi Bows Autopilot indicator. Please check for more details and instructions at our website.
Takashi Bows Autopilot is the ultimate trading tool. Effortless, its signals put traders inside strong trends, locking big profits that cover all loss generated during sideways trends.
An upgrade version of Takashi Bows v1, this script is the result of some operations developed by us, it can easily adapt to different markets and time frames. Now ranging from level 1 to 20, traders can select the amount of signals to be displayed on the chart. Based on price movement, it signals entries after strong movement up or down.
Take Profit included. If a position is opened in one direction, it should be closed at take profit levels or when a position in the opposite direction is opened.
Inputs
Level
Integer input. Sets a level for signals generated up and down. The higher the level, more signals on chart, and vice-versa.
Take Profit %
Float input. Sets a percent of take profit for exiting previous open position.
Rule
Float input. Sets a ruler for more accuracy on less volatile markets. Standard value 1 for high volatile markets, higher values for low volatile markets.
Disclaimer:
Back-tests do not guarantee performance on the future. Even if a trading setup is profitable in historical data. it could be unprofitable in the future.
To get access to this and other scripts check links below.

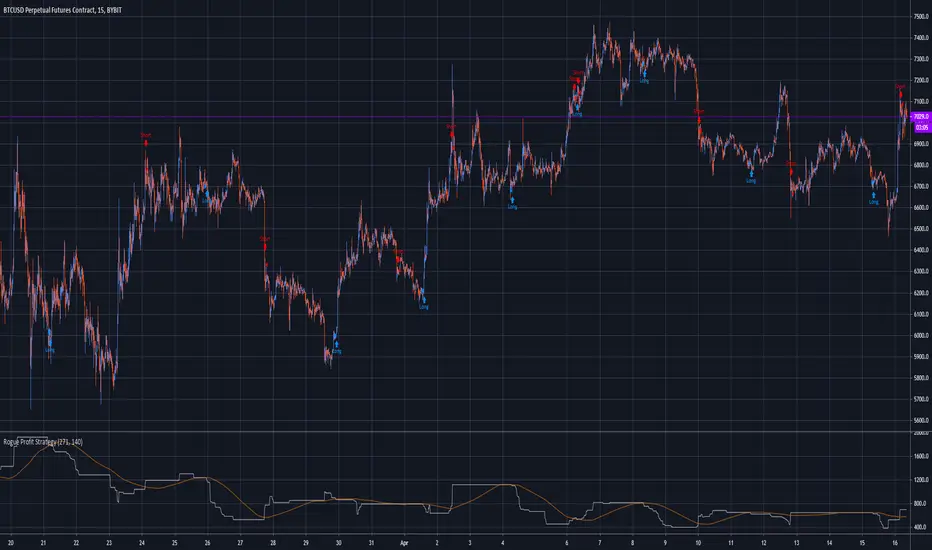
Rogue Profit StrategyThis is a complex script developed to measure specific volatility parameters and enter trades based on predetermined rules which are proprietary and will not be released, so don't ask for specific strategy settings.
The strategy keeps you in the market at all times either long or short. Parameters can be changed to better suit the asset your are trading, time frame and your particular trading style but the overall volatility rules for entering and exiting remain the same. It can be used to trade any asset but be aware the parameters you use for one asset, lets say Bitcoin, will not work with another asset like Forex. If the asset is on TradingView, you can use this indicator to trade it.
It is meant to trade pure price action candlesticks so do not use anything but a typical candlestick chart. You are going to have to put in some work and play around with the input parameters to make this strategy the most profitable for your trading style. Trading is hard but hopefully this strategy will help flatten the learning curve. This strategy is accompanied by an indicator study named "Rogue Profit Alert Indicator" that will work with setting alerts for manual or automated trading.
This strategy does NOT repaint.
This is a very powerful and profitable script that will simplify your trading and has been in development and tested for three years. Message for details on how to obtain access. Please allow up to 24 hours for a response.
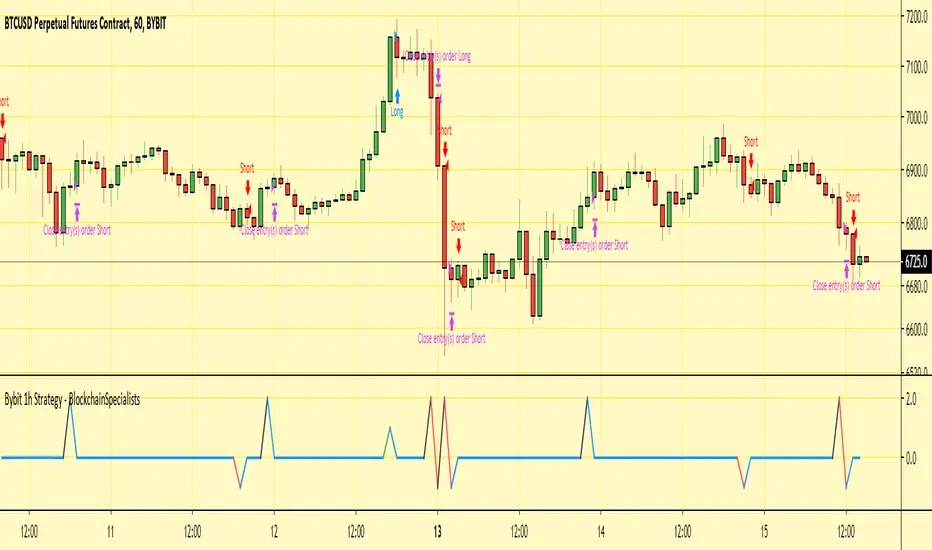
Bybit 1h Strategy - BlockchainSpecialistsHi,
This strategy is a combination of multiple different trend identifying and mean reversion indicators. It aims to work on all Bybit Crypto/USD pairs on the hourly time frame. It works on other time frames but not to the same levels of success. I've tried to keep it as simple as possible by making the indicator flash or alert when a long/short entry has been identified, and also when long/short exit criteria has been met. Make sure to wait until the candle has closed and the indicator has finished forming otherwise you could get jumpy alerts. To clarify this is what you need to look out for:
1 = Long Signal
-1 = Short Signal
2 = Long/Short exit (this will only flash when a position is currently open)
I've also colour coded the signals to make it even simpler and even prettier.
Any questions/issues/suggestions let me know.
Please enjoy!
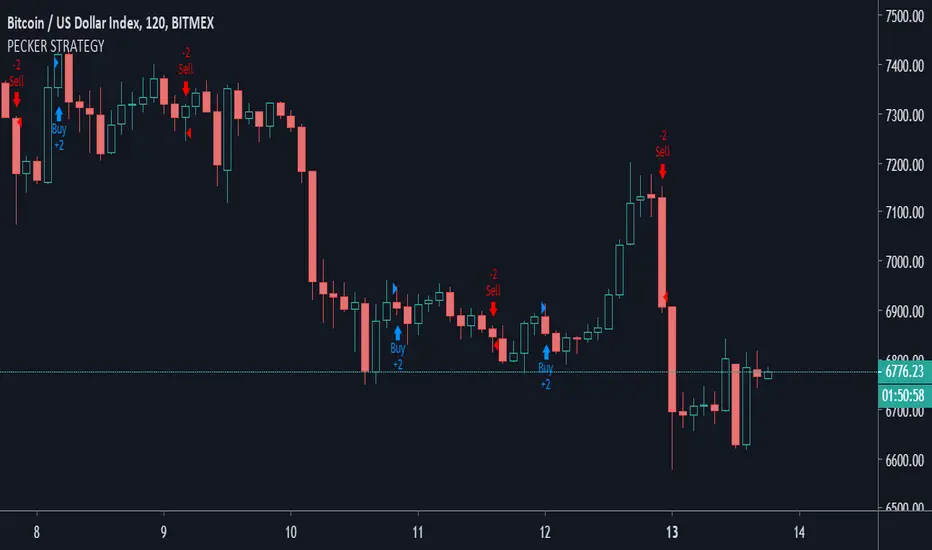
PECKER STRATEGYStrategy works best on higher time frames 1h+ (best performance in bitcoin on 2Hr candles) and in the default settings tested on Bitcoin XBT/USD on Bitmex
It is designed to detect trend changes, reverses in price movements and to always be in position, either long or short.
Strategy has only two types of signals, either long or short to indicate trend switch.
Do not forget to set taker's fee 0.075% on bitmex for example and to account for slippage.
BlackPika TrendTrader StrategyIntroducing the Trend Trader
This strategy uses moving averages as its base and it can be effective for trading ALT/BTC pairs on higher timeframes (4H to D)
It is intended to give you a direction of the trend of the market. I personally use it to gauge the trend and trade major pairs.
The backtester has 0.1% commision set and a slippage of 1 tick.
Some more custom options are available as following
Fixed TP
Fixed SL
Trailing TP
Trailing SL
Nothing above constitutes as a financial advise. If you have any question, please feel free to ask !
Good luck in your trading.

GoldMode On (Triple compromise strategy) TF 60-240BINANCE:BTCUSDT
Greetings.
I am publishing this script in order to get feedback for further work on it.
The script combines a compromise between several classic strategies, and each of them uses modifications of classic indicators on specially selected averaging sliding indicators.
1. The script uses an ATR-based filter (it's off by default, as it's better on BTCUSD , but you can enable it in the settings if you want to use it on EURUSD , for example, or on other symbols).
2. A strategy based on crossing the moving.
3. A strategy based on determining the direction of movement of the modified slow and fast RSI .
4. A strategy based on the modified ADX +DI -DI .
The essence of the strategy in finding a compromise decision on the signals coming from each of these three strategies.
=====
Приветствую.
Данный скрипт публикую с целью получить обратную связь для дальнейшей работы над ним.
Скрипт сочетает в себе компромисс между несколькими классическими стратегиями, причём каждая из них использует модификации классических индикаторов на специальным образом подобранные усредняющие скользящие.
1. В скрипте используется фильтр на основе ATR (по умолчанию выключен, т.к. на BTCUSD так лучше, но можно включить в настройках, если хотите использовать его на EURUSD , например, или на других инструментах).
2. Стратегия основанная на пересечении скользящих.
3. Стратегия основанная на определении направления движения модифицированных медленной и быстрой RSI .
4. Стратегия основанная на модифицированном ADX +DI -DI .
Суть стратегии в поиске компромиссного принятия решения по сигналам поступающим от каждой из этих трёх стратегий.
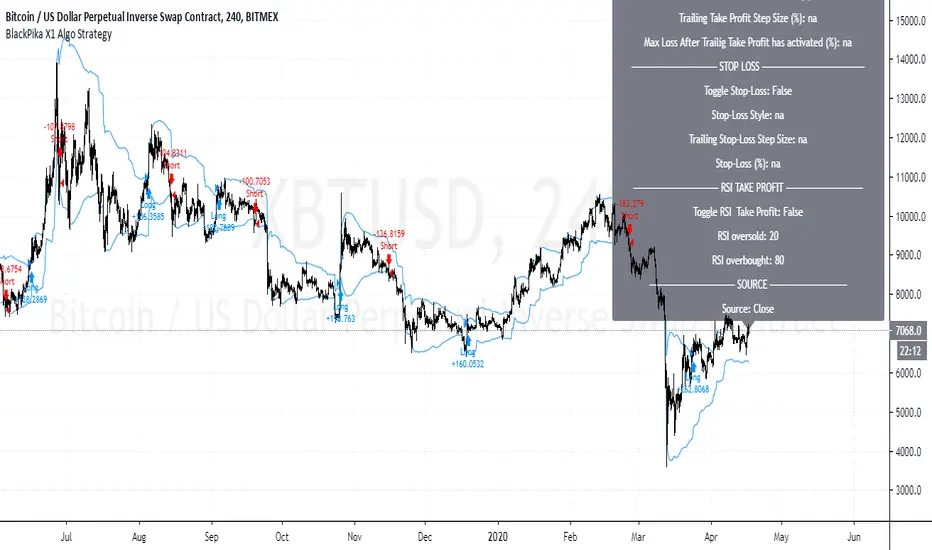
BlackPika X1 Algo StrategyBlackPika X1 Algo is a successor to the original BlackPika Algo.
It uses the following main elements:
RSI
ATR
ADX
Volume
Chopiness Filter
Trailing Profit
Fixed Profit
Trailing Stop loss
Fixed Stop Loss
Donchian channels and some more...
The backtest you see includes a commision of 1% and slippage of 1 tick. and the start date is from 2015
All the above mentioned settings are customisable, and can be adapted to your liking, timeframe and Asset.
Hit me up if you have any questions. This is only a backtest version.
All the best in your trading.
BITCOIN-BTCUSD Trading Strategy-1This Trading Strategy is for BTCUSD which is traded on BITSTAMP exchange. The aim of this strategy is to ride the market with its ebbs and flows.
The strategy works best on 1 Hour timeframe. The results may very different depending upon time-frame and date range of your choice and different exchanges.
Parameters details:
1. Trade Trigger - You can adjust it depending upon your risk management. Default value is 20.
2. Partial Profit Points – Part profit booking points. Default value is 350.
3. Lookback Period 1 – Default is 11.
4. Lookback Period 2 – Default is 5.
The default trading quantity is 2. I have added functionality for part profit booking which increase profit and always keeps you in trade. Book 1 lot for certain points (350 points gives better results) and continue other with 1 lot till the position reversed.
I have tested this indicator on 1 Hour time-frame on BITSTAMP exchange and the time period is maximum available on Tradingview.
Period : 02/01/2019 to 30/03/2020.
Points = $ 17720.56
No. of trades = 129
% Profitable = 44.96%
Profit Factor = 2.464
Sharpe Ratio = 0.674
For free trial, send me a private message in order to access this script.
Thanks © allanster for Date Range functionality and ©LonesomeTheBlue for non-repaint concepts.
Disclaimer: This script/strategy is for educational and information purpose only. The author of this script/strategy will not accept any liability for loss or damage as a result of reliance on the information contained in the charts and buy/sell signals. Please be fully informed regarding the risks and costs associated with trading the financial markets.

hamster-bot HiDeep strategy// DESCRIPTION OF STRATEGY
HiDeep Strategy
Author foresterufa
This is a counter-trending strategy that is gradually gaining a position against the trend at the best price.
A prerequisite for completing a position is the price exit from the internal channel on the chart and the appearance of the HiDeep indicator.
The condition for closing the position is touching the opposite side of the internal channel.
A condition for facilitating closure along the middle line of the channel, with high price volatility , is that the price touches the border of the external channel.
Input signals are generated by HiDeep indicators. Closing a position by moving averages.

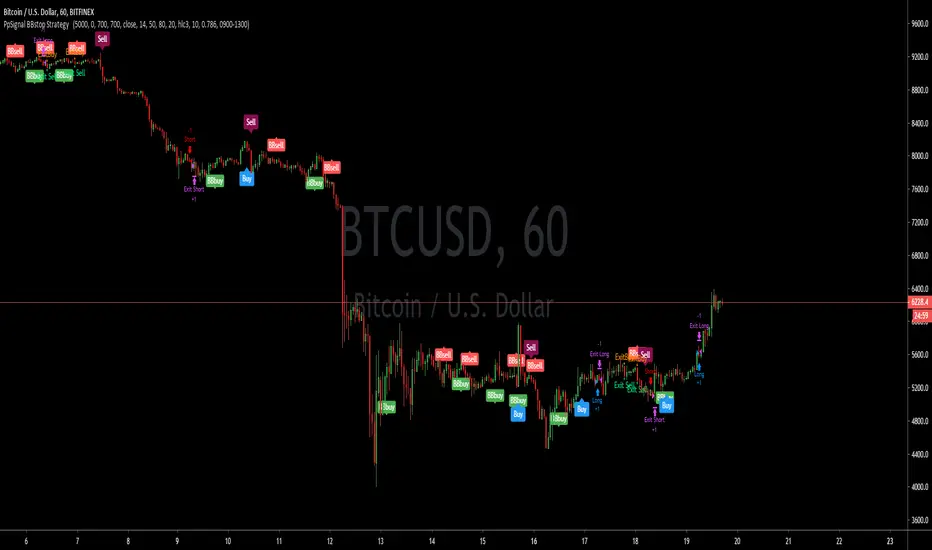
PpSignal BBstop Strategy strategy based on rsi of ma, in the example with btc usd we have as tp 1000 trailing stop 700, but you should adopt the money management to your criteria.
it has an alarm system when you see bbbuy or bbsell is a pre-notice only buy when the signal is Buy in blue or sell in maroon, it also has a buy exit and sell exit warning.
hamster-bot REP strategyThe strategy basically contains RSI + EMA + Parabolic = REP.
Entry: RSI
Trend Filter: EMA
Exit: Trailing Stop Parabolic

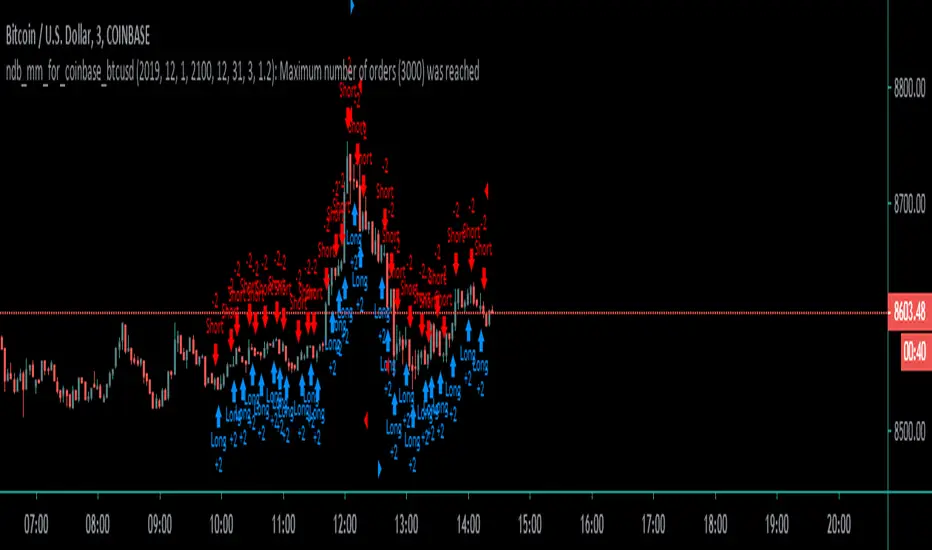
Coinbase_3-MIN_HFT-StrategyThis conceptual strategy trades against the short-term trend. The first position can be either long or short.
In the short-term, prices fluctuate up and down on wide spread exchanges.
And if the price moves to one side, the price tends to return to its original position momentarily.
This strategy set stop order. Stop price is calculated with upper and lower shadows.
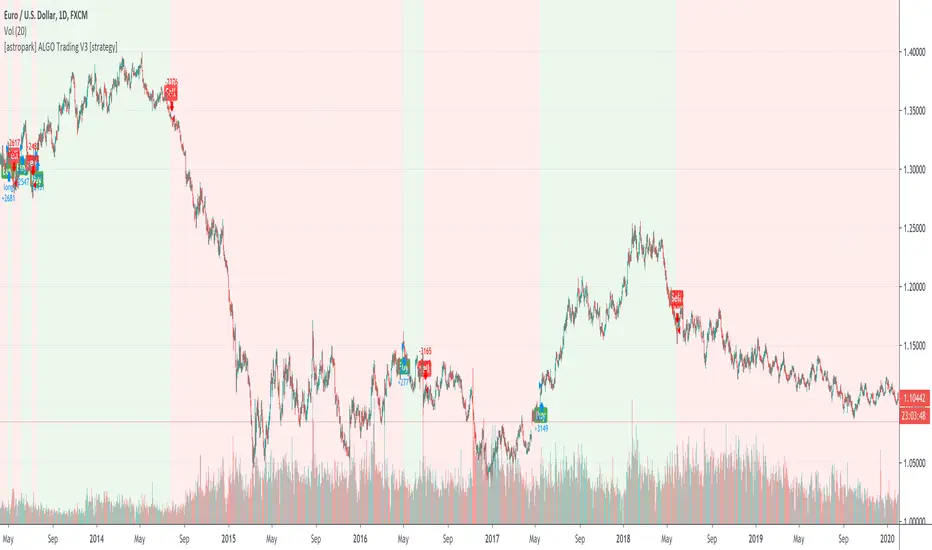
[astropark] ALGO Trading V3 [strategy]Dear Followers,
today another awesome Swing and Scalping Trading Strategy indicator, runnable on a bot , which works great on many timeframes (from 1h and above is suggested), just write me in order to help you find correct settings).
It must be said that this strategy works even better on 1m Renko chart!
If you are a scalper or you are a swing trader, you will love suggested entries for fast and long-lasting profit.
Keep in mind that a proper trailing stop strategy and risk management and money management strategies are very important (DM me if you need any clarification on these points).
This is not an evolution of "ALGO Trading V1" or "ALGO Trading V2" , but a twin sister of them.
For your reference, here it is the "ALGO Trading V1" indicator
and here the "ALGO Trading V2"
This strategy has the following options:
enable/disable signals on chart
enable/disable bars and background coloring based on trend
enable/disable a "filter noise" option , which try to reduce overtrading (you can easily check it on backtesting)
enable/disable a Take Profit / Stop Loss option (you can easily check it on backtesting too)
enable/disable a secret SmartOption which may improve profit on your chart (again, check it on you chart if it helps or not)
This strategy only trigger 1 buy or 1 sell. If you enable Take Profit / Stop Loss option, consider that many TP can be triggered before trend reversal, so take partial profit on every TP an eventually buy/sell back lower/higher to maximize your profit.
In order to get notified when a signal is triggered, you need to use the "alarms" version of this indicator (just search for astropark's "ALGO Trading V3" indicator and choose the one with "alarms" suffix).
Strategy results are calculated on the time window from 1995 to now, so on more than 15 years, using 1000$ as initial capital and working at 1x leverage (so no leverage at all! If you like to use leverage, be sure to use a safe option, like 3x or 5x at most in order to have liquidation price very far).
This is not the "Holy Grail", so use a proper risk management strategy.
This script will let you backtest how the indicator will perform on any chart and timeframe you may like to test and/or trade. Of course results will be very different depending on the chart and timeframe you will open. I tested a lot of charts and always you can find a combination that keep this strategy in profit on swing trading style (and this means that if you can have a daily look at the chart you can always manage to maximize your profit on each trade!)
This is a premium indicator , so send me a private message in order to get access to this script.
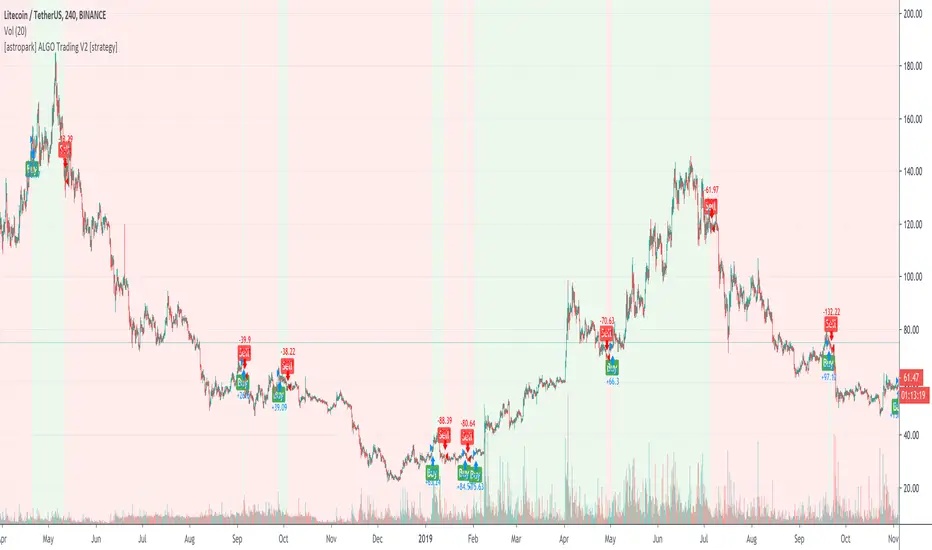
[astropark] ALGO Trading V2 [strategy]Dear Followers,
today another awesome Swing and Scalping Trading Strategy indicator, runnable on a bot , which works great on many timeframes (ones between 1h and 1D are suggested, but just write me in order to help you find correct settings).
It must be said that this strategy works even better on 1m Renko chart!
If you are a scalper or you are a swing trader, you will love suggested entries for fast and long-lasting profit.
Keep in mind that a proper trailing stop strategy and risk management and money management strategies are very important (DM me if you need any clarification on these points).
This is not an evolution of "ALGO Trading V1" or "ALGO Trading V3" , but a twin sister of them. Search them on TradingView to know them better.
Here you can find ALGO Trading V1
This strategy has the following options:
enable/disable signals on chart
enable/disable bars and background coloring based on trend
enable/disable a "filter noise" option , which try to reduce overtrading (you can easily check it on backtesting)
enable/disable a Take Profit / Stop Loss option (you can easily check it on backtesting too)
enable/disable a secret SmartOption which may improve profit on your chart (again, check it on you chart if it helps or not)
This strategy only trigger 1 buy or 1 sell. If you enable Take Profit / Stop Loss option, consider that many TP can be triggered before trend reversal, so take partial profit on every TP an eventually buy/sell back lower/higher to maximize your profit.
In order to get notified when a signal is triggered, you need to use the "alarms" version of this indicator (just search for astropark's "ALGO Trading V2" indicator and choose the one with "alarms" suffix).
Strategy results are calculated on the time window from January 2019 to now, so on more than 1 year, using 1000$ as initial capital and working at 1x leverage (so no leverage at all! If you like to use leverage, be sure to use a safe option, like 3x or 5x at most in order to have liquidation price very far).
This is not the "Holy Grail", so use a proper risk management strategy.
This script will let you backtest how the indicator will perform on any chart and timeframe you may like to test and/or trade. Of course results will be very different depending on the chart and timeframe you will open. I tested a lot of charts and always you can find a combination that keep this strategy in profit on swing trading style (and this means that if you can have a daily look at the chart you can always manage to maximize your profit on each trade!)
This is a premium indicator , so send me a private message in order to get access to this script.
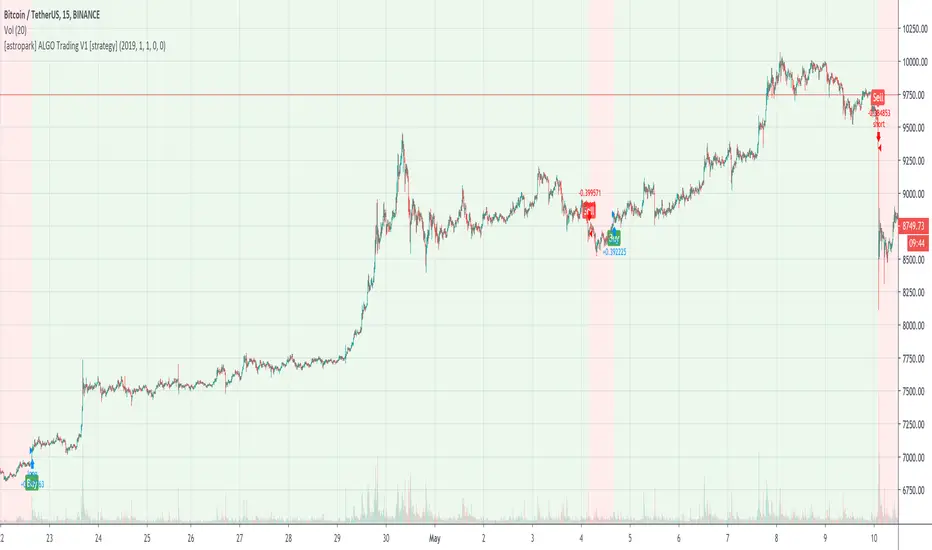
[astropark] ALGO Trading V1 [strategy]Dear Followers,
today another awesome Swing and Scalping Trading Strategy indicator, runnable on a bot , which works great on Low Timeframes (1h is suggested) but also on even lower ones (till 15m) and on higher ones (no further than 1D), just write me in order to help you find correct settings).
It must be said that this strategy works even better on 1m Renko chart!
If you are a scalper or you are a swing trader, you will love suggested entries for fast and long-lasting profit.
Keep in mind that a proper trailing stop strategy and risk management and money management strategies are very important (DM me if you need any clarification on these points).
This is not an evolution of "ALGO Trading V2" or "ALGO Trading V3" , but a twin sister of them. Search them on TradingView to know them better.
This strategy has the following options:
enable/disable signals on chart
enable/disable bars and background coloring based on trend
enable/disable a "filter noise" option, which try to reduce overtrading (you can easily check it on backtesting)
enable/disable a Take Profit / Stop Loss option (you can easily check it on backtesting too)
enable/disable a secret SmartOption which may improve profit on your chart (again, check it on you chart if it helps or not)
This strategy only trigger 1 buy or 1 sell. If you enable Take Profit / Stop Loss option, consider that many TP can be triggered before trend reversal, so take partial profit on every TP an eventually buy/sell back lower/higher to maximize your profit.
In order to get notified when a signal is triggered, you need to use the "alarms" version of this indicator (just search for astropark's "ALGO Trading V1" indicator and choose the one with "alarms" suffix).
Strategy results are calculated on the time window from January 2019 to now, so on more than 1 year, using 1000$ as initial capital and working at 1x leverage (so no leverage at all! If you like to use leverage, be sure to use a safe option, like 3x or 5x at most in order to have liquidation price very far).
This is not the "Holy Grail", so use a proper risk management strategy.
This script will let you backtest how the indicator will perform on any chart and timeframe you may like to test and/or trade. Of course results will be very different depending on the chart and timeframe you will open. I tested a lot of charts and always you can find a combination that keep this strategy in profit on swing trading style (and this means that if you can have a daily look at the chart you can always manage to maximize your profit on each trade!)
This is a premium indicator , so send me a private message in order to get access to this script.
Lowkey System (Strategy)View study version
A long-only strategy that aim to detect the beginning of new bullish trends and their ends.
For entering a new position this script is waiting for a moving average crossover then wait for a volume increase relative to the current volatility.
For closing a position it's simply waiting for a crossunder of whether the MA or if enabled the stop loss.
This strategy is already configured to run on BTCUSD in a 4h timeframe but you can customize the moving average and the stop loss parameters to suit your needs.
I've worked a lot to write this script so I'm not giving it for free but you can try it for 10 days.
Contact me for more details.
Have fun!
PS: I'm french so please excuse me if I've made some grammar errors ;)

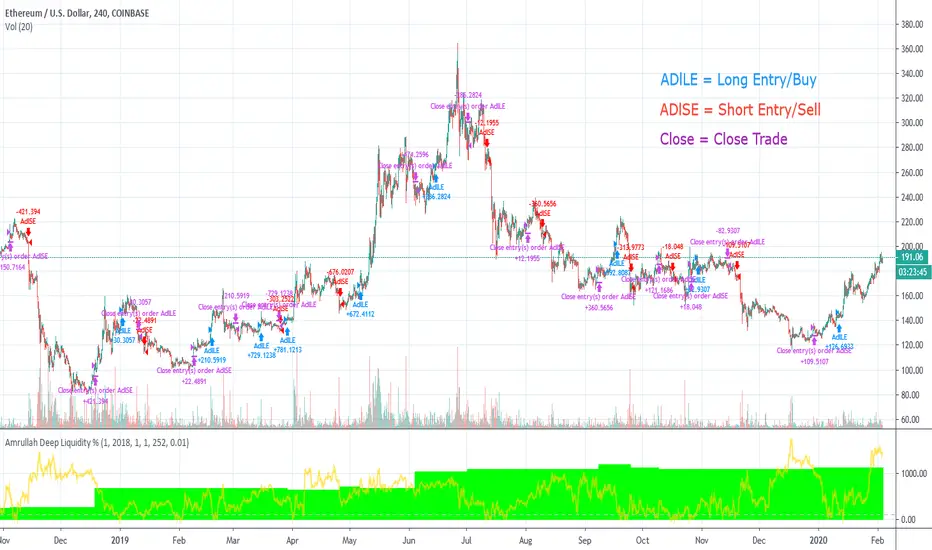
Amrullah Deep Liquidity for ETHUSDAmrullah Deep Liquidity (ADL)
Amrullah Deep Liquidity (ADL) is a high profit factor strategy based on models designed by Muhd Amrullah.
Choosing your trading pair that you are planning to backtest
Check that you have been given access to Amrullah Deep Liquidity (ADL). Select ETHUSD with the default 4H time frame. Once done, open Indicators > Invite-Only Scripts > Amrullah Deep Liquidity %.
Choosing your initial capital that you want to begin backtesting
Go to Settings > Properties > Initial Capital and type in the amount of capital you're starting with. For the ETHUSD trading pair, the initial capital is denominated in USD.
Adjusting your equity at risk until the trades match your risk profile and comfort level
Go to Inputs > Equity Risk and adjust the value you are comfortable with. To analyse performance, you also want to choose the Start Year, Start Month and Start Date. Select lower equity risk for trades that you intend to take without the use of leverage. You can select an equity risk from 0.001 to 0.05 or all the way to 1.
Finding the time frame with the highest profit factor
Profit factor is defined as the gross profit a strategy makes across a defined period of time divided by its gross loss. You may choose to scroll through other time frames to find better models. You can select a different time frame from 1 min to 1H or all the way to 1M. Once you find the model you desire, you are encouraged to check that the model has a backtested profit factor of >3.5. You can then begin looking through the Performance Summary to find other detailed statistics.
Analysing the equity curve from the Amrullah Deep Liquidity (ADL) strategy
A green equity curve indicates that the trades are accumulating profits. A red equity curve indicates that the trades are accumulating losses. A healthy equity curve is one that is green and grows steadily to the right and upward direction.
Analysing the display arrows on the chart
Amrullah Deep Liquidity (ADL) tells you when to take a trade and how much to put in a trade. ADL can do this as the model identifies inventory risk in traders and market makers in the chosen market. On your Tradingview chart, ADL will display an arrow that tells you when to enter a trade. You can also see the amount to trade beside the arrow.
Opting for a trial
Yes you may opt for a trial which has limited availability.
The author's background and experience
My career in software and deep learning development spans across more than 5 years. At work, I lead a team to solve core computer vision tasks for large companies. I continually read all kinds of computer science books and papers, and follows progress on tools used in financial markets.
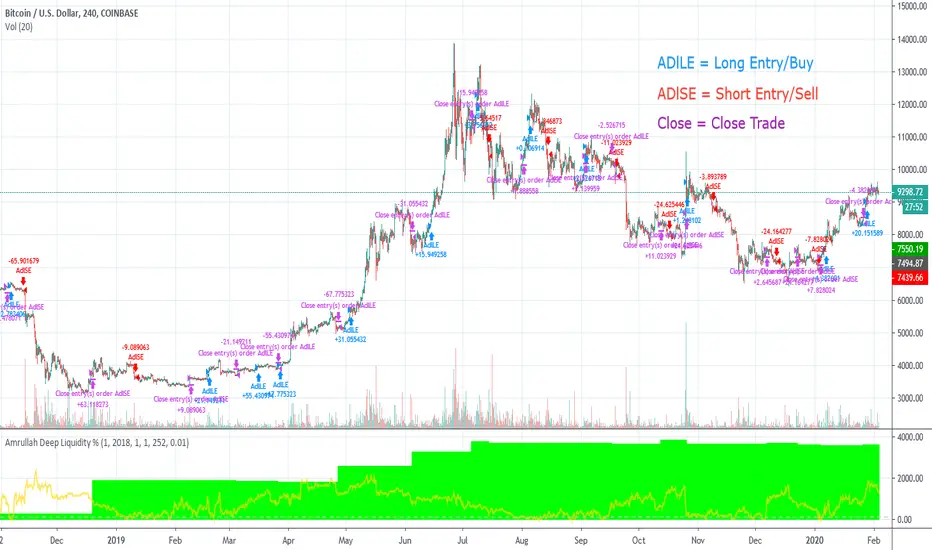
Amrullah Deep Liquidity for BTCUSDAmrullah Deep Liquidity (ADL)
Amrullah Deep Liquidity (ADL) is a high profit factor strategy based on models designed by Muhd Amrullah.
Choosing your trading pair that you are planning to backtest
Check that you have been given access to Amrullah Deep Liquidity (ADL). Select BTCUSD with the default 4H time frame. Once done, open Indicators > Invite-Only Scripts > Amrullah Deep Liquidity %.
Choosing your initial capital that you want to begin backtesting
Go to Settings > Properties > Initial Capital and type in the amount of capital you're starting with. For the BTCUSD trading pair, the initial capital is denominated in USD.
Adjusting your equity at risk until the trades match your risk profile and comfort level
Go to Inputs > Equity Risk and adjust the value you are comfortable with. To analyse performance, you also want to choose the Start Year, Start Month and Start Date. Select lower equity risk for trades that you intend to take without the use of leverage. You can select an equity risk from 0.001 to 0.05 or all the way to 1.
Finding the time frame with the highest profit factor
Profit factor is defined as the gross profit a strategy makes across a defined period of time divided by its gross loss. You may choose to scroll through other time frames to find better models. You can select a different time frame from 1 min to 1H or all the way to 1M. Once you find the model you desire, you are encouraged to check that the model has a backtested profit factor of >3.5. You can then begin looking through the Performance Summary to find other detailed statistics.
Analysing the equity curve from the Amrullah Deep Liquidity (ADL) strategy
A green equity curve indicates that the trades are accumulating profits. A red equity curve indicates that the trades are accumulating losses. A healthy equity curve is one that is green and grows steadily to the right and upward direction.
Analysing the display arrows on the chart
Amrullah Deep Liquidity (ADL) tells you when to take a trade and how much to put in a trade. ADL can do this as the model identifies inventory risk in traders and market makers in the chosen market. On your Tradingview chart, ADL will display an arrow that tells you when to enter a trade. You can also see the amount to trade beside the arrow.
Opting for a trial
Yes you may opt for a trial which has limited availability.
The author's background and experience
My career in software and deep learning development spans across more than 5 years. At work, I lead a team to solve core computer vision tasks for large companies. I continually read all kinds of computer science books and papers, and follows progress on tools used in financial markets.
Amrullah Deep Liquidity for ETHBTCAmrullah Deep Liquidity (ADL)
Amrullah Deep Liquidity (ADL) is a high profit factor strategy based on models designed by Muhd Amrullah.
Choosing your trading pair that you are planning to backtest
Check that you have been given access to Amrullah Deep Liquidity (ADL). Select ETHBTC with the default 2H time frame. Once done, open Indicators > Invite-Only Scripts > Amrullah Deep Liquidity %.
Choosing your initial capital that you want to begin backtesting
Go to Settings > Properties > Initial Capital and type in the amount of capital you're starting with. For the ETHBTC trading pair, the initial capital is denominated in BTC.
Adjusting your equity at risk until the trades match your risk profile and comfort level
Go to Inputs > Equity Risk and adjust the value you are comfortable with. To analyse performance, you also want to choose the Start Year, Start Month and Start Date. Select lower equity risk for trades that you intend to take without the use of leverage. You can select an equity risk from 0.001 to 0.05 or all the way to 1.
Finding the time frame with the highest profit factor
Profit factor is defined as the gross profit a strategy makes across a defined period of time divided by its gross loss. You may choose to scroll through other time frames to find better models. You can select a different time frame from 1 min to 1H or all the way to 1M. Once you find the model you desire, you are encouraged to check that the model has a backtested profit factor of >3.5. You can then begin looking through the Performance Summary to find other detailed statistics.
Analysing the equity curve from the Amrullah Deep Liquidity (ADL) strategy
A green equity curve indicates that the trades are accumulating profits. A red equity curve indicates that the trades are accumulating losses. A healthy equity curve is one that is green and grows steadily to the right and upward direction.
Analysing the display arrows on the chart
Amrullah Deep Liquidity (ADL) tells you when to take a trade and how much to put in a trade. ADL can do this as the model identifies inventory risk in traders and market makers in the chosen market. On your Tradingview chart, ADL will display an arrow that tells you when to enter a trade. You can also see the amount to trade beside the arrow.
Opting for a trial
Yes you may opt for a trial which has limited availability.
The author's background and experience
My career in software and deep learning development spans across more than 5 years. At work, I lead a team to solve core computer vision tasks for large companies. I continually read all kinds of computer science books and papers, and follows progress on tools used in financial markets.

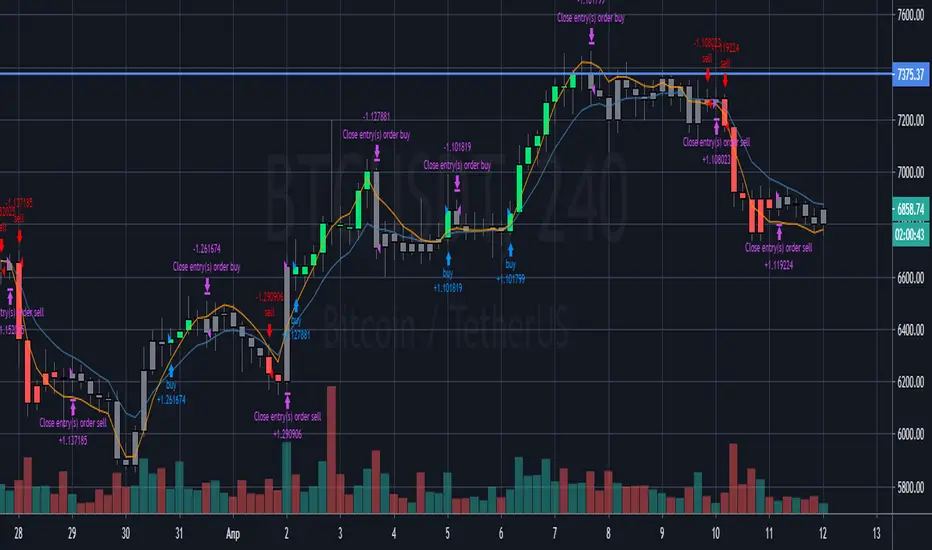
HatiKO EnvelopesPublished source code is subject to the terms of the GNU Affero General Public License v3.0
This script describes and provides backtesting functionality to internal strategy of algorithmic crypto trading software "HatiKO bot".
Suitable for backtesting any Cryptocurrency Pair on any Exchange/Platform, any Timeframe.
Core Mechanics of this strategy are based on theory of price always returning to Moving Average + Envelopes indicator (Moving_average_envelope from Wiki)
Developement of this script and trading software is inspired by:
"Essential Technical Analysis: Tools and Techniques to Spot Market Trends" by Leigh Stevens (published on 12th of April 2002)
"Moving Average Envelopes" by ChartSchool, StockCharts platform (published on 13th of April 2015 or earlier)
"Коля Колеснік" from Crypto Times channel ("Метод сетка", published on 19th of August 2018)
"3 ways to use Moving Average Envelopes" by Rich Fitton, published on Trader's Nest (published on 28st of November 2018 or earlier)
noro's "Robot WhiteBox ShiftMA" strategy v1 script, published on TradingView platform (published on 29th of August 2018)
"Moving Average Envelopes: A Popular Trading Tool" Investopedia article (published 25th of June 2019)
and KROOL1980's blogpost on Argolabs ("Гридерство или Сетка как источник прибыли на форекс", published on 27th of February 2015)
Core Features:
1) Up to 4 Envelopes in each direction (Long/Short)
2) Use any of 6 different basis MAs, optionally use different MAs for Opening and Closure
3) Use different Timeframes for MA calculation, without any repainting and lookahead bias.
4) Fixed order size, not Martingale strategy
5) Close open position earlier by using Deviation parameter
6) PineScript v4 code
Options description:
Lot - % from your initial balance to use for order size calculation
Timeframe Short - Timeframe to use for Short Opening MA calculation, can be chosen from dropdown list, default is Current Graph Timeframe
MA Type Short - Type of MA to use for Short Opening MA calculation, can be chosen from dropdown list, default is SMA
Data Short - Source of Price for Short Opening MA calculation, can be chosen from dropdown list, default is OHLC4
MA Length Short - Period used for Short Opening MA calculation, should be >=1, default is 3
MA offset Short - Offset for MA value used for Short Envelopes calculation, should be >= 0, default is 0
Timeframe Long - Timeframe to use for Long Opening MA calculation, can be chosen from dropdown list, default is Current Graph Timeframe
MA Type Long - Type of MA to use for Long Opening MA calculation, can be chosen from dropdown list, default is SMA
Data Long - Source of Price for Long Opening MA calculation, can be chosen from dropdown list, default is OHLC4
MA Length Long - Period used for Long Opening MA calculation, should be >=1, default is 3
MA offset Long - Offset for MA value used for Long Envelopes calculation, should be >= 0, default is 0
Mode close MA Short - Enable different MA for Short position Closure, default is "false". If false, Closure MA = Opening MA
Timeframe Short Close - Timeframe to use for Short Position Closure MA calculation, can be chosen from dropdown list, default is Current Graph Timeframe
MA Type Close Short - Type of MA to use for Short Position Closure MA calculation, can be chosen from dropdown list, default is SMA
Data Short Close - Source of Price for Short Closure MA calculation, can be chosen from dropdown list, default is OHLC4
MA Length Short Close - Period used for Short Opening MA calculation, should be >=1, default is 3
Short Deviation - % to move from MA value, used to close position above or beyond MA, can be negative, default is 0
MA offset Short Close - Offset for MA value used for Short Position Closure calculation, should be >= 0, default is 0
Mode close MA Long - Enable different MA for Long position Closure, default is "false". If false, Closure MA = Opening MA
Timeframe Long Close - Timeframe to use for Long Position Closure MA calculation, can be chosen from dropdown list, default is Current Graph Timeframe
MA Type Close Long - Type of MA to use for Long Position Closure MA calculation, can be chosen from dropdown list, default is SMA
Data Long Close - Source of Price for Long Closure MA calculation, can be chosen from dropdown list, default is OHLC4
MA Length Long Close - Period used for Long Opening MA calculation, should be >=1, default is 3
Long Deviation - % to move from MA value, used to close position above or beyond MA, can be negative, default is 0
MA offset Long Close - Offset for MA value used for Long Position Closure calculation, should be >= 0, default is 0
Short Shift 1..4 - % from MA value to put Envelopes at, for Shorts numbers should be positive, the higher is number, the higher should be Shift position, example: "Shift 1 = 1, shift 2 = 2, etc."
Long Shift 1..4 - % from MA value to put Envelopes at, for Longs numbers should be negative, the lower is number, the lower should be Shift position, example: "Shift 1 = -1, shift 2 = -2, etc."
From Year 20XX - Backtesting Starting Year number, only 20xx supported as script is cryptocurrency-oriented.
To Year 20XX - Backtesting Final Year number, only 20xx supported as script is cryptocurrency-oriented.
From Month - Years starting Month, optional tweaking, changing not recommended
To Month - Years ending Month, optional tweaking, changing not recommended
From day - Months starting day, optional tweaking, changing not recommended
To day - Months ending day, optional tweaking, changing not recommended
Graph notes:
Green lines - Long Envelopes.
Red lines - Short Envelopes.
Orange line - MA for closing of Short positions.
Lime line - MA for closing of Long positions.
**************************************************************************************************************************************************************************************************************
Опубликованный исходный код регулируется Условиями Стандартной Общественной Лицензии GNU Affero v3.0
Этот скрипт описывает и предоставляет функции бектеста для внутренней стратегии алгоритмического программного обеспечения "HatiKO bot".
Подходит для тестирования любой криптовалютной пары на любой бирже/платформе, на любом таймфрейме.
Кор-механика этой стратегии основана на теории всегда возвращающейся к значению МА цены с использованием индикатора Envelopes (Moving_average_envelope from Wiki)
Разработка этого скрипта и программного обеспечения для торговли вдохновлена следующими источниками:
Книга "Essential Technical Analysis: Tools and Techniques to Spot Market Trends" Ли Стивенса (опубликовано 12 апреля 2002 года)
«Moving Average Envelopes» от ChartSchool, платформа StockCharts (опубликовано 13 апреля 2015 года или раньше)
«Коля Колеснік» с канала Crypto Times («Метод сетка», опубликовано 19 августа 2018 года)
«3 ways to use Moving Average Envelopes» Рича Фиттона, опубликованные в «Trader's Nest» (опубликовано 28 ноября 2018 года или раньше)
Скрипт стратегии noro "Robot WhiteBox ShiftMA" v1, опубликованный на платформе TradingView(опубликовано 29 августа 2018 года)
«Moving Average Envelopes: A Popular Trading Tool», статья Investopedia (опубликовано 25 июня 2019 года)
Блог KROOL1980 из Argolabs («Гридерство или Сетка как источник прибыли на форекс», опубликовано 27 февраля 2015 года)
Основные особенности:
1) До 4-х Ордеров в каждом из направлении (Лонг / Шорт)
2) Выбор из 6-ти разных базовых МА, опционально используйте разные МА для открытия и закрытия.
3) Используйте разные таймфреймы для расчета MA, без перерисовки и "эффекта стеклянного шара".
4) Фиксированный размер ордера, а не стратегия Мартингейла
5) Возможность закрытия открытой позиции заблаговременно, используя параметр Deviation
6) Код реализован на PineScript v4
Описание параметров:
Lot - % от вашего первоначального баланса, используется при расчете размера Ордера
Timeframe Short - таймфрейм, используемый для расчета МА Открытия Шорт позиций, может быть выбран из списка, по умолчанию - таймфрейм текущего графика
MA Type Short - тип MA, используемый для расчета МА Открытия Шорт позиций, может быть выбран из списка, по умолчанию SMA
Data Short - источник цены для расчета МА Открытия Шорт позиций, может быть выбран из списка, по умолчанию OHLC4
MA Length Short - период, используемый для расчета МА Открытия Шорт позиций, должен быть >= 1, по умолчанию 3
MA Offset Short - смещение значения MA, используемого для расчета Шорт Ордеров, должно быть >= 0, по умолчанию 0
Timeframe Long - таймфрейм, используемый для расчета МА Открытия Лонг позиций, может быть выбран из списка, по умолчанию - таймфрейм текущего графика
MA Type Long - тип MA, используемый для расчета МА Открытия Лонг позиций, может быть выбран из списка, по умолчанию SMA
Data Long - источник цены для расчета МА Открытия Лонг позиций, может быть выбран из списка, по умолчанию OHLC4
MA Length Long - период, используемый для расчета МА Открытия Лонг позиций, должен быть >= 1, по умолчанию 3
MA Offset Long - смещение значения MA, используемого для расчета Лонг Ордеров, должно быть >= 0, по умолчанию 0
Mode close MA Short - Включает отдельное MA для закрытия Шорт позиции, по умолчанию «false». Если false, MA Закрытия = MA Открытия
Timeframe Short Close - таймфрейм, используемый для расчета МА Закрытия Шорт позиций, может быть выбран из списка, по умолчанию - таймфрейм текущего графика
MA Type Close Short - тип MA, используемый при расчете МА Закрытия Шорт позиции. Mожно выбрать из списка, по умолчанию SMA
Data Short Close - источник цены для расчета МА Закрытия Шорт позиций, может быть выбран из списка, по умолчанию OHLC4
MA Length Short Close - период, используемый для расчета МА Закрытия Шорт позиции, должен быть >= 1, по умолчанию 3
Short Deviation - % отклонения от значения MA, используется для закрытия позиции выше или ниже рассчитанного значения MA, может быть отрицательным, по умолчанию 0
MA Offset Short Close - смещение значения MA, используемого для расчета закрытия Шорт позиции, должно быть >= 0, по умолчанию 0
Mode close MA Long - Включает разные MA для закрытия Лонг позиции, по умолчанию «false». Если false, MA Закрытия = MA Открытия
Timeframe Long Close - таймфрейм, используемый для расчета МА Закрытия Лонг позиций, может быть выбран из списка, по умолчанию - таймфрейм текущего графика
MA Type Close Long - тип MA, используемый при расчете МА Закрытия Лонг позиции. Mожно выбрать из списка, по умолчанию SMA
Data Long Close - источник цены для расчета МА Закрытия Лонг позиций, может быть выбран из списка, по умолчанию OHLC4
MA Length Long Close - период, используемый для расчета МА Закрытия Лонг позиции, должен быть >= 1, по умолчанию 3
Long Deviation -% для перехода от значения MA, используется для закрытия позиции выше или ниже рассчитанного значения MA, может быть отрицательным, по умолчанию 0
MA Offset Long Close - смещение значения MA, используемого для расчета закрытия Лонг позиции, должно быть >= 0, по умолчанию 0
Short Shift 1..4 - % от значения MA для размещения Ордеров, для Шорт Ордеров должен быть положительным, чем выше номер, тем выше должна располагаться позиция Shift, например: «Shift 1 = 1, Shift 2 = 2 и т.д. "
Long Shift 1..4 - % от значения MA для размещения Ордеров, для Лонг Ордеров должно быть отрицательным, чем ниже число, тем ниже должна располагаться позиция Shift, например: «Shift 1 = -1, Shift 2 = -2, и т.д."
From Year 20XX - Год начала тестирования, из-за ориентированности на криптовалюты поддерживаются только значения формата 20хх.
To Year 20XX - Год окончания тестирования, из-за ориентированности на криптовалюты поддерживаются только значения формата 20хх.
From Month - Начальный месяц, опционально, менять не рекомендуется
To Month - Конечный месяц, опционально, менять не рекомендуется
From day - Начальный день месяца, опционально, менять не рекомендуется
To day - Конечный день месяца, опционально, менять не рекомендуется
Пояснения к графику:
Зеленые линии - Лонг Ордера.
Красные линии - Шорт Ордера.
Оранжевая линия - MA Закрытия Шорт позиций.
Лаймовая линия - MA Закрытия Лонг позиций.

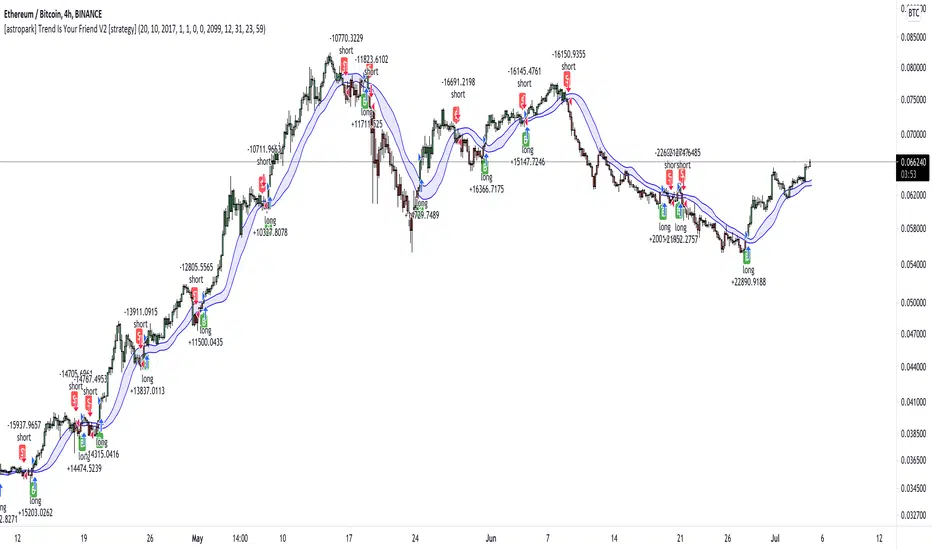
[astropark] Trend Is Your Friend V2 [strategy]Dear Followers,
today another awesome Swing and Scalping Trading Strategy indicator, runnable on a bot , which works great on High Timeframes (1D is suggested) but also on lower ones (just write me in order to help you find correct settings) and even better on 1m Renko chart!
If you are a scalper, you will love suggested entries for fast profit. You can run it on 1h timeframe (below is not suggested, there is "no-trend" below 1h!) if you are used to scalp trading and close each trade whenever you feel happy (a proper trailing stop strategy is suggested anyway).
This is a twin sister or the "Trend Is Your Friend V1" indicator you can see here below
This strategy differs for the engine used as basis, but has the same usage settings:
enable/disable signals on chart
enable/disable showing trend cloud
enable/disable bar coloring based on trend
enable/disable background coloring based on trend
edit trend period length (you have to increase it if you go on lower timeframes or you go on FOREX/Stocks market, direct message me in order to help you fine best settings)
This strategy only trigger 1 buy or 1 sell. In order to get notified when a signal is triggered, you need to use the "alarms" version of this indicator.
Strategy results are calculated on the timeframe from January 2015 to now, so on 5 years, using 10000$ as initial capital and working at 1x leverage (so no leverage at all! If you like to use leverage, be sure to use a safe option, like 3x or 5x at most in order to have liquidation price very far).
This is not the "Holy Grail", so use a proper risk management strategy.
This script will let you backtest how the indicator will perform on any chart you may test. Of course results will be very different depending on the chart and timeframe you will open. I tested a lot of charts and always you can find a combination that keep this strategy in profit on swing trading style (and this means that if you can have a daily look at the chart you can always manage to maximize your profit on each trade!)
The alarms version of this indicator, which will let you set all notifications you may need in order to be alerted on each triggered signals, can be found by searching for the astropark's "trend is your friend v2" and then choosing the indicator with "alarms" suffix in the name.
This is a premium indicator , so send me a private message in order to get access to this script.
[astropark] Trend Is Your Friend V1 [strategy]Dear Followers,
today another awesome Swing and Scalping Trading Strategy indicator, runnable on a bot , which works great on High Timeframes (1D is suggested) but also on lower ones (just write me in order to help you find correct settings) and even better on 1m Renko chart!
If you are a scalper, you will love suggested entries for fast profit. You can run it on 1h timeframe (below is not suggested, there is "no-trend" below 1h!) if you are used to scalp trading and close each trade whenever you feel happy (a proper trailing stop strategy is suggested anyway).
This strategy let's you edit following settings:
enable/disable signals on chart
enable/disable showing trend cloud
enable/disable bar coloring based on trend
enable/disable background coloring based on trend
enable a special option to enhance trend cloud on FOREX/Stocks charts (optional)
edit trend period length (you have to increase it if you go on lower timeframes, like 1h)
This strategy only trigger 1 buy or 1 sell. In order to get notified when a signal is triggered, you need to use the "alarms" version of this indicator.
Strategy results are calculated on the timeframe from August 2017 to now, so on almost 2 years and half, using 10000$ as initial capital and working at 1x leverage (so no leverage at all! If you like to use leverage, be sure to use a safe option, like 3x or 5x at most in order to have liquidation price very far).
This is not the "Holy Grail", so use a proper risk management strategy.
This script will let you backtest how the indicator will perform on any chart you may test. Of course results will be very different depending on the chart and timeframe you will open. I tested a lot of charts and always you can find a combination that keep this strategy in profit on swing trading style (and this means that if you can have a daily look at the chart you can always manage to maximize your profit on each trade!)
The alarms version of this indicator, which will let you set all notifications you may need in order to be alerted on each triggered signals, can be found by searching for the astropark's "trend is your friend" and then choosing the indicator with "alarms" suffix in the name.
This is a premium indicator , so send me a private message in order to get access to this script.
