POWER INDICATOR - PRO PREMIUM by OeZKAN 👑 POWER INDICATOR PRO PREMIUM V24: Predictive Intelligence Meets Precision ExecutionThe POWER INDICATOR PRO PREMIUM V24 is the pinnacle of algorithmic trading intelligence. This system transcends traditional indicators by utilizing a sophisticated framework of advanced mathematical equations to predict the impending trend direction before the market moves. It combines Smart Money Concepts (SMC), Multi-Timeframe (MTF) convergence, and Dynamic Risk Management to deliver unparalleled clarity and execution confidence.If you seek a trading partner that provides leading, predictive signals and high-probability entries, this system is your definitive solution.🧠 The Core Element: Predictive Market Context & Directional ForecastThe foundational strength of the POWER INDICATOR is its ability to forecast the market's bias through advanced quantification:🚀 Directional Pre-Cognition (LRC & Mathematical Models):The system utilizes the Linear Regression Curve (LRC) and proprietary statistical models as its core mathematical engine. This process extrapolates the probable trend path and generates a Directional Forecast for the coming bars, enabling you to anticipate moves rather than react to them. This forecast serves as the ultimate bias filter.🧠 The Convictional Filter: Quantifying Probability ($60\%$ Confidence):This filter is our proprietary Probability Brain. It eliminates market noise by forcing convergence across multiple high-level factors (MTF agreement, Momentum, SMC levels).High-Conviction Threshold: Independent analysis confirms that the Conviction Filter provides an exceptionally high win rate and signal quality starting at just $60\%$. Setting your threshold at this level ensures you only consider trades where the predictive mathematical components are in strong alignment.🌊 FVG & GP Predictive Zones:The system automatically identifies and projects critical Fair Value Gaps (FVG/LSOB) and the Golden Pocket (GP) Re-Test Zone. These zones are algorithmically identified as high-probability targets for pullbacks and reversals, providing a clear map of where liquidity will be sought.💡 The Convictional Trading Workflow: A 3-Step Guide to ExecutionContext Check: Confirm the LRC Directional Forecast aligns with your trade and the Conviction Score Meter is above your desired threshold (minimum $60\%$).Optimal Entry: Wait for the signal to trigger at a high-R:R entry point (GP, FVG, or Aggressive Impulse), guided by your chosen trading mode.Dynamic Management: Let the system handle risk, utilizing Structural SL and automatic Multi-Method Trailing Stops post-TP1.🎯 Mode Selection: Matching Strategy to MarketThe indicator's power lies in its Modularity. Selecting the correct mode is crucial for optimizing your results.Trading StyleRecommended ModesPrimary Rationale & Entry LogicHigh-Frequency ScalpingCT Scalp-OnlyDesigned for counter-trend entries in a pullback towards the Golden Pocket (GP). Uses tighter SL/TP multipliers for quick profit-taking. (Fast, high-R:R)ATR Channel Scalp (ACS)Utilizes volatility channels (ATR bands) for quick mean-reversion trades when price overextends.Strategic Day Trading / Swing TradingUltimate Fusion Mode (UFM)The highest probability mode. Best for catching major shifts confirmed by SMC (LRC, GP, FVG, MSS). Waits for a deep, high-R:R Re-Test Entry.Haupttrend & Scalp (Kombi)Excellent general-purpose mode. Focuses on trend continuation but allows for high-R:R pullback entries at key levels (GP/FVG). (Balanced)FVG Mitigation Entry (FME)Ideal for SMC traders. Waits for the price to precisely re-test and mitigate an unmitigated Fair Value Gap (FVG) or Liquidity Sweep (LSOB) zone before entry.Breakout & Momentum TradingBand Breakout-OnlyTriggers an entry only when price decisively breaks outside the SMA Volatility Bands (configurable). Filtered by momentum requirements.Dynamic Range Expansion (DRE)Specifically detects low-volatility consolidation before an anticipated high-momentum expansion phase.🔔 The Master Alert System: Your Execution EdgeThe powerful Alert functionality ensures you can monitor multiple assets and timeframes without being glued to the screen.1. ✅ Dynamic MASTER ALARM (Compact Text)The core alert uses a compact, dynamic JSON/text message that contains all necessary information for quick execution:Action: BUY / SELLMode Used: Conviction Score: Key Level: 2. LRC/GP Combo-Alert (High-R:R)This is the most valuable alert for strategic traders. It triggers only when the LRC direction is confirmed and the price enters the Golden Pocket (GP) Re-Test Zone, indicating an optimal high-R:R pullback opportunity.Final Note: To maximize the predictive power, ensure the useConvictionFilter is set to a minimum of $60\%$ and the useStructureSL is activated to protect your capital with intelligent stop placement.Stop reacting. Start predicting. Activate the POWER INDICATOR PRO PREMIUM V24 and lead the market today!
Dashboard

Symbol Magnifier & MTF Clock# Symbol Magnifier & MTF Clock
Shows your symbol, price, and countdown timers for multiple timeframes on one chart.
## What It Does
**Symbol Display:**
- Big, easy-to-read symbol and price
- Shows time left until current candle closes
- Green for bullish, red for bearish
- Put it anywhere on your chart
**Multi-Timeframe Clock:**
- Track up to 6 timeframes at once: D1, H4, H1, M30, M15, M5
- See exactly when each candle will close
- Turns orange/red in the last 5 minutes as a warning
- Choose which timeframes to show
## Why Use It?
Never miss important candle closes across multiple timeframes. Perfect if you trade using multiple timeframe analysis or need to time your entries better.
## Settings
- Move displays to any corner
- Change text size
- Pick your colors
- Show only the timeframes you care about
That's it. Simple timing tool for multi-timeframe traders.

Pair Correlation Master [Macro]The Main Idea
Trading represents a constant battle between Systemic Flows (the whole market moving together) and Idiosyncratic Moves (one specific asset moving on its own).
This tool allows you to monitor a "basket" of 4 assets simultaneously (e.g., the major USD pairs). It answers the most important question in forex and multi-asset trading: "Is this move happening because the Dollar is weak, or because the Euro is strong?"
It separates the "Signal" (the unique move) from the "Noise" (the herd movement).
1. The Chart Lines: The "Race" (Macro Trend)
Think of the lines on your chart as a long-distance race. They visualize the performance of all 4 assets over the last 200 candles (adjustable).
- Bunched Together: If all lines are moving in the same direction, the market is highly correlated. (e.g., "The Dollar is selling off everywhere").
- Fanning Out: If the lines are spreading apart, specific currencies are outperforming others.
- The Zero Line: This is the starting line.
--- Above 0: The pair is in a macro uptrend.
--- Below 0: The pair is in a macro downtrend.
2. The Dashboard: The "Health Check" (Micro Data)
The table in the top right gives you the immediate statistics for right now.
- A. The Z-Score (The Rubber Band)
This measures how "stretched" price is compared to its normal behavior.
- White (< 2.0): Normal trading activity.
- Orange (> 2.0): The price is stretching. Warning sign.
- Red (> 3.0): Critical Stretch. The rubber band is pulled to its limit. Statistically, a pullback or pause is highly likely.
B. The Star (★)
The script automatically calculates the average behavior of your group. If one asset is behaving completely differently from the rest, it marks it with a Star (★).
- Example: EURUSD, GBPUSD, and NZDUSD are flat, but AUDUSD is rallying hard. AUDUSD gets the ★. This is where the unique opportunity lies.
🎯 Best Uses: 4H & Daily Timeframes
This indicator is tuned for "Macro" analysis. It works best on the "4-Hour" and "Daily" charts to filter out intraday noise and capture swing trading moves.
- Strategy 1: The "Rubber Band" Snap (Mean Reversion)
- Setup: Look for a Z-Score in the RED (> 3.0) on the Daily timeframe.
- Action: This indicates an unsustainable move. Look for reversals or exhaustion patterns to trade against the trend back toward the mean.
- Strategy 2: The "Lone Wolf" (Trend Following)
- Setup: Look for the asset with the Star (★).
- Action: If the whole basket is flat (Balanced), but the Star asset is breaking out, that creates a high-quality trend trade because that specific currency has its own catalyst (News/Earnings).
- Strategy 3: Systemic Flows (Basket Trading)
- Setup: The dashboard footer says "⚠️ SYSTEMIC MOVE."
- Action: This means everything is moving together (e.g., a massive USD crash). Don't look for unique setups; just join the trend on the strongest pair.
Dashboard Footer Key
The bottom of the table summarizes the current state of the market for you:
- Balanced / Rangebound: The market is quiet. Good for range trading.
- Focus: : Trade this specific pair. It is moving independently.
- Systemic Move: The whole basket is moving violently. Trade the momentum.
p.s. Suggestion - apply and use on the chart rather than an oscillator.

(QUANTLABS) Fractal God Mode: 25-Timeframe Scanner The indicator aggregates data into three distinct metric columns:
1. STRUCT (Market Structure) This analyzes price action relative to Fractal Pivots (Highs and Lows) to determine market direction.
HH (Breakout): Price has closed above the previous Pivot High. (Bullish Structure)
LL (Breakdown): Price has closed below the previous Pivot Low. (Bearish Structure)
TRAPPED: Price is trading between the last Pivot High and Low. This indicates a ranging market where trend trades should be avoided.
2. VELOCITY (Thrust) This measures the specific strength of the current candle on that timeframe.
The Math: It calculates the ratio of the body (Close - Open) relative to the total candle range (High - Low).
The Signal: High positive numbers (Green) indicate buyers are closing near highs. High negative numbers (Red) indicate sellers are dominating the range.
3. QUALITY (Efficiency Ratio) This acts as a "Noise Filter." It determines if the trend is moving in a straight line or whipping back and forth.
The Math: It divides the Net Price Movement (Distance from 5 bars ago) by the Total Path Traveled (Sum of the ranges of the last 5 bars).
PRISTINE (Values > 0.6): The market is moving efficiently in one direction.
CHOPPY (Values < 0.4): The market is volatile and non-directional (High Noise).
1. The Matrix (Dashboard) Located in the bottom right, this table gives you an instant read on Short-Term (3m-9m), Medium-Term (10m-45m), and Long-Term (1H-Daily) trends.
2. Coherence Flow At the bottom of the table, the script sums up the structural score of all 25 timeframes.
COHERENT BULL: When the Short, Medium, and Long terms align green.
COHERENT BEAR: When the Short, Medium, and Long terms align red.
3. God Mode (Global S/R) The indicator can plot Support and Resistance levels from higher timeframes onto your current chart. For example, while trading the 5m chart, you can see the 4H and Daily pivot levels plotted automatically as dotted lines, ensuring you never trade blindly into a higher-timeframe wall.
Trend Following: Wait for the "Coherent Bull/Bear" signal at the bottom of the dashboard. This confirms that momentum is aligned from the 3m chart up to the Daily.
Scalping: Focus on the Quality column. Only take trades when the Quality is "CLEAN" or "PRISTINE." Avoid entries when the dashboard warns of "High Noise" (Choppy).
Risk Management: If the dashboard shows "TRAPPED" on the Long Term (1H+), reduce position size or wait for a breakout.
Pivot Lookback: Adjusts the sensitivity of the Fractal Structure (Default: 5).
Show Fractal DNA Matrix: Toggles the dashboard table.
Show ALL Timeframe S/R: Enables "God Mode" to see supports/resistances from all 25 timeframes (Heavy visual processing, use carefully).

MarketCap & SectorThis indicator shows a quick fundamental snapshot for the current stock directly on the chart. It displays:
- Market Cap in ₹ crores (for example: 4,609.11 Cr)
- Market‑cap category based on size (Large‑cap, Mid‑cap, Small‑cap, or Micro‑cap)
- Sector and Industry of the company
- 1‑month average daily volume in a compact format (for example: 10.5M)
Use it to instantly see how big the company is, what segment of the market it belongs to, and how actively it trades, without opening any extra info panels or websites.

Regime Filter [BigBeluga]🔵 OVERVIEW
Regime Filter is a dual-factor trend condition tool combining price trend momentum and volume expansion into a single, easy-to-read visual framework. It quantifies recent trend direction and volume shifts, then shows them as:
Two oscillator plots for Trend and Volume regimes
Dynamic candle coloring for trend clarity
A quadrant scatter map in your chart corner for immediate regime recognition.
This filter helps traders quickly detect when a trend is healthy & confirmed by strong volume, or weakening & vulnerable due to low volume.
🔵 CONCEPTS
Trend Oscillator: A loop-based trend value calculated by comparing the current smoothed price (HMA of HLC3) against its own trailing history. Positive values indicate trend-up regimes, negative values signal trend-down phases.
Volume Oscillator: Similar loop logic but on smoothed volume (HMA of Volume) — highlighting whether trading activity is expanding or contracting relative to past bars.
hma = ta.hma(hlc3, 15)
vol = ta.hma(volume, 15)
for i = 0 to len
if hma > hma
trend += 1
else
trend -= 1
for i = 0 to len
if vol > vol
voltrend += 1
else
voltrend -= 1
Regime Map Scatter Plot: A unique 2D quadrant displayed in the bottom-right corner. This shows where the market is sitting:
> Top Right (green): Trend ↑ and Volume ↑ → strong confirmed up trend.
> Top Left (red): Trend ↓ but Volume ↑ → strong sell momentum.
> Bottom Right (blue): Trend ↑ but Volume ↓ → uptrend losing steam.
> Bottom Left (yellow): Trend ↓ and Volume ↓ → weak bearish drift.
Dynamic Candle Coloring: Candles are colored by trend only: green for uptrends, red for downtrends, and orange near reversals.
Threshold Fills: The oscillator region is shaded green above +10 (healthy uptrend) and red below -10 (strong downtrend) for instant confidence.
🔵 FEATURES
Normalized trend and volume values adapt automatically to your lookback length.
Candlestick color overrides highlight current trend state in real-time.
Clear zero-line and fill bands help you gauge strength vs. noise.
Scatter regime dashboard updates live to track when trend and volume align or decouple.
Color gradients show intensification or cooling in both oscillators and the regime map.
🔵 HOW TO USE
Look for sustained positive trend and volume values to confirm strong directional moves.
Watch for the scatter dot in the green square (top right) for high-confidence breakouts.
If the dot drops to bottom right, uptrend may be tiring — possible exit zone.
If the dot jumps top left, bearish drive is reinforced by heavy volume — caution on longs.
Use the orange trend coloring as an early warning that trend pressure may be shifting.
Combine with breakout levels or moving averages for a robust regime filter system.
🔵 CONCLUSION
The Regime Filter distills price trend and volume dynamics into an actionable multi-mode display: oscillators, color-coded candles, and an intuitive scatter map. This all-in-one layout helps traders visually read market regime strength and spot fading trends before they turn — perfect for swing traders, intraday scalpers, and macro trend followers alike.

Vantage-X (2.0)Vantage-X (2.0) — The Clean-Chart Trading Dashboard
Vantage-X (2.0) is a next-generation, all-in-one chart optimization dashboard designed for traders who want clarity, precision, and zero clutter. Whether you scalp, day trade, or swing trade, this indicator removes the noise and gives you the exact market signals that matter, all from one clean, minimal interface.
Built for traders who are tired of overcrowded charts filled with lines, clouds, bands, and unnecessary indicators, Vantage-X (2.0) brings everything together into a powerful visual dashboard — so you can focus on price action, not distraction.
⸻
🔹 What’s New in Version 2.0
Vantage-X (2.0) adds several high-value trend-tracking systems to improve timing, confirmation, and momentum detection:
• EMA 50 / EMA 200 Cross
A classic long-term momentum and directional bias filter.
Perfect for identifying macro trend shifts or avoiding trades against the dominant trend.
• EMA 20 / EMA 50 Cross
A medium-term trend confirmation system used by professional intraday traders to time pullbacks, continuations, and structure-based setups.
• EMA 5 / EMA 13 Cross
A fast-reaction signal for sudden bursts of volatility.
Ideal for scalpers catching early momentum, breakouts, retests, and reversal flips.
All three systems come with full toggles, so you can enable or disable any layer depending on your style.
All three EMA Crosses work on the current timeframe you are looking at.
⸻
🔹 Core Purpose
The purpose of Vantage-X is simple:
Give traders a clean, powerful dashboard that replaces multiple indicators — without ever touching the price chart.
No more overlapping lines.
No more stacked indicators taking up screen space.
No more analysis paralysis.
Just fast, easy, intuitive signals displayed in a compact table so you can instantly read the market’s story.
⸻
🔹 Features
✔ Ultra-clean dashboard layout (does not clutter your chart)
✔ Trend direction & EMA cross signals
✔ Color-coded bias detection (bullish, bearish, neutral)
✔ Adjustable toggle system for full customization
✔ Works on all markets & timeframes
✔ Designed for scalpers, day traders, and swing traders
✔ Perfect for traders who rely on price action but still want smart confirmation
⸻
🔹 Why Traders Love It
Vantage-X is built for the modern trader — the type who values simplicity, clarity, and speed. Every feature in this dashboard is made to:
• Reduce hesitation
• Improve timing
• Simplify decision-making
• Keep charts visually clean
• Remove emotional noise
• Increase confidence in entries and exits
If you want a chart that stays clean but still gives high-precision market signals, Vantage-X is built for you.
⸻
🔹 Free to Use — For the Trading Community
Vantage-X (2.0) is completely free.
No paywalls. No locked features.
This release is my contribution to traders who want a cleaner, more efficient way to interpret the market without relying on a dozen indicators layered on top of each other.
⸻
🔹 Final Notes
Vantage-X (2.0) is continuously evolving, and future versions will bring even more flexibility, signal refinement, and dashboard intelligence. Feedback is always welcomed — I want this to be one of the most useful and clean charting tools available on TradingView.
🔥 {COMING SOON: You will be able to set different timeframes for each EMA cross Signal. So if you are looking at 5min timeframe but you want to know 15min 20/50 EMA cross. You will be able to adjust that in settings. SO NO SWITCHING BACK AND FORTH BETWEEN DIFFERENT TIMEFRAME CHARTS!!} 🔥

Multi-Asset % Performance Table | v2.1 | TCP Multi-Asset % Performance Table | v2.1 | TCP
ESSENTIAL SUMMARY:
Multi-Asset % Performance Table eliminates the need to manually draw and manage individual "Price Range" tools for every asset. It automatically tracks up to 15 tickers independently in a single dashboard, calculating a TOTAL SCORE (Portfolio Average) for you. Unlike manual drawings, it supports a Global Range while allowing Custom Dates for specific assets, ensuring each ticker is calculated based on its own precise entry/exit. The Smart Visuals dynamically draw the correct date lines only for the ticker you are currently viewing, keeping your chart automatic, accurate, and clutter-free.
FUL DESCRIPTION:
📊 What is this tool?
The Multi-Asset % Performance Table is a powerful portfolio dashboard designed to track the percentage performance of up to 15 different assets simultaneously.
Instead of checking tickers one by one or manually drawing price ranges, this indicator aggregates everything into a single, clean table. It allows you to compare the ROI (Return on Investment) of a basket of coins or stocks over a specific time period and calculates an aggregate TOTAL SCORE (Average %) for your selection.
🚀 Key Features
15 Asset Slots: Monitor up to 15 different tickers (Crypto, Stocks, Forex, etc.) in one view.
Global vs. Custom Dates: Set a "Global" start/end date for the whole portfolio, but override specific assets with Custom Dates if they entered the portfolio at a different time.
Smart Visuals: Automatically draws vertical dashed lines on your chart representing the start and end dates of the ticker you are currently viewing.
Total Score Calculation: Calculates the average percentage change of your portfolio. You can dynamically include or exclude specific assets from this average using the settings.
Status Column: A quick visual reference (✔ or ✘) in the table showing which assets are currently included in the Total Score calculation.
⚙️ How it Works
Data Fetching: The script pulls "Close" prices from the Daily timeframe to ensure accuracy across long periods.
Smart Matching: The visual lines automatically detect which asset you are viewing. For example, if you are looking at BTCUSDT and have custom dates set for it, the vertical lines will jump to those specific dates. If you view a ticker not in your list, it defaults to the Global dates.
Visual Protection: The script uses advanced logic to ensure only one set of range lines appears on the chart at a time, keeping your workspace clean.
🛠️ Instructions & Settings
1. Setting up your Assets
Open the Settings (Cogwheel icon).
Under ASSET 1 through ASSET 15, enter the tickers you want to track (e.g., BINANCE:BTCUSDT).
Include in Avg?: Uncheck this if you want to see the asset in the table but exclude it from the "TOTAL SCORE" average.
2. Defining Time Ranges
Global Settings: Set the Global Start and Global End dates at the top. This applies to all assets by default.
Custom Dates: If a specific asset (e.g., Asset 4) was bought on a different day, check the "Custom Dates?" box for that asset and enter its specific Start/End time.
3. Reading the Table
The table appears on the chart (default: Bottom Right) with three columns:
Asset: The name of the ticker.
% Change: The percentage move from Start Date to End Date. (Green = Positive, Red = Negative).
Inc: Shows a ✔ if the asset is included in the Total Score average, or a ✘ if excluded.
4. The Visual Lines
Two vertical dashed lines will appear on your chart.
Note: These lines are visual references only. You cannot drag them to change the dates. To change the dates, you must use the Settings menu.
💡 Tips
Hover for Details: Hover your mouse over the % Change value in the table to see a tooltip showing the exact Start Price and End Price used for the calculation.
Resolution: The script defaults to 1 Day resolution for optimal accuracy on historical data.
v2.1 | TCP - Custom Built for Precision Performance Tracking

MTF Checklist DashboardMTF Checklist Dashboard
Overview
The MTF Checklist Dashboard is an advanced multi-timeframe analysis tool that provides traders with a comprehensive visual dashboard to analyze market conditions across six customizable timeframes simultaneously. This indicator combines multiple technical analysis methods, including Opening Range Breakouts (ORB), VWAP, EMAs, and daily price levels, to generate high-probability confluence-based trading signals.
Unlike traditional single-timeframe indicators, this dashboard displays all critical information in one organized table, allowing traders to instantly identify when multiple timeframes align for optimal entry and exit opportunities.
Key Features
Multi-Timeframe Analysis
Analyzes up to 6 timeframes simultaneously (default: 1m, 5m, 15m, 30m, 1h, 4h)
Fully customizable timeframe selection via comma-separated input
Color-coded cells for instant visual recognition (green=bullish, red=bearish, yellow=neutral)
Technical Indicators Tracked
Current and previous candle direction
Opening Range Breakout (ORB) positioning with custom period
VWAP relationship (above/below)
200 EMA positioning
Daily and previous day high/low proximity
EMA crossovers (9 vs 21, both vs 200)
Advanced Signal Filtering System
Confluence scoring: Requires multiple timeframes to align (3-6 timeframes)
Higher timeframe confirmation: Ensures 30m/1h/4h agreement
Volume filter: Confirms signals with above-average volume (1.5x default)
ATR volatility filter: Validates sufficient market movement
Session timing: Restricts signals to optimal trading hours (EST)
Momentum confirmation: Requires recent directional strength
Range positioning: Blocks signals near daily extremes
Candle strength: Validates strong directional candles (60%+ body ratio)
Visual Signals
Optional entry arrows (above/below bars)
Background color highlighting
Organized dashboard with real-time price levels
ORB range, current day, and previous day summary rows
Alert Conditions
JSON-formatted alerts for automated trading integration
Separate alerts for long entry, short entry, long exit, and short exit
Compatible with webhook automation systems
How To Use
Dashboard Interpretation
The dashboard displays a color-coded table with the following columns:
TF: Timeframe being analyzed
C: Current candle (Green=bullish, Red=bearish)
P: Previous candle (Green=bullish, Red=bearish)
ORB: Opening Range Breakout position (A=Above, B=Below, W=Within)
VWAP: Price vs VWAP (A=Above, B=Below)
E200: Price vs 200 EMA (A=Above, B=Below)
D Hi/Lo: Proximity to current day high/low (Hi/Lo/Mid)
PD Hi/Lo: Proximity to previous day high/low (Hi/Lo/Mid)
9 vs 21: EMA 9 vs EMA 21 relationship (A=9 above 21, B=9 below 21)
9&21 v200: Both EMAs vs 200 EMA (>>=both above, <<=both below, <>=mixed)
Signal Generation
Long Entry Signal triggers when:
Minimum number of timeframes show bullish alignment (default: 5 of 6)
Higher timeframes (30m/1h/4h) confirm direction (default: 2 of 3)
Price breaks above ORB high with sufficient distance
Volume exceeds average by specified multiplier
ATR shows adequate volatility
Trade occurs during optimal session hours
Recent momentum is upward
Price not too close to daily high
Strong bullish candle forms
Short Entry Signal uses opposite conditions
Exit Signals trigger when opposing timeframe confluence reaches threshold (default: 3 timeframes)
Recommended Workflow
Select your asset and primary trading timeframe
Observe the dashboard - Look for rows showing mostly green (bullish) or red (bearish)
Wait for alignment - The indicator will show arrows when confluence requirements are met
Check the bottom rows - Review ORB levels and daily ranges for context
Set alerts - Enable TradingView alerts using the built-in alert conditions
Manage risk - Use appropriate position sizing and stop losses based on ORB range or daily ATR
Settings Guide
Basic Settings
Timeframes: Enter comma-separated values (e.g., "1,5,15,30,60,240")
Show Header: Toggle column headers on/off
ORB Minutes: Set opening range period (default: 15 minutes)
Near % for daily highs/lows: Define proximity threshold (default: 0.20%)
Use close for comparisons: Compare using close vs current price
Dashboard Position: Choose from 9 screen positions
Confluence Filters
Minimum Timeframes Aligned: Set required confluence (3-6, default: 5)
Require Higher Timeframe Confirmation: Toggle HTF requirement on/off
Min Higher Timeframes: Specify HTF agreement needed (1-3, default: 2)
Volume Filter
Volume Confirmation: Enable/disable volume filtering
Volume vs Average: Set multiplier threshold (default: 1.5x)
Volume Average Length: Period for volume average (default: 20 bars)
Volatility Filter (ATR)
Volatility Filter: Enable/disable ATR confirmation
ATR Length: Calculation period (default: 14)
Min ATR vs Average: Required ATR level (default: 0.5x = 50%)
ORB Filters
ORB Breakout Distance Required: Toggle distance requirement
Min Breakout % Beyond ORB: Additional breakout threshold (default: 0.10%)
Session Filter
Trade Only During Best Hours: Enable time-based filtering
Session 1: First trading window (default: 0930-1130 EST)
Session 2: Second trading window (default: 1400-1530 EST)
Momentum Filter
Recent Momentum Required: Enable directional momentum check
Lookback Bars: Period for momentum comparison (default: 3 bars)
Daily Range Filter
Block Signals Near Daily Extremes: Prevent entries at extremes
Distance from High/Low %: Minimum distance required (default: 2.0%)
Candle Filter
Strong Directional Candle: Require candle strength
Min Candle Body %: Body-to-range ratio threshold (default: 60%)
Visual Signals
Show Entry Signals: Master toggle for visual signals
Show Arrows: Display entry arrows on chart
Background Color: Enable background highlighting
Best Practices
Start with default settings and adjust based on your trading style and asset volatility
Higher confluence requirements (5-6 timeframes) produce fewer but higher-quality signals
Enable all filters for conservative trading; disable some for more frequent signals
Use the dashboard as confirmation alongside your existing trading strategy
Backtest on your specific instruments before live trading
Consider market conditions—trending vs ranging markets may require different settings
Alerts
This indicator includes four alert conditions with JSON formatting for webhook integration:
Long Entry Signal: Triggers when all long conditions are met
Short Entry Signal: Triggers when all short conditions are met
Long Exit Signal: Triggers when opposing confluence reaches exit threshold
Short Exit Signal: Triggers when opposing confluence reaches exit threshold
Alert messages include ticker symbol, action (buy/sell), price, and quantity for automated trading systems.
Important Notes
This indicator works best on liquid instruments with clear price action
Highly volatile markets may require adjusted ATR and ORB distance settings
Session times are in EST timezone—adjust if trading non-US markets
The ORB calculation requires sufficient price history for the day
Signals are generated in real-time but should be confirmed at candle close
Limitations
Maximum of 6 timeframes can be analyzed due to TradingView's security call limits
ORB calculations may not work correctly on instruments with gaps or irregular sessions
The indicator is most effective during regular market hours when volume and volatility are adequate
Lower timeframes (1m, 5m) may produce more false signals in choppy conditions
License
Mozilla Public License 2.0 (MPL-2.0)
This indicator is licensed under the Mozilla Public License 2.0. You are free to use, modify, and distribute this code under the terms of the MPL-2.0. The full license text is available at mozilla.org
Key license provisions:
You may use this code commercially
You may modify and distribute modified versions
Modified versions must be released under the same license
You must include the original license notice in any distributions
No trademark rights are granted
Disclaimer
This indicator is provided for educational and informational purposes only. It is not financial advice, and past performance does not guarantee future results. Trading involves substantial risk of loss. Always:
Practice proper risk management
Test thoroughly on paper/demo accounts before live trading
Use appropriate position sizing
Never risk more than you can afford to lose
Consult with a financial advisor for personalized advice
The creator assumes no liability for trading losses incurred using this indicator.
Version: 2.0
Pine Script Version: v6
Author: © EliasVictor

Rons Custom WatermarkRon's Custom Watermark (RCW)
This is a lightweight, all-in-one watermark indicator that displays essential fundamental and technical data directly on your chart. It's designed to give you a quick, at-a-glance overview of any asset without cluttering your screen.
Features
The watermark displays the following information in a clean table:
* Company Info: Full Name & Market Cap (e.g., "AST SpaceMobile, Inc. (18.85B)")
* Symbol & Timeframe: Ticker and current chart period (e.g., "ASTS, 1D")
* Sector & Industry: The asset's classification.
* Technical Status (MA): Shows if the price is Above or Below the SMA (with a 🟢/🔴 emoji).
* Technical Status (EMA): Shows if the price is Above or Below the EMA (with a 🟢/🔴 emoji).
* Earnings: A countdown showing "X days remaining" until the next earnings report.
* (Optional) Volatility: The 14-day ATR value and its percentage of the current price.

Market Sessions [ApexFX]Unlock a clearer view of the market's 24-hour cycle with the Market Sessions indicator. This tool is designed to be clean, simple, and powerful, helping you track global market activity directly on your chart.
Core Features:
Four Pre-configured Sessions: Easily track the New York, London, Tokyo, and Sydney sessions. Each session is fully customizable, allowing you to change the name, time, and color.
Visual Session Ranges: The indicator automatically draws a colored box (or "range") highlighting the high and low of each active session, with a clear session name label on top.
Simple Timezone Control: Forget confusing GMT strings. A single integer input (e.g., -4 for NY, +1 for London) allows you to perfectly align the indicator with your local timezone or the exchange's time.
Dynamic Dashboard: Get an at-a-glance summary of all market sessions in a clean dashboard, locked to the top-right of your chart.
Live Market Status: The dashboard shows you:
Session: The custom name for each market, color-coded to match its range.
Status: See which markets are "Active" (green) or "Inactive" (red) in real-time.
Trend: A simple trend-following metric (based on a 50-SMA) for active sessions.
Volume: A basic volume average check (based on a 50-SMA) to gauge activity.
This indicator is perfect for traders who want to identify session overlaps, target specific market volatility, or simply understand the context of price action throughout the global trading day.

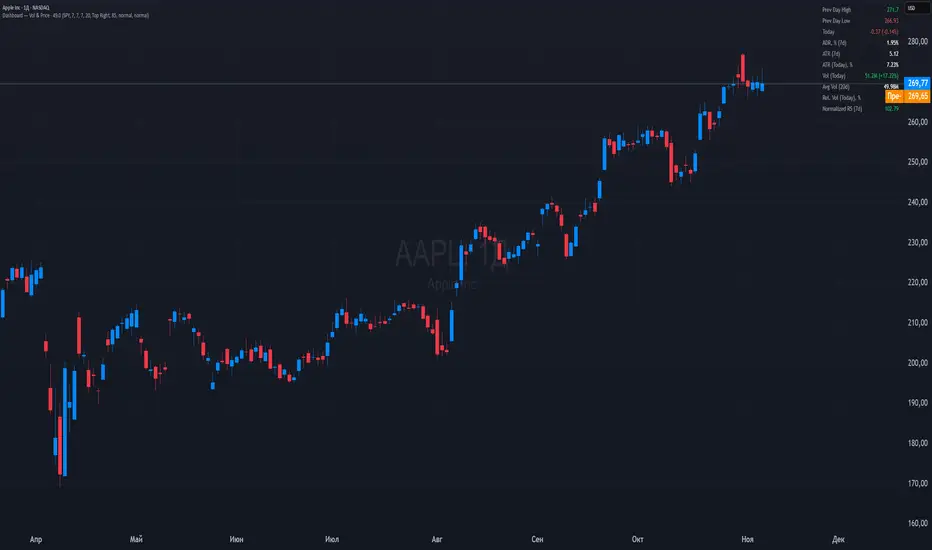
Dashboard — Vol & PriceDashboard for traders
Indicator Description
1. Prev Day High
What it shows: the previous trading day's high.
Why it shows: a resistance level. Many traders watch to see if the price will hold above or below this level. A breakout can signal buying strength.
2. Prev Day Low
What it shows: the previous day's low.
Why it shows: a support level. If the price breaks downwards, it signals weakness and a possible continuation of the decline.
3. Today
What it shows:
The difference between the current price and yesterday's close (in absolute values and as a percentage).
Color: green for an increase, red for a decrease.
Why it shows: immediately shows how strong a gap or movement is today relative to yesterday. This is an indicator of current momentum.
4. ADR, % (Average Daily Range)
What it shows: Average daily range (High – Low), expressed as a percentage of the closing price, for the selected period (default 7 days).
Why it's useful: To understand the "normal" volatility of an instrument. For example, if the ADR is 3%, then a 1% move is small, while a 6% move is very large.
5. ATR (Average True Range)
What it shows: Average fluctuation range (including gaps), in absolute points, for the specified period (default 7 days).
Why it's useful: A classic volatility indicator. Useful for setting stops, calculating position sizes, and identifying "noise" movements.
6. ATR (Today), %
What it shows: How much the current movement today (from yesterday's close to the current price) represents in % of the average ATR.
Why it shows: Shows whether the instrument has "played out" its average range. If the value is already >100%, there is a high probability that the movement will begin to slow.
7. Vol (Today)
What it shows:
Current trading volume for the day (in millions/billions).
Comparison with yesterday as a percentage (for example: 77.32M (-52.78%)).
Color: green if the volume is higher than yesterday; red if lower.
Why it shows:Quickly shows whether the market is active today. Volume = fuel for price movement.
8. Avg Vol (20d)
What it shows: Average daily volume over the last 20 trading days.
Why it's useful:"normal" activity level. It's a convenient backdrop for assessing today's turnover.
9. Rel. Vol (Today), % (Relative Volume)
What it shows: Deviation of the current volume from the average (20 days).
Formula: `(today / average - 1)` * 100`.
+30% = volume 30% above average, -40% = 40% below average.
Color: green for +, red for –.
Why it's useful:A key indicator for a trader. If RelVol > 100% (green), the market is "charged," and the movement is more significant. If low, activity is weak and movements are less reliable.
10. Normalized RS (Relative Strength)
What it shows: the relative strength of a stock to a selected benchmark (e.g., SPY), normalized by the period (default 7 days).
100 = same result as the market.
> 100 = the stock is stronger than the index.
<100 = weaker than the index.
Why it's needed: filtering ideas. Strong stocks rise faster when the market rises, weak stocks fall more sharply. This helps trade in the direction of the trend and select the best candidates.
In summary:
Prev High / Low — key support and resistance levels.
Today — an instant understanding of the current momentum.
ADR and ATR — volatility and potential movement.
ATR (Today) — how much the instrument has already "run."
Vol + Rel.Vol — activity and confirmation of the movement's strength.
RS — selecting strong/weak leaders against the market.
STWP Unified EMA Band (HLC Fusion – Crossover Enhanced Edition)🧠 STWP Unified EMA Band (HLC Fusion – Crossover Enhanced Edition)
Author: simpletradewithpatience (STWP)
Markets: Equities, Indices & Futures
Best Timeframes: 5-min to 1-hour (Daily TF optional for broader trend observation)
Built With: Pine Script v5
A structured, educational EMA fusion framework designed to help traders visually study trend transitions, slope behavior, and volume-based momentum shifts.
📌 Overview
The STWP Unified EMA Band merges High–Low–Close fusion logic with crossover detection and volume context to offer a clear visual understanding of trend behavior.
It is designed for traders who want to observe trend transitions, analyze momentum health, and study how volume supports or contradicts directional bias.
Internally, it uses an optimized EMA 9–21 fusion structure to identify directional shifts with precision and stability — a balance developed through the STWP methodology for consistent, unbiased trend evaluation.
This enhanced edition introduces a Crossover Engine for smoother transitions, adaptive band coloring, and a real-time educational dashboard that provides instant feedback on trend and volume strength.
📸 Chart Previews (Educational Examples)
1️⃣ Bullish Momentum Phase
🔗
📈 A bullish crossover where the fast EMA overtakes the slow EMA.
Observe the slope steepening and the dashboard confirming trend expansion.
2️⃣ Bearish Momentum Phase
🔗
📉 Displays a bearish crossover with slope weakening and band compression.
The dashboard highlights a transition to bearish bias with corresponding volume context.
⚠️ Snapshots are for educational reference only — not trading signals or recommendations.
📌 Key Features
✅ Dual EMA Band using High–Low–Close fusion logic
✅ Dynamic bullish/bearish band coloring
✅ Mid-band slope indicator with momentum feedback
✅ Volume strength classification (Strong / Moderate / Weak)
✅ Contextual crossover labels with real-time commentary
✅ Auto-removable exit labels for clean visualization
✅ Built-in educational STWP Dashboard (trend, slope, and volume insights)
✅ User-customizable color palette and toggles
✅ Compatible across intraday and swing setups
📊 STWP Dashboard Summary
A compact real-time data panel offering:
📈 Trend Status: Bullish / Bearish / Neutral
📊 Volume Condition: Strong / Moderate / Low
📉 Slope Direction: Rising / Falling / Flat
🕓 Last Signal Info: Timestamp, price, and strength context
The dashboard helps users learn how volume, slope, and structure interact dynamically during different market phases.
💡 Educational Use Cases
This tool is ideal for traders who want to:
Study momentum evolution through moving averages
Understand EMA slope and compression behavior
Observe how volume validates or contradicts trend strength
Build structured, observation-based learning habits
Develop discipline in recognizing trend exhaustion zones
It is meant as a visual study framework, not as a trading signal generator.
⚙️ Customization Options
Toggle crossover triangles and labels
Optional exit markers (auto-hide after signal)
Show or hide trend background shading
Customizable color settings for each phase
Enable or disable dashboard view
📆 Best Practice for Use
1️⃣ Apply to liquid assets or major indices for reliable band behavior.
2️⃣ Use primarily on 5-min to 1-hour charts to study intraday transitions clearly.
3️⃣ Optionally view on the Daily TF to understand higher-structure slope alignment and long-term trend health.
4️⃣ Observe how slope, band color, and volume interact during trend acceleration and contraction.
5️⃣ Treat dashboard readings as educational context, not trading triggers.
6️⃣ Combine with price structure, volume profile, or demand–supply zones for deeper observation.
⚠️ Important Notes
✅ Designed purely for learning and educational exploration
✅ No trading automation or signal generation included
✅ Does not provide entries, exits, or investment advice
✅ Built to promote structured observation and discipline in analysis
❌ Avoid using on higher timeframes for rapid setups — bands adjust slower there
📐 Glossary
EMA – Exponential Moving Average
HLC – High, Low, Close
Slope – Directional gradient of the mid-band
Volume Ratio – Current volume ÷ 20-bar average
Crossover – Fast EMA crossing Slow EMA
STWP – Simple Trade With Patience
💬 Philosophy Behind the Tool
Developed under the STWP methodology — Simple Trade With Patience — this indicator encourages traders to focus on learning the rhythm of the market, not chasing trades.
Every color, label, and slope change is designed to help users see what price action is communicating rather than predict outcomes.
⚠️ Disclaimer
This indicator is created solely for educational and informational purposes.
It does not constitute financial advice, a trading signal, or an investment recommendation.
Trading involves significant risk and may not be suitable for all participants.
Always consult a SEBI-registered financial advisor or licensed professional before making trading or investment decisions.
The author is not liable for financial loss resulting from the use or interpretation of this script.
By using this tool, you acknowledge and accept these terms.
🤝 Final Note
Built with precision and patience by simpletradewithpatience (STWP) — for traders who value structured learning and objective analysis.
Observe deeply. Learn continuously. Trade with discipline.
📈 Trade Less. Learn More. Let Patience Work for You.
🔒 Script Protection Note
This script is published under Protected visibility to maintain data integrity and prevent unauthorized modification.
The logic remains fully usable for all users while keeping the internal code structure secure — ensuring a safe, stable, and educational experience for everyone.

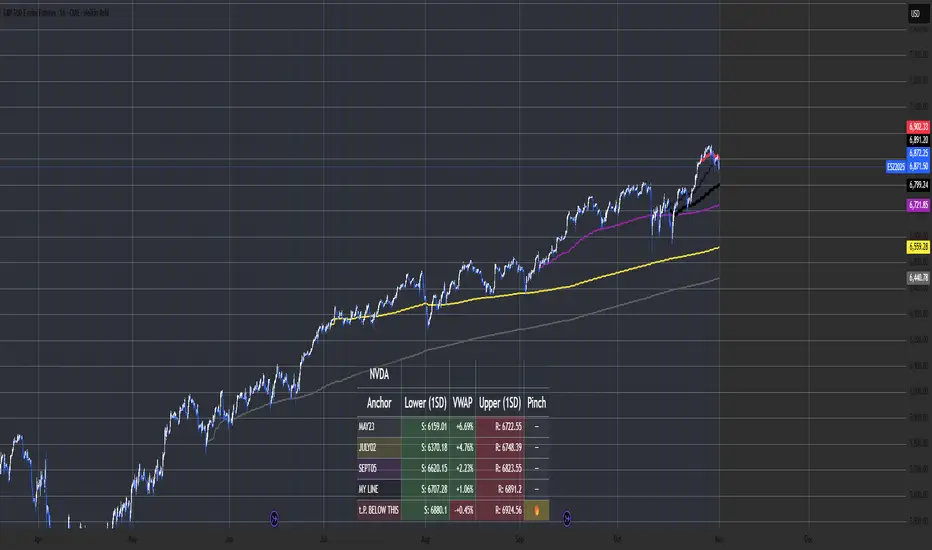
Multi-Anchor VWAP Deviation Dashboard Overview
Multi-Anchor VWAP Deviation Dashboard (Optimized Global) is an overlay indicator that computes up to five user-defined Anchored Volume Weighted Average Prices (AVWAPs) from custom timestamps, plotting their lines and displaying real-time percentage deviations from the current close. It enables precise analysis of price positioning relative to key events (e.g., earnings, news) or periods (e.g., weekly opens), with a compact dashboard for quick scans. Optimized for performance, it uses manual iterative calculations to handle dynamic anchor changes without repainting.
Core Mechanics
The indicator focuses on efficient AVWAP computation and deviation tracking:
Anchor Configuration: Five independent anchors, each with a name, UTC timestamp (e.g., "01 Oct 2025 00:00" for monthly open), show toggle, and color. Timestamps define the calculation start—e.g., AVWAP1 from "20 Oct 2025" onward.
AVWAP Calculation: For each enabled anchor, it identifies the first bar at/after the timestamp as the reset point, then iteratively accumulates (price * volume) / total volume from there. Uses HLC3 source (customizable); handles input changes by resetting sums on new anchors.
Deviation Metric: For each AVWAP, computes % deviation = ((close - AVWAP) / AVWAP) * 100—positive = above (potential resistance), negative = below (support).
Visuals: Plots lines (linewidth 1–2, user colors); dashboard (2 columns, 6 rows) shows names (anchor-colored if enabled) and deviations (green >0%, red <0%, gray N/A), positioned user-selectable with text sizing. Updates on last bar for efficiency.
This setup scales deviations across volatilities, aiding multi-period bias assessment.
Why This Adds Value & Originality
Standard VWAPs limit to session anchors (daily/weekly); deviation tools often lack multiples. This isn't a simple mashup: Manual iterative AVWAP (no built-in ta.vwap reliance) ensures dynamic resets on timestamp tweaks—e.g., shift "Event" to FOMC date without recalc lag. The 5-anchor flexibility (arbitrary UTC times) + centralized dashboard (colored deviations at a glance) creates a "global timeline scanner" unique to event-driven trading, unlike rigid multi-VWAP scripts. It streamlines what requires 5 separate indicators, with % normalization for cross-asset comparison (e.g., SPY vs. BTC).
How to Use
Setup: Overlay on chart. Configure anchors (e.g., Anchor1: "Weekly Open" at next Monday 00:00 UTC; enable/show 2–3 for focus). Set source (HLC3 default), position (Top Right), text size (Small).
Interpret Dashboard:
Left Column: Anchor names (e.g., "Monthly Open" in orange).
Right Column: Deviations (e.g., "+1.25%" green = above, bullish exhaustion?).
Scan for confluence (e.g., all >+2% = overbought).
Trading:
Lines: Price near AVWAP = mean reversion; breaks = momentum.
Example: -0.8% below "Event" anchor post-earnings → potential bounce buy.
Use on 1H–D; adjust timestamps via calendar.
Tips: Enable 1–3 anchors to avoid clutter; test on historical events.
Limitations & Disclaimer
AVWAPs reset on anchor bars, potentially lagging mid-period; deviations are % only (add ATR for absolute). Table updates on close (no intrabar). Timestamps must be UTC/future-proof. No alerts/exits—integrate manually. Not advice; backtest deviations on your assets. Past ≠ future. Comments for ideas.
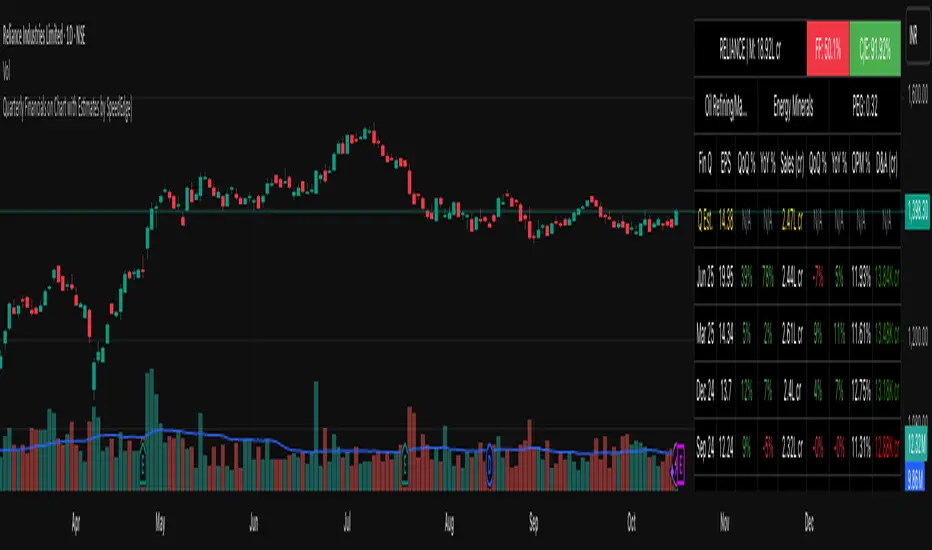
Quarterly Financials on Chart with Estimates by SpeedEdge)# Quarterly Financials on Chart with Estimates
## WHAT THIS SCRIPT DOES
This indicator displays comprehensive quarterly financial data directly on your trading chart, eliminating the need to switch between charting and fundamental analysis platforms. The script automatically fetches and organizes key financial metrics including earnings per share (EPS), revenue, operating margins, depreciation & amortization, and quarterly estimates alongside actual results for comparative analysis.
## WHY THIS COMBINATION IS ORIGINAL AND USEFUL
**The Problem Solved:** Traders conducting fundamental analysis typically need to toggle between trading charts and separate financial platforms to view quarterly results, estimates, and year-over-year comparisons. This workflow is inefficient and makes it difficult to correlate price movements with earnings announcements.
**The Solution:** This script integrates fundamental financial data directly into the price chart environment, providing:
- Side-by-side comparison of quarterly estimates versus actual results
- Automatic calculation of Quarter-over-Quarter (QoQ) and Year-over-Year (YoY) growth rates
- Color-coded visualization of financial performance trends
- Regional number formatting (Indian Crores or Global Billions/Millions)
- Key valuation metrics (Market Cap, Free Float, PEG Ratio, CFO/EBITDA) in header
**Unique Features:**
1. **Dual Number Format System**: Automatically formats financial figures in Indian Crores (Cr, K Cr, L Cr) or Global formats (M, B, T) based on user preference
2. **Estimate Integration**: Shows analyst estimates for upcoming quarters alongside historical actuals for beat/miss analysis
3. **Intelligent Growth Analysis**: Automatically calculates and color-codes quarterly and yearly growth comparisons with smart handling of missing data
4. **Context-Aware Color Coding**: Green/red visualization adapts based on metric type - growth metrics, cash flow quality indicators, and expense trends each use appropriate color logic
5. **Configurable History**: Display 4 to 20 previous quarters based on analysis needs
## HOW THE SCRIPT WORKS TECHNICALLY
### Core Methodology:
**1. Financial Data Integration:**
The script accesses quarterly and annual financial statement data from public company filings, including:
- **Earnings Estimates**: Analyst consensus forecasts for upcoming quarters
- **Quarterly Actuals**: Reported earnings per share, revenue, margins, and operating expenses
- **Key Ratios**: Shares outstanding data, valuation multiples, and cash flow metrics
All data is sourced from TradingView's fundamental database, which aggregates information from official regulatory filings (10-Q, 10-K, annual reports) filed by publicly traded companies.
**2. Historical Data Organization:**
The script employs a sophisticated data structure system that:
- Detects when new quarterly results are released by monitoring data changes
- Automatically indexes financial data by quarters relative to the current date
- Creates a chronological timeline of financial performance
- Maintains historical records for comparison calculations
- Updates dynamically as new earnings are reported
**3. Intelligent Number Formatting:**
**Indian Regional Format:**
- Converts absolute values to Crore denomination (1 Crore = 10 Million)
- Scales to Thousand Crores (K Cr) for mid-size companies
- Scales to Lakh Crores (L Cr) for large corporations
- Appropriate for analyzing Indian market stocks
**Global Standard Format:**
- Uses Million (M) for smaller companies
- Scales to Billion (B) for mid-cap and large-cap stocks
- Uses Trillion (T) for mega-cap corporations
- Thousands (K) for smaller financial figures
- Standard across US and international markets
**4. Comparative Growth Analysis:**
**Quarter-over-Quarter (QoQ) Calculations:**
The script compares each quarter's performance against the immediately preceding quarter to identify:
- Sequential growth trends
- Momentum acceleration or deceleration
- Short-term business trajectory
- Seasonal pattern changes
**Year-over-Year (YoY) Calculations:**
Compares each quarter against the same quarter from the previous year to:
- Eliminate seasonal effects
- Identify sustainable growth trends
- Normalize for business cycles
- Provide apples-to-apples comparison
Both calculations automatically handle edge cases like missing data, account for different fiscal year conventions, and provide meaningful "N/A" indicators when comparative data is unavailable.
**5. Adaptive Color Coding System:**
**Growth Metrics (EPS, Revenue):**
- Positive growth → Green shading indicates improving performance
- Negative growth → Red shading signals declining performance
- Missing data → Gray indicates insufficient information
**Quality Indicators (Free Float %):**
- Lower float (<40%) → Green indicates potentially better supply-demand dynamics
- Higher float (≥40%) → Red suggests more diluted ownership
**Cash Flow Quality (CFO/EBITDA):**
- Strong cash conversion (≥50%) → Green shows quality earnings
- Weak cash conversion (<50%) → Red flags potential accounting concerns
**Expense Trends (Depreciation & Amortization):**
- Decreasing D&A → Green indicates improving cash flow characteristics
- Increasing D&A → Red suggests rising capital intensity
- Stable D&A → Default color shows consistency
**Future Estimates:**
- Yellow coloring clearly distinguishes forward-looking estimates from historical actuals
**6. Date and Quarter Intelligence:**
The script automatically:
- Determines the current financial quarter based on real-time date
- Maps calendar months to fiscal quarters (Q1-Q4)
- Handles different fiscal year conventions globally
- Calculates quarter differentials for accurate historical lookback
- Formats display labels showing quarter-end months and years (e.g., "Mar 24", "Dec 23")
### Advanced Calculations:
**Free Float Percentage:**
Calculates the proportion of shares available for public trading relative to total shares outstanding. Lower percentages indicate more concentrated ownership, which can affect volatility and liquidity.
**Market Capitalization:**
Real-time calculation using total shares outstanding multiplied by current market price, automatically updated with each price tick and formatted according to regional preferences.
**CFO/EBITDA Cash Quality Ratio:**
Measures what percentage of accounting earnings converts to actual operating cash flow. Higher ratios indicate better earnings quality and less aggressive accounting. Industry standards vary, but 60-100% typically signals strong cash generation.
**Operating Profit Margin Tracking:**
Monitors the percentage of revenue retained as operating profit after deducting operating expenses, providing insight into operational efficiency and pricing power trends.
## HOW TO USE THIS SCRIPT
### Initial Setup:
**1. Region Configuration:**
- **India**: Select for Indian stocks - formats numbers in Crores (₹10M = 1 Cr)
- **Global**: Select for international stocks - formats in Millions/Billions
**2. Display Settings:**
- **Position**: Choose table location on chart (Top Right recommended)
- **Table Size**: Adjust based on screen resolution (Normal is default)
- **Short Labels**: Enable to condense industry/sector names for space saving
- **Lookback Quarters**: Set how many previous quarters to display (4-20, default 5)
**3. Visual Customization:**
- **Background Color**: Customize table background color and transparency
- **Text Color**: Adjust text color for visibility
- **Border/Frame Colors**: Modify table borders for preferred appearance
### Reading the Dashboard:
**Header Section (Top 3 Rows):**
**Row 1:**
- **Ticker | Mcap**: Company symbol and current market capitalization
- **FF (Free Float)**: Percentage of freely traded shares (Green < 40% is positive, Red ≥ 40%)
- **CFO/EBITDA**: Cash flow quality ratio (Green ≥ 50% is positive, Red < 50%)
**Row 2:**
- **Industry**: Company's specific industry classification
- **Sector**: Broader sector classification
- **PEG Ratio**: Price/Earnings to Growth ratio (< 1 traditionally considered undervalued)
**Data Section:**
**Column Explanations:**
1. **Fin Q**: Financial quarter (format: "Mar 24" = Q4 FY2024 ending March)
2. **EPS**: Earnings Per Share in reporting currency
3. **QoQ %**: EPS growth versus previous quarter (Green = increase, Red = decrease)
4. **YoY %**: EPS growth versus same quarter last year
5. **Sales**: Total revenue (formatted in Cr or M/B based on region)
6. **QoQ %**: Revenue growth versus previous quarter
7. **YoY %**: Revenue growth versus same quarter last year
8. **OPM %**: Operating Profit Margin percentage
9. **D&A**: Depreciation & Amortization (Green if decreasing = cash flow positive)
**Estimates Row (Yellow Text):**
- Shows "Q Est." for upcoming quarter
- Displays analyst consensus estimates for EPS and Sales
- Compare actuals against estimates after earnings release to identify beats/misses
### Trading Applications:
**Fundamental Analysis:**
- **Earnings Quality Check**: Look for consistent QoQ and YoY growth in both EPS and Sales
- **Margin Trend Analysis**: Monitor OPM % changes to assess operational efficiency
- **Estimate Comparison**: Identify stocks that consistently beat or miss estimates
- **Cash Flow Validation**: Use CFO/EBITDA ratio to verify earnings quality
**Entry/Exit Timing:**
- **Post-Earnings Analysis**: Check if stock beat estimates and by what margin
- **Trend Confirmation**: Strong YoY growth + improving margins = positive fundamentals
- **Warning Signs**: Declining margins, negative growth, or deteriorating CFO/EBITDA
**Portfolio Screening:**
- **Growth Stocks**: Look for consistent QoQ and YoY EPS/Sales growth
- **Value Stocks**: Low PEG ratios combined with positive fundamentals
- **Quality Filter**: High CFO/EBITDA ratios (>75%) indicate superior cash generation
### Interpretation Guidelines:
**Strong Fundamental Setup:**
- YoY growth > 15% in both EPS and Sales
- QoQ growth positive for 2+ consecutive quarters
- OPM % stable or improving
- CFO/EBITDA > 60%
- Actual results exceed estimates
**Concerning Signals:**
- Declining YoY growth rates
- Shrinking operating margins
- Consistently missing estimates
- CFO/EBITDA < 40%
- Increasing D&A as percentage of revenue
## IMPORTANT USAGE NOTES
**Data Limitations:**
- Financial data depends on official company filings and reporting schedules
- Some stocks may have incomplete historical data depending on listing history
- Estimates may not be available for all companies, especially smaller-cap stocks
- Data updates occur after official earnings releases, not in real-time during announcements
**Realistic Expectations:**
- This tool displays historical fundamental data for analysis - not predictive signals
- Always verify critical financial data with official company filings when making investment decisions
- Fundamental analysis should complement technical analysis, not replace it
- Past financial performance does not guarantee future results
- Earnings estimates are analyst opinions, not certainties
**Best Practices:**
- Cross-reference important data points with company investor relations pages
- Consider industry-specific metrics beyond the displayed general figures
- Use in conjunction with technical indicators for comprehensive analysis
- Monitor for data anomalies (stock splits, accounting changes, restatements) that may affect comparisons
- Understand that different accounting standards (GAAP vs IFRS) may affect international comparisons
**Regional Considerations:**
- Indian stocks: Numbers in Crores (1 Cr = 10 Million Rupees)
- Global stocks: Numbers in standard M/B/T format
- Currency conversions are not performed - data shown in reporting currency
- Fiscal year conventions vary by region (India typically uses Apr-Mar fiscal year, US uses Jan-Dec or custom fiscal years)
- Different markets have different reporting timelines and requirements
## CONFIGURATION RECOMMENDATIONS
**For Indian Stocks:**
- Region: India
- Lookback: 5-8 quarters (recommended)
- Focus on YoY growth due to seasonal business patterns in many Indian companies
**For US/Global Stocks:**
- Region: Global
- Lookback: 4-6 quarters for tech/growth stocks
- Lookback: 8-12 quarters for cyclical/industrial stocks
- Monitor QoQ trends closely for rapid-growth sectors
**For Long-term Investors:**
- Increase lookback to 12-20 quarters to see multi-year trends
- Focus on consistency rather than individual quarter volatility
- Pay close attention to CFO/EBITDA quality metric for sustainable businesses
- Look for stable or improving margins over extended periods
**For Active Traders:**
- Use 4-6 quarter lookback for recent trend focus
- Concentrate on latest QoQ trends and estimate beats/misses
- Monitor table closely before/after earnings announcements
- Compare estimate versus actual immediately post-earnings for trading opportunities
**For Swing Traders:**
- 6-8 quarter lookback provides good balance
- Focus on acceleration/deceleration in growth rates
- Use margin trends to identify operational inflection points
- Combine with technical analysis for optimal entry/exit timing
This script serves as a comprehensive fundamental analysis tool for traders and investors who want seamless chart integration of financial data without workflow interruption, enabling faster and more informed decision-making.
Advanced Speedometer Gauge [PhenLabs]Advanced Speedometer Gauge
Version: PineScript™v6
📌 Description
The Advanced Speedometer Gauge is a revolutionary multi-metric visualization tool that consolidates 13 distinct trading indicators into a single, intuitive speedometer display. Instead of cluttering your workspace with multiple oscillators and panels, this gauge provides a unified interface where you can switch between different metrics while maintaining consistent visual interpretation.
Built on PineScript™ v6, the indicator transforms complex technical calculations into an easy-to-read semi-circular gauge with color-coded zones and a precision needle indicator. Each of the 13 available metrics has been carefully normalized to a 0-100 scale, ensuring that whether you’re analyzing RSI, volume trends, or volatility extremes, the visual interpretation remains consistent and intuitive.
The gauge is designed for traders who value efficiency and clarity. By consolidating multiple analytical perspectives into one compact display, you can quickly assess market conditions without the visual noise of traditional multi-indicator setups. All metrics are non-overlapping, meaning each provides unique insights into different aspects of market behavior.
🚀 Points of Innovation
13 selectable metrics covering momentum, volume, volatility, trend, and statistical analysis, all accessible through a single dropdown menu
Universal 0-100 normalization system that standardizes different indicator scales for consistent visual interpretation across all metrics
Semi-circular gauge design with 21 arc segments providing smooth precision and clear visual feedback through color-coded zones
Non-redundant metric selection ensuring each indicator provides unique market insights without analytical overlap
Advanced metrics including MFI (volume-weighted momentum), CCI (statistical deviation), Volatility Rank (extended lookback), Trend Strength (ADX-style), Choppiness Index, Volume Trend, and Price Distance from MA
Flexible positioning system with 5 chart locations, 3 size options, and fully customizable color schemes for optimal workspace integration
🔧 Core Components
Metric Selection Engine: Dropdown interface allowing instant switching between 13 different technical indicators, each with independent parameter controls
Normalization System: All metrics converted to 0-100 scale using indicator-specific algorithms that preserve the statistical significance of each measurement
Semi-Circular Gauge: Visual display using 21 arc segments arranged in curved formation with two-row thickness for enhanced visibility
Color Zone System: Three distinct zones (0-40 green, 40-70 yellow, 70-100 red) providing instant visual feedback on metric extremes
Needle Indicator: Dynamic pointer that positions across the gauge arc based on precise current metric value
Table Implementation: Professional table structure ensuring consistent positioning and rendering across different chart configurations
🔥 Key Features
RSI (Relative Strength Index): Classic momentum oscillator measuring overbought/oversold conditions with adjustable period length (default 14)
Stochastic Oscillator: Compares closing price to price range over specified period with smoothing, ideal for identifying momentum shifts
MFI (Money Flow Index): Volume-weighted RSI that combines price movement with volume to measure buying and selling pressure intensity
CCI (Commodity Channel Index): Measures statistical deviation from average price, normalized from typical -200 to +200 range to 0-100 scale
Williams %R: Alternative overbought/oversold indicator using high-low range analysis, inverted to match 0-100 scale conventions
Volume %: Current volume relative to moving average expressed as percentage, capped at 100 for extreme spikes
Volume Trend: Cumulative directional volume flow showing whether volume is flowing into up moves or down moves over specified period
ATR Percentile: Current Average True Range position within historical range using specified lookback period (default 100 bars)
Volatility Rank: Close-to-close volatility measured against extended historical range (default 252 days), differs from ATR in calculation method
Momentum: Rate of change calculation showing price movement speed, centered at 50 and normalized to 0-100 range
Trend Strength: ADX-style calculation using directional movement to quantify trend intensity regardless of direction
Choppiness Index: Measures market choppiness versus trending behavior, where high values indicate ranging markets and low values indicate strong trends
Price Distance from MA: Measures current price over-extension from moving average using standard deviation calculations
🎨 Visualization
Semi-Circular Arc Display: Curved gauge spanning from 0 (left) to 100 (right) with smooth progression and two-row thickness for visibility
Color-Coded Zones: Green zone (0-40) for low/oversold conditions, yellow zone (40-70) for neutral readings, red zone (70-100) for high/overbought conditions
Needle Indicator: Downward-pointing triangle (▼) positioned precisely at current metric value along the gauge arc
Scale Markers: Vertical line markers at 0, 25, 50, 75, and 100 positions with corresponding numerical labels below
Title Display: Merged cell showing “𓄀 PhenLabs” branding plus currently selected metric name in monospace font
Large Value Display: Current metric value shown with two decimal precision in large text directly below title
Table Structure: Professional table with customizable background color, text color, and transparency for minimal chart obstruction
📖 Usage Guidelines
Metric Selection
Select Metric: Default: RSI | Options: RSI, Stochastic, Volume %, ATR Percentile, Momentum, MFI (Money Flow), CCI (Commodity Channel), Williams %R, Volatility Rank, Trend Strength, Choppiness Index, Volume Trend, Price Distance | Choose the technical indicator you want to display on the gauge based on your current analytical needs
RSI Settings
RSI Length: Default: 14 | Range: 1+ | Controls the lookback period for RSI calculation, shorter periods increase sensitivity to recent price changes
Stochastic Settings
Stochastic Length: Default: 14 | Range: 1+ | Lookback period for stochastic calculation comparing close to high-low range
Stochastic Smooth: Default: 3 | Range: 1+ | Smoothing period applied to raw stochastic value to reduce noise and false signals
Volume Settings
Volume MA Length: Default: 20 | Range: 1+ | Moving average period used to calculate average volume for comparison with current volume
Volume Trend Length: Default: 20 | Range: 5+ | Period for calculating cumulative directional volume flow trend
ATR and Volatility Settings
ATR Length: Default: 14 | Range: 1+ | Period for Average True Range calculation used in ATR Percentile metric
ATR Percentile Lookback: Default: 100 | Range: 20+ | Historical range used to determine current ATR position as percentile
Volatility Rank Lookback (Days): Default: 252 | Range: 50+ | Extended lookback period for Volatility Rank metric using close-to-close volatility
Momentum and Trend Settings
Momentum Length: Default: 10 | Range: 1+ | Lookback period for rate of change calculation in Momentum metric
Trend Strength Length: Default: 20 | Range: 5+ | Period for directional movement calculations in ADX-style Trend Strength metric
Advanced Metric Settings
MFI Length: Default: 14 | Range: 1+ | Lookback period for Money Flow Index calculation combining price and volume
CCI Length: Default: 20 | Range: 1+ | Period for Commodity Channel Index statistical deviation calculation
Williams %R Length: Default: 14 | Range: 1+ | Lookback period for Williams %R high-low range analysis
Choppiness Index Length: Default: 14 | Range: 5+ | Period for calculating market choppiness versus trending behavior
Price Distance MA Length: Default: 50 | Range: 10+ | Moving average period used for Price Distance standard deviation calculation
Visual Customization
Position: Default: Top Right | Options: Top Left, Top Right, Bottom Left, Bottom Right, Middle Right | Controls gauge placement on chart for optimal workspace organization
Size: Default: Normal | Options: Small, Normal, Large | Adjusts overall gauge dimensions and text size for different monitor resolutions and preferences
Low Zone Color (0-40): Default: Green (#00FF00) | Customize color for low/oversold zone of gauge arc
Medium Zone Color (40-70): Default: Yellow (#FFFF00) | Customize color for neutral/medium zone of gauge arc
High Zone Color (70-100): Default: Red (#FF0000) | Customize color for high/overbought zone of gauge arc
Background Color: Default: Semi-transparent dark gray | Customize gauge background for contrast and chart integration
Text Color: Default: White (#FFFFFF) | Customize all text elements including title, value, and scale labels
✅ Best Use Cases
Quick visual assessment of market conditions when you need instant feedback on whether an asset is in extreme territory across multiple analytical dimensions
Workspace organization for traders who monitor multiple indicators but want to reduce chart clutter and visual complexity
Metric comparison by switching between different indicators while maintaining consistent visual interpretation through the 0-100 normalization
Overbought/oversold identification using RSI, Stochastic, Williams %R, or MFI depending on whether you prefer price-only or volume-weighted analysis
Volume analysis through Volume %, Volume Trend, or MFI to confirm price movements with corresponding volume characteristics
Volatility monitoring using ATR Percentile or Volatility Rank to identify expansion/contraction cycles and adjust position sizing
Trend vs range identification by comparing Trend Strength (high values = trending) against Choppiness Index (high values = ranging)
Statistical over-extension detection using CCI or Price Distance to identify when price has deviated significantly from normal behavior
Multi-timeframe analysis by duplicating the gauge on different timeframe charts to compare metric readings across time horizons
Educational purposes for new traders learning to interpret technical indicators through consistent visual representation
⚠️ Limitations
The gauge displays only one metric at a time, requiring manual switching to compare different indicators rather than simultaneous multi-metric viewing
The 0-100 normalization, while providing consistency, may obscure the raw values and specific nuances of each underlying indicator
Table-based visualization cannot be exported or saved as an image separately from the full chart screenshot
Optimal parameter settings vary by asset type, timeframe, and market conditions, requiring user experimentation for best results
💡 What Makes This Unique
Unified Multi-Metric Interface: The only gauge-style indicator offering 13 distinct metrics through a single interface, eliminating the need for multiple oscillator panels
Non-Overlapping Analytics: Each metric provides genuinely unique insights—MFI combines volume with price, CCI measures statistical deviation, Volatility Rank uses extended lookback, Trend Strength quantifies directional movement, and Choppiness Index measures ranging behavior
Universal Normalization System: All metrics standardized to 0-100 scale using indicator-appropriate algorithms that preserve statistical meaning while enabling consistent visual interpretation
Professional Visual Design: Semi-circular gauge with 21 arc segments, precision needle positioning, color-coded zones, and clean table implementation that maintains clarity across all chart configurations
Extensive Customization: Independent parameter controls for each metric, five position options, three size presets, and full color customization for seamless workspace integration
🔬 How It Works
1. Metric Calculation Phase:
All 13 metrics are calculated simultaneously on every bar using their respective algorithms with user-defined parameters
Each metric applies its own specific calculation method—RSI uses average gains vs losses, Stochastic compares close to high-low range, MFI incorporates typical price and volume, CCI measures deviation from statistical mean, ATR calculates true range, directional indicators measure up/down movement, and statistical metrics analyze price relationships
2. Normalization Process:
Each calculated metric is converted to a standardized 0-100 scale using indicator-appropriate transformations
Some metrics are naturally 0-100 (RSI, Stochastic, MFI, Williams %R), while others require scaling—CCI transforms from ±200 range, Momentum centers around 50, Volume ratio caps at 2x for 100, ATR and Volatility Rank calculate percentile positions, and Price Distance scales by standard deviations
3. Gauge Rendering:
The selected metric’s normalized value determines the needle position across 21 arc segments spanning 0-100
Each arc segment receives its color based on position—segments 0-8 are green zone, segments 9-14 are yellow zone, segments 15-20 are red zone
The needle indicator (▼) appears in row 5 at the column corresponding to the current metric value, providing precise visual feedback
4. Table Construction:
The gauge uses TradingView’s table system with merged cells for title and value display, ensuring consistent positioning regardless of chart configuration
Rows are allocated as follows: Row 0 merged for title, Row 1 merged for large value display, Row 2 for spacing, Rows 3-4 for the semi-circular arc with curved shaping, Row 5 for needle indicator, Row 6 for scale markers, Row 7 for numerical labels at 0/25/50/75/100
All visual elements update on every bar when barstate.islast is true, ensuring real-time accuracy without performance impact
💡 Note:
This indicator is designed for visual analysis and market condition assessment, not as a standalone trading system. For best results, combine gauge readings with price action analysis, support and resistance levels, and broader market context. Parameter optimization is recommended based on your specific trading timeframe and asset class. The gauge works on all timeframes but may require different parameter settings for intraday versus daily/weekly analysis. Consider using multiple instances of the gauge set to different metrics for comprehensive market analysis without switching between settings.

Total Info Indicator by MikePenzin
Install & Add to Chart
• Copy the script into Pine Editor → click Add to Chart .
• Open the ⚙️ Settings → Inputs to customize.
What It Does
• Displays key info in a floating table — trend, volume, ATR, RSI, stop loss, and more.
• Detects breakouts , smart SELL signals , and opening strength .
• Uses emojis and colours to make trends easy to read: 🟢 good, 🟡 neutral, 🔴 risky.
For Swing Traders
• Works best on Daily or 4H charts.
• Watch for 🟢 Uptrend + ⚡BUY / 🔥BUY breakout signals.
• Use ATR-based Stop Loss (shown in table).
• Avoid new entries a few days before earnings.
Suggested Setup
• 20/50/150 MA Lines: ON
• 200 MA Line: optional
• ATR Multiplier: 1.3
• Breakout Detection: ON (Volume + RSI + Trend filters)
• Smart SELLs: ON (RSI 70, EMA 20)
• Pivots: ON for quick swing levels
How to Read
• MA Row: 🟢 = price above MA (bullish).
• ATR/Stop Loss: Suggests where to place protective stop.
• Volume Info: Today’s vs 20-day average, plus pace.
• RSI & CCI: Shows momentum and overbought/oversold levels.
• Breakouts: ⚡BUY (early), 🔥BUY (confirmed).
• Smart SELLs: RSI🔴 / DIV🟣 / EMA🔵 mean potential exit zones.
Example Use
1️⃣ Find stocks with Uptrend 🟢 , rising volume, and ⚡BUY signal.
2️⃣ Enter near breakout; set Stop = shown level.
3️⃣ Take profits or trail when Smart SELLs appear or RSI peaks.
Tips
• Choose table corner under “Table Visualization.”
• Reduce clutter on small timeframes (turn off Pivots/200 MA).
• Use “Volume speed” to spot surging interest before breakouts.
• Compatible with most equities and ETFs.
Disclaimer
This script is for education & analysis only .
Not financial advice — always manage your own risk.

Trend Compass (Manual)## Trend Compass (Manual) - A Discretionary Trader's Dashboard
### Summary
Trend Compass is a simple yet powerful dashboard designed for discretionary traders who want a constant, visual reminder of their market analysis directly on their chart. Instead of relying on automated indicators, this tool gives you **full manual control** to define the market state across different timeframes or conditions.
It helps you stay aligned with your higher-level analysis (e.g., HTF bias, current market structure) and avoid making impulsive decisions that go against your plan.
### Key Features
- **Fully Manual Control:** You decide the trend. No lagging indicators, no confusing signals. Just your own analysis, displayed clearly.
- **Multiple Market States:** Define each row as an `Uptrend`, `Downtrend`, `Pullback`, or `Neutral` market.
- **Customizable Rows:** Display up to 8 rows. You can label each one however you like (e.g., "D1", "H4", "Market Structure", "Liquidity Bias").
- **Flexible Panel:** Change all colors, text sizes, and place the panel in any of the 9 positions on your chart.
- **Clean & Minimalist:** Designed to provide essential information at a glance without cluttering your chart.
### How to Use
1. **Add to Chart:** Add the indicator to your chart.
2. **Open Settings:** Go into the indicator settings.
3. **Configure Rows:**
- In the "Rows (Manual Control)" section, set the "Number of rows" you want to display.
- For each row, give it a custom **Label** (e.g., "m15").
- Select its current state from the dropdown menu (`Uptrend`, `Downtrend`, etc.).
- To remove a row, simply set its state to `Hidden`.
4. **Customize Style:**
- In the "Panel & Visual Style" section, adjust colors, text sizes, and the panel's position to match your chart's theme.
This tool is perfect for price action traders, ICT/SMC traders, or anyone who values a clean chart and a disciplined approach to their analysis.

Chartlense Dashboard (Data, Trend & Levels)Chartlense Dashboard (Data, Trend & Levels)
Overview
This dashboard is designed to solve two common problems for traders: chart clutter and the manual drawing of support and resistance levels . It consolidates critical data from multiple indicators into a clean table overlay and automatically plots the most relevant S&R levels based on recent price action. The primary goal is to provide a clear, at-a-glance overview of the market's structure and data.
It offers both a vertical and horizontal layout to fit any trader's workspace.
Key Concepts & Calculations Explained
This indicator is more than a simple collection of values; it synthesizes data to provide unique insights. Here’s a conceptual look at how its core components work:
Automatic Support & Resistance (Pivot-Based):
The dashed support (green) and resistance (red) lines are not manually drawn. They are dynamically calculated based on the most recent confirmed pivot highs and pivot lows . A pivot is a foundational concept in technical analysis that identifies potential turning points in price action.
How it works: A pivot high is a candle whose `high` is higher than a specific number of candles to its left and right (the "Pivot Lookback" is set to 5 by default in the settings). A pivot low is the inverse. By automatically identifying these confirmed structural points, the script visualizes the most relevant levels of potential supply and demand on the chart.
Relative Volume (RVOL):
This value in the table is not the standard volume. It measures the current bar's volume against its recent average (specifically, `current volume / 10-period simple moving average of volume`).
Interpretation: A reading above 2.0 (indicated by green text) suggests that the current volume is more than double the recent average. This technique is used to identify significant volume spikes, which can add conviction to breakouts or signal potential market climaxes.
Consolidated Data for Context:
Other values displayed in the table, such as the EMAs (9, 20, 200) , Bollinger Bands (20, 2) , RSI (14) , MACD (12, 26, 9) , and VWAP (on intraday charts), use their standard industry calculations. They are included to provide a complete contextual picture without needing to load each indicator separately, saving valuable chart space.
How to Use This in Your Trading
This dashboard is designed as a tool for confluence and context , not as a standalone signal generator. Here are some ways to integrate it into your analysis workflow:
As a Trend Filter: Before considering a trade, quickly glance at the EMAs and the MACD values in the table. A price above the key EMAs and a positive MACD can serve as a quick confirmation that you are aligned with the dominant trend.
To Validate Breakouts: When the price is approaching a key Resistance level (red pivot line), watch the RVOL value . A reading above 2.0 on the breakout candle adds significant confirmation that the move is backed by strong interest. The same logic applies to breakdowns below a support level.
To Spot Potential Reversals: Confluence is key. For example, if the price is testing a Support level (green pivot line) AND the RSI in the table is approaching oversold levels (e.g., near 30), it can signal a higher probability reversal setup.
About This Indicator
This indicator was developed by the team at ChartLense to help traders declutter their charts and focus on the data that matters. We believe in making complex analysis more accessible and organized. We hope this free tool is a valuable addition to your trading process.

Multi-Timeframe Dashboard INDIpendence AAZ is a powerful Multi-Timeframe Dashboard that provides real-time readings of:
✔ Market Structure
✔ Market Direction
✔ Entry Signals
This tool is designed for Derivatives (Soy, FCPO, etc.), Forex, Crypto, and Global Markets.
Perfect for new traders and those who do not have the time to study charts in detail.
⚠️ Disclaimer: This indicator is for educational and analytical purposes only. All trading decisions and risks remain with the user.
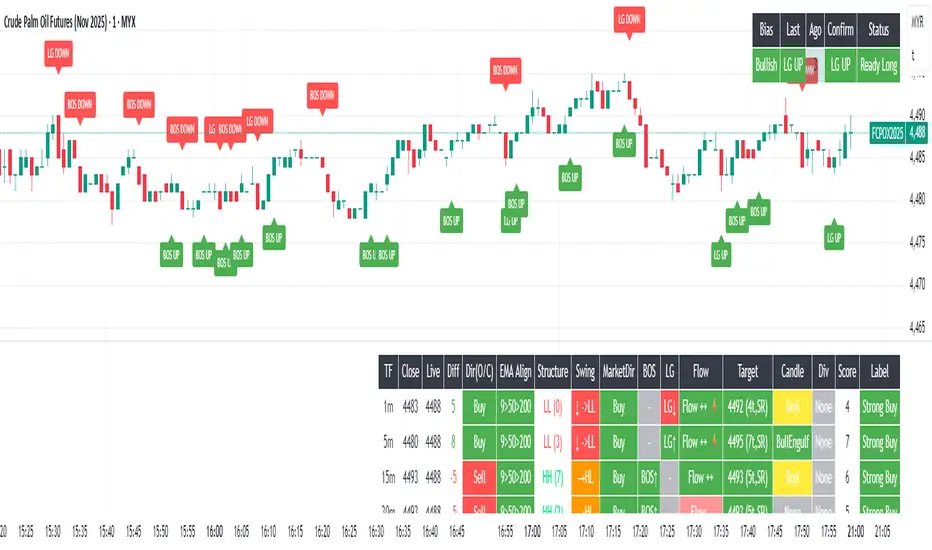
Advanced Crypto Trading Dashboard📊 Advanced Crypto Trading Dashboard
🎯 FULL DESCRIPTION FOR TRADINGVIEW POST:
🚀 WHAT IS THIS DASHBOARD?
This is an advanced multi-timeframe technical analysis dashboard designed specifically for cryptocurrency trading. Unlike basic indicators, this script combines 8 essential metrics into a single visual table, providing a 360º market overview across 4 simultaneous timeframes.
📈 ANALYZED TIMEFRAMES:
- 15M: For scalping and precise entries
- 1H: For short-term swing trades
- 4H: For intermediate analysis and confirmations
- 1D: For macro view and main trend
🎯 ADVANCED METRICS EXPLAINED:
1. 📊 MOMENTUM
- Calculation: Combines RSI (40%) + MACD (30%) + Volume (30%)
- Ratings: Bullish | Neutral ↗ | Neutral ↘ | Bearish
- Use: Identifies the strength of the current movement
2. 📈 TREND
- Calculation: Alignment of EMAs (8, 21, 55) + ADX for strength
- Signals: Strong ↗ | Strong ↘ | Trending | Ranging
- Use: Confirms trend direction and intensity
3. 💰 MONEY FLOW
- Calculation: Money Flow Index (MFI) - advanced RSI with volume
- States: Bullish | Bearish | Overbought | Oversold
- Use: Detects real buying/selling pressure (not just candle color)
4. 🎯 RSI
- Calculation: Traditional 14-period RSI
- Zones: > 70 (Overbought) | < 30 (Oversold) | Neutral
- Use: Identifies price extremes and opportunities
5. ⚡ VOLATILITY
- Calculation: ATR in percentage + state classification
- States: High | Medium | Low + exact %
- Use: Assesses risk and movement potential
6. 🔔 BB SIGNAL
- Calculation: Price position in Bollinger Bands
- Signals: Overbought | Oversold | Neutral
- Use: Confirms extremes and reversal points
7. 🎲 SCORE
- Calculation: Composite score from 0-100 based on all indicators
- Colors: Green (>75) | Yellow (40-75) | Red (<40)
- Use: Quick overall assessment of asset strength
🎨 VISUAL FEATURES:
🌈 SMART COLOR SYSTEM:
- Green: Bullish signals/buy opportunities
- Red: Bearish signals/sell opportunities
- Yellow: Neutral zones/wait for confirmation
- Blue: Neutral technical information
📍 FULL CUSTOMIZATION:
- Position: Left | Center | Right
- Size: Small | Normal | Large
- Emojis: On/Off for professional settings
- Parameters: All periods adjustable
📋 HOW TO INTERPRET:
✅ STRONG BUY SIGNAL:
- Momentum: Bullish
- Trend: Strong ↗
- Money Flow: Bullish
- RSI: 30-70 (healthy zone)
- Score: >60
❌ STRONG SELL SIGNAL:
- Momentum: Bearish
- Trend: Strong ↘
- Money Flow: Bearish
- RSI: >70 or <30 (extremes)
- Score: <40
⚠️ CAUTION ZONE:
- Conflicting signals across timeframes
- Money Flow vs. Trend divergence
- RSI at extremes with average Score
💡 USAGE STRATEGIES:
🎯 SCALPING (15M-1H):
- Check alignment between 15M and 1H
- Enter when both show the same signal
- Use Stop Loss based on volatility
📈 SWING TRADING (1H-4H):
- Confirm trend on 4H
- Enter on pullbacks in 1H
- Target based on overall Score
🏦 POSITION TRADING (4H-1D):
- Focus on 1D analysis
- Use 4H for entry timing
- Hold position until Score reverses
🔧 RECOMMENDED SETTINGS:
👨💼 FOR PROFESSIONAL TRADERS:
- Position: Center
- Size: Normal
- Emojis: Off
- Chart Timeframe: 1H
🎮 FOR BEGINNERS:
- Position: Right
- Size: Large
- Emojis: On
- Chart Timeframe: 4H
⚡ ADVANTAGES OVER OTHER DASHBOARDS:
✅ Precise Calculations: Real MFI vs. "fake buyer volume"
✅ Multi-Timeframe: 4 simultaneous analyses
✅ Composite Score: Overall view in one number
✅ Intuitive Visuals: Clear colors and symbols
✅ Fully Customizable: Adapts to any setup
✅ Zero Repaint: Reliable and stable data
✅ Optimized Performance: Doesn’t lag the chart
🎓 PRACTICAL EXAMPLE:
Asset: BTCUSDT | Timeframe: 1H
| TF | Momentum | Trend | Money Flow | RSI | Score |
|------|----------|------------|------------|-----|-------|
| 15M | Bullish | Strong ↗ | Bullish | 65 | 78 |
| 1H | Neutral↗ | Strong ↗ | Bullish | 58 | 68 |
| 4H | Neutral↘ | Trending | Bearish | 45 | 52 |
| 1D | Bearish | Strong ↘ | Bearish | 35 | 32 |
📊 Interpretation:
- Short-term: Bullish (15M-1H aligned)
- Mid-term: Conflict (4H neutral)
- Long-term: Bearish (1D negative)
- Strategy: Short-term bullish trade with tight stop
🚨 IMPORTANT NOTES:
- This indicator is a support tool, not an automated system
- Always combine with traditional chart analysis
- Test in paper trading before using real money
- Always manage risk with appropriate stop loss
- Not a holy grail - no indicator is 100% accurate
📞 SUPPORT AND FEEDBACK:
Leave your rating and comments! Your feedback helps continuously improve this tool.

Vantage-XVANTAGE-X – The Market. Decoded.
Your vantage point between bull & bear — clarity, precision, and high-probability trading signals.
VANTAGE-X is a high-probability trading system designed to cut through the noise and deliver clarity at a glance.
🔹 What It Does
• EMA 20 (1H), EMA 50 (4H), EMA 200 (chart timeframe) → Instant bullish/bearish signals
• VWAP → Bullish/Bearish/Neutral, based on last 5 candles for precision
• Daily Bias → Bullish or Bearish without switching charts
• Chop Filter → Detects if market is trending or choppy (last 10 candles)
• Works across all assets on TradingView — futures, forex, stocks, crypto, options
🔹 Why Traders Use It
• Eliminates chart clutter and analysis paralysis
• No more flipping timeframes — dashboard updates automatically
• Clear signals = faster decisions, cleaner trades
🚨 Subscription Access Only – Invite-Only Script
This indicator is available exclusively to subscribed members of VANTAGE-X. Access is tied to your TradingView username and managed manually by our team.
👉 Website coming soon

Sector Rotation & Money Flow Dashboard📊 Overview
The Sector Rotation & Money Flow Dashboard is a comprehensive market analysis tool that tracks 39 major sector ETFs in real-time, providing institutional-grade insights into sector rotation, momentum shifts, and money flow patterns. This indicator helps traders identify which sectors are attracting capital, which are losing favor, and where the next opportunities might emerge.
Perfect for swing traders, position traders, and investors who want to stay ahead of sector rotation and ride the strongest trends while avoiding weak sectors.
🎯 What This Indicator Does
Tracks 39 Major Sectors: From technology to utilities, cryptocurrencies to commodities
Calculates Multiple Timeframes: 1-week, 1-month, 3-month, and 6-month performance
Advanced Momentum Metrics: Proprietary momentum score and acceleration calculations
Relative Strength Analysis: Compare sector performance against any benchmark index
Money Flow Signals: Visual indicators showing where institutional money is moving
Smart Filtering: Pre-built strategy filters for different trading styles
Trend Detection: Emoji-based visual system for quick trend identification
💡 Key Features
1. Performance Metrics
Multiple timeframe analysis (1W, 1M, 3M, 6M)
Month-over-month change tracking
Relative strength vs benchmark index
2. Advanced Analytics
Momentum Score: Weighted composite of recent performance
Acceleration: Rate of change in momentum (second derivative)
Money Flow Signals: IN/OUT/TURN/WATCH indicators
3. Strategy Preset Filters
🎯 Swing Trade: High momentum opportunities
📈 Trend Follow: Established uptrends
🔄 Mean Reversion: Oversold bounce candidates
💎 Value Hunt: Deep value opportunities
🚀 Breakout: Emerging strength
⚠️ Risk Off: Sectors to avoid
4. Customization
All 39 sector ETFs can be customized
Adjustable benchmark index
Flexible display options
Multiple sorting methods
📋 Settings Documentation
Display Settings
Show Table (Default: On)
Toggles the entire dashboard display
Table Position (Default: Middle Center)
Choose from 9 positions on your chart
Options: Top/Middle/Bottom × Left/Center/Right
Rows to Show (Default: 15)
Number of sectors displayed (5-40)
Useful for focusing on top/bottom performers
Sort By (Default: Momentum)
1M/3M/6M: Sort by specific timeframe performance
Momentum: Weighted recent performance score
Acceleration: Rate of momentum change
1M Change: Month-over-month improvement
RS: Relative strength vs benchmark
Flow: IN First: Prioritize sectors with inflows
Flow: TURN First: Focus on reversal candidates
Recovery Plays: Oversold sectors recovering
Oversold Bounce: Deepest declines with positive signs
Top Gainers/Losers 3M: Best/worst quarterly performers
Best Acc + Mom: Combined strength score
Worst Acc (Topping): Sectors losing momentum
Filter Settings
Strategy Preset Filter (Default: All)
All: No filtering
🎯 Swing Trade: Mom >5, Acc >2, Money flowing in
📈 Trend Follow: Positive 1M & 3M, RS >0
🔄 Mean Reversion: Oversold but improving
💎 Value Hunt: Down >10% with recovery signs
🚀 Breakout: Rapid momentum surge
⚠️ Risk Off: Declining or topping sectors
Custom Flow Filter: Use manual flow filter
Custom Flow Signal Filter (Default: All)
Only active when Strategy Preset = "Custom Flow Filter"
IN Only: Strong inflows
TURN Only: Reversal signals
WATCH Only: Recovery candidates
OUT Only: Outflow sectors
Active Flows Only: Any non-neutral signal
Hide Low Volume ETFs (Default: Off)
Filters out illiquid sectors (future enhancement)
Visual Settings
Show Trend Emojis (Default: On)
🚀 Breakout (Strong 1M + High Acceleration)
🔥 Hot Recovery (From -10% to positive)
💪 Steady Uptrend (All timeframes positive)
➡️ Sideways/Ranging
⚠️ Warning/Topping (Up >15%, now slowing)
📉 Falling (Negative + declining)
🔄 Bottoming (Improving from lows)
Compact Mode (Default: Off)
Removes decimals for cleaner display
Useful when showing many rows
Min Data Points Required (Default: 3)
Minimum data points needed to display a sector
Prevents showing sectors with insufficient data
Relative Strength Settings
RS Benchmark Index (Default: AMEX:SPY)
Index to compare all sectors against
Can use SPY, QQQ, IWM, or any other index
RS Period (Days) (Default: 21)
Lookback period for RS calculation
21 days = 1 month, 63 days = 3 months, etc.
Sector ETF Settings (Groups 1-39)
Each sector has two inputs:
Symbol: The ticker (e.g., "AMEX:XLF")
Name: Display name (e.g., "Financials")
All 39 sectors can be customized to track different ETFs or markets.
📈 Column Explanations
Sector: ETF name/description
1M%: 1-month (21-day) performance
3M%: 3-month (63-day) performance
6M%: 6-month (126-day) performance
Mom: Momentum score (weighted average, recent-biased)
Acc: Acceleration (momentum rate of change)
Δ1M: Month-over-month change
RS: Relative strength vs benchmark
Flow: Money flow signal
↗️ IN: Strong inflows
🔄 TURN: Potential reversal
👀 WATCH: Recovery candidate
↘️ OUT: Outflows
—: Neutral
🎮 Usage Tips
For Swing Traders (3-14 days)
Use "🎯 Swing Trade" filter
Sort by "Acceleration" or "Momentum"
Look for Flow = "IN" and Mom >10
Confirm with positive RS
For Position Traders (2-8 weeks)
Use "📈 Trend Follow" filter
Sort by "RS" or "Best Acc + Mom"
Focus on consistent green across timeframes
Ensure RS >3 for market leaders
For Value Investors
Use "💎 Value Hunt" filter
Sort by "Recovery Plays" or "Top Losers 3M"
Look for improving Δ1M
Check for "WATCH" or "TURN" signals
For Risk Management
Regularly check "⚠️ Risk Off" filter
Sort by "Worst Acc (Topping)"
Review holdings for ⚠️ warning emojis
Exit sectors showing "OUT" flow
Market Regime Recognition
Bull Market: Many sectors showing "IN" flow, positive RS
Bear Market: Widespread "OUT" flows, negative RS
Rotation: Mixed flows, some "IN" while others "OUT"
Recovery: Multiple "TURN" and "WATCH" signals
🔧 Pro Tips
Combine Filters + Sorting: Filter first to narrow candidates, then sort to prioritize
Multi-Timeframe Confirmation: Best setups show alignment across 1M, 3M, and momentum
RS is Key: Sectors outperforming SPY (RS >0) tend to continue outperforming
Acceleration Matters: Positive acceleration often precedes price breakouts
Flow Transitions: "WATCH" → "TURN" → "IN" progression identifies new trends early
Regular Scans:
Daily: Check "Acceleration" sort
Weekly: Review "1M Change"
Monthly: Analyze "RS" shifts
Divergence Signals:
Price up but Acceleration down = Potential top
Price down but Acceleration up = Potential bottom
Sector Pairs Trading: Long sectors with "IN" flow, short sectors with "OUT" flow
⚠️ Important Notes
This indicator makes 40 security requests (maximum allowed)
Best used on Daily timeframe
Data updates in real-time during market hours
Some ETFs may show "—" if data is unavailable
🎯 Common Strategies
"Follow the Flow"
Only trade sectors showing "IN" flow with positive RS
"Rotation Catcher"
Focus on "TURN" signals in sectors down >15% from highs
"Momentum Rider"
Trade top 3 sectors by Momentum score, exit when Acceleration turns negative
"Mean Reversion"
Buy sectors in bottom 20% by 3M performance when Δ1M improves
"Relative Strength Leader"
Maintain positions only in sectors with RS >5
Not financial advice - always do additional research
