Sultan MA Trinity – Scalper to SwingSultan MA Trinity Pro is an institutional moving-average trend engine for scalping, intraday and swing trading.
It auto-adjusts EMAs and ATR-based SL/TP per mode, prints clean BUY/SELL signals with break-even logic, and shows a live dashboard for trend, last trade and key MA levels.
Use it as a directional framework and confluence tool alongside your own SMC/VSA rules – not as a blind signal generator.
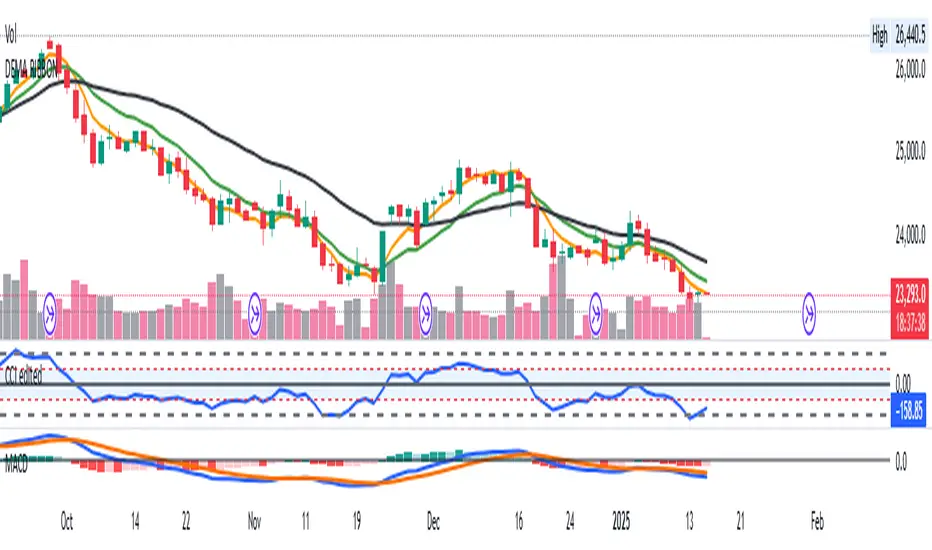
Moyenne mobile double exponentielle (DEMA)

MTF EMA Trend Table (custom)Multi Time frame EMA Trend Table (custom) then the shorter EMA cross the higher EMA in table you can see Long or short int the several time frames

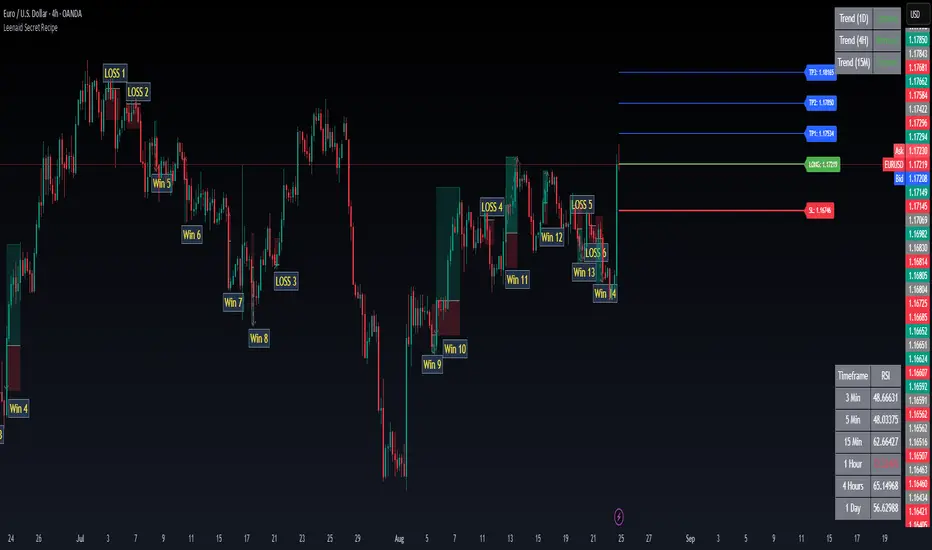
Brahmastra Basic1. Core Purpose and Strategy
This is a multi-timeframe (MTF) indicator designed to identify high-probability entry points for a specific trend-following options selling strategy. It works by confirming a trend on higher timeframes (Daily and Hourly) before waiting for a precise entry trigger on a lower timeframe (15-Minute).
The core principle is confluence: ensuring that the Daily trend bias and the Hourly trend momentum are aligned before looking for a trade. This filters out many false signals that can occur when trading on a single timeframe.
IMPORTANT: This indicator MUST be applied to a 15-minute chart to function correctly.
2. How to Read the Visual Signals on Your Chart
The indicator provides several visual cues to guide you through the trading setup from start to finish.
A. Candle Colors: The "Setup is Ready" Signal
The primary signal to start paying attention is the change in candle color.
Aqua Candles: The market is in a Bullish Alignment. This means both the Daily and Hourly trends are bullish. You should now be preparing for a Put Sell entry. The very first aqua candle in a sequence is your "alert candle."
Yellow Candles: The market is in a Bearish Alignment. This means both the Daily and Hourly trends are bearish. You should now be preparing for a Call Sell entry. The very first yellow candle in a sequence is your "alert candle."
B. Entry Signals: The "Execute Trade" Signal
These signals appear only after the alert candle's level has been breached.
Green "PUT SELL" Label (below candle): This is your signal to enter a Put Sell (or a long position). It appears on the close of the 15-minute candle that breaks above the high of the first aqua alert candle.
Red "CALL SELL" Label (above candle): This is your signal to enter a Call Sell (or a short position). It appears on the close of the 15-minute candle that breaks below the low of the first yellow alert candle.
C. Exit Signals: The "Close Position" Signal
Red 'X' (above candle): This is the signal to close your Put Sell position. It appears when the primary daily trend has reversed to bearish.
Green 'X' (below candle): This is the signal to close your Call Sell position. It appears when the primary daily trend has reversed to bullish.
D. Background & EMA Lines: The "Context"
EMA Lines: The indicator plots two key EMAs from the higher timeframes onto your 15-minute chart so you can see the context.
Orange Line: Daily 5 EMA
Blue Line: Hourly 51 EMA
Faint Background Color: After an entry signal appears, the background will remain faintly colored (green for a bullish trade, red for a bearish trade) to remind you that you are in a hypothetical position.
3. The Step-by-Step Strategy Logic
Here is the precise set of rules the indicator follows to generate its signals:
For a PUT Sell (Bullish Trade):
Alignment Check: The indicator first confirms that:
The Daily Close is above the Daily 5 EMA.
AND the Hourly Close is above the Hourly 51 EMA.
Alert Phase: As soon as this alignment is true, the 15-minute candles turn aqua. The indicator internally notes the high of the very first aqua candle.
Entry Trigger: The indicator waits for a 15-minute candle to close above the high of that first alert candle. When this happens, the green "PUT SELL" label is plotted.
Exit Condition: The position is held until the Daily Close crosses back below the Daily 5 EMA. When this happens, the red 'X' exit signal is plotted.
For a CALL Sell (Bearish Trade):
Alignment Check: The indicator first confirms that:
The Daily Close is below the Daily 5 EMA.
AND the Hourly Close is below the Hourly 51 EMA.
Alert Phase: As soon as this alignment is true, the 15-minute candles turn yellow. The indicator internally notes the low of the very first yellow candle.
Entry Trigger: The indicator waits for a 15-minute candle to close below the low of that first alert candle. When this happens, the red "CALL SELL" label is plotted.
Exit Condition: The position is held until the Daily Close crosses back above the Daily 5 EMA. When this happens, the green 'X' exit signal is plotted.

Aydan Scalper v2This indicator, called the Aydan Scalper, combines an 8-period EMA (plotted in green) and a 20-period EMA (plotted in red) to identify buy and sell signals based on their crossovers. When the green 8 EMA crosses above the red 20 EMA from below, it signals a buy opportunity. Conversely, when the green 8 EMA crosses below the red 20 EMA from above, it signals a sell opportunity. Additionally, an ATR (Average True Range) indicator is included to gauge market volatility. This combination helps scalpers make informed trading decisions on a one-minute chart.”

Aydan Scalper 2This indicator, called the Aydan Scalper, combines an 8-period EMA (plotted in green) and a 20-period EMA (plotted in red) to identify buy and sell signals based on their crossovers. When the green 8 EMA crosses above the red 20 EMA from below, it signals a buy opportunity. Conversely, when the green 8 EMA crosses below the red 20 EMA from above, it signals a sell opportunity. Additionally, an ATR (Average True Range) indicator is included to gauge market volatility. This combination helps scalpers make informed trading decisions on a one-minute chart.”
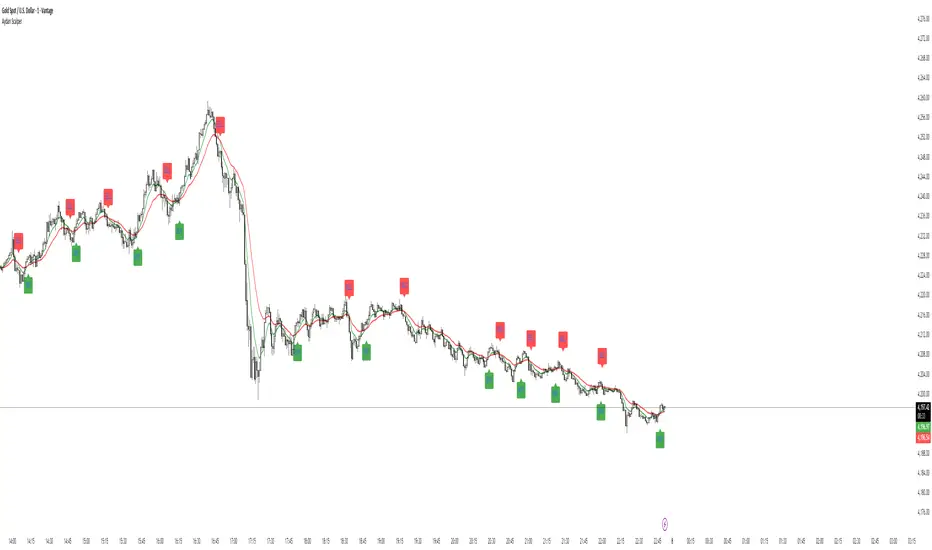
Aydan ScalperBy when EMA 8 cross EMA 21 from Below to Abouve and SELL when EMA 21 cross EMA 8 from Abouve to Belove


Dynamic Momentum OscillatorDescription:
The Dynamic Momentum Oscillator is a statistically-driven momentum tool that goes beyond traditional oscillators. Instead of using raw price, it analyzes the momentum of a DEMA (Double Exponential Moving Average) itself, creating a smoother, more refined signal. Its innovative approach incorporates volatility-weighted z-scoring, allowing the indicator to automatically adjust its sensitivity based on market conditions, helping to identify both the strength and sustainability of momentum shifts.
🔍 How It Works:
DEMA Momentum Core: The indicator first calculates a DEMA of the price. It then analyzes the momentum of this DEMA, effectively creating a "momentum of momentum" measure that filters out market noise.
Volatility-Adaptive Z-Score: The core signal is a statistical z-score, which measures how many standard deviations the DEMA is from its mean. This tells you not just the direction, but the statistical significance of the move.
Dynamic Volatility Weighting: The unique addition is a normalized standard deviation component that weights the z-score. In high volatility periods, this amplifies the signal, making strong trends more pronounced. In low volatility, it provides a more muted, conservative output.
🎯 Interpreting the Oscillator:
Zero Line: The baseline. Momentum is considered neutral here.
Orange Histogram (Above Zero): Indicates bullish momentum. The further the bar extends above zero, the stronger and more statistically significant the bullish momentum.
Purple Histogram (Below Zero): Indicates bearish momentum. The further the bar extends below zero, the stronger and more statistically significant the bearish momentum.
Signal Strength: The height of the histogram bars reflects the combined momentum and volatility, giving you a direct visual gauge of momentum strength.
⚙️ Input Parameters (Group: Core Settings):
DEMA Length: The period for the primary Double Exponential Moving Average.
Standard Deviation Length: The lookback period for calculating volatility and the z-score.
StDev Weight: Controls the influence of volatility on the final signal (0.1 = minimal, 1.0 = maximum). Adjust this to fine-tune the indicator's responsiveness.
By focusing on the statistical properties of price momentum, the Dynamic Momentum Oscillator offers a unique lens for pinpointing high-probability trend continuations and reversals. It's a powerful tool for traders who appreciate quantitative methods.

Trendz EMA VersionSupertrend + double EMA Indicator that calls out high quality trade ideas. This is the Logic:
✅ Buy only when SuperTrend turns bullish and 21 EMA > 50 EMA.
✅ Sell only when SuperTrend turns bearish and 21 EMA < 50 EMA.

Robust Scaled Dema | OquantOverview
The Robust Scaled DEMA indicator is a tool designed for traders seeking to identify potential trend directions in financial markets. It combines the smoothing capabilities of a Double Exponential Moving Average (DEMA) with a robust scaling mechanism to normalize the data, making it more resilient to outliers and extreme price movements. This scaling helps in generating long and short signals based on predefined thresholds, visualized through color-coded plots and bars. The indicator aims to provide a balanced view of market momentum, reducing the impact of noise while highlighting significant shifts in price behavior.
Key Factors/Components
DEMA (Double Exponential Moving Average): Serves as the core smoothing component, reducing lag compared to simple averages by emphasizing recent price action more effectively.
Robust Scaling Mechanism: Utilizes statistical measures like median and interquartile range to normalize the DEMA values, ensuring the indicator is less sensitive to extreme values or price spikes.
Thresholds: User-defined upper and lower levels that trigger long or short signals when the scaled DEMA crosses them.
Visual Elements: Includes plotted lines for the scaled DEMA and thresholds, plus color-coded candlestick bars for intuitive interpretation.
Alerts: Built-in conditions for notifying users of potential entry points for long or short positions.
How It Works
The indicator starts by applying a DEMA to the chosen price source to create a smoothed representation of the market's direction. This smoothed value is then scaled using a robust statistical approach that accounts for the distribution of recent DEMA values, centering it around a median and adjusting for variability to minimize the influence of outliers. The resulting scaled metric is compared against user-set upper and lower thresholds: crossing above the upper suggests a bullish momentum (long signal), while dipping below the lower indicates bearish conditions (short signal). A state variable tracks these conditions to color the chart accordingly, helping traders visualize regime changes. Optional alerts fire on transitions.
For Who Is Best/Recommended Use Cases
This indicator is ideal for traders who employ trend-following or momentum-based strategies and need tools that perform well in non-normal market conditions, such as during high volatility or in assets prone to spikes. Use cases include identifying entry/exit points in trending environments, confirming breakouts, or integrating into multi-indicator systems for added confirmation. Quantitative traders or those backtesting strategies will appreciate its customizable parameters for optimization.
Settings and Default Settings
Source: The price data input for calculations, such as close, open, high, or low. Default: close.
DEMA Length: Controls the period for the DEMA smoothing; shorter values increase responsiveness but may add noise, longer ones provide more lag but smoother signals. Default: 25.
Robust Scaling Length: Defines the lookback period for the scaling statistics; affects how adaptive the normalization is to recent data distributions. Default: 40.
Upper Threshold: The level above which a long signal is triggered; higher values make signals rarer but potentially more reliable. Default: 0.5.
Lower Threshold: The level below which a short signal is triggered; lower values allow for more aggressive bearish detection. Default: 0.
Conclusion
The Robust Scaled DEMA offers an outlier-resistant alternative to traditional moving average indicators, empowering traders to navigate volatile markets. By blending exponential smoothing with statistical robustness, it provides actionable insights into trend shifts while minimizing false positives from extreme events..
⚠️ Disclaimer: This indicator is intended for educational and informational purposes only. Trading/investing involves risk, and past performance does not guarantee future results. Always test and evaluate indicators/strategies before applying them in live markets. Use at your own risk.

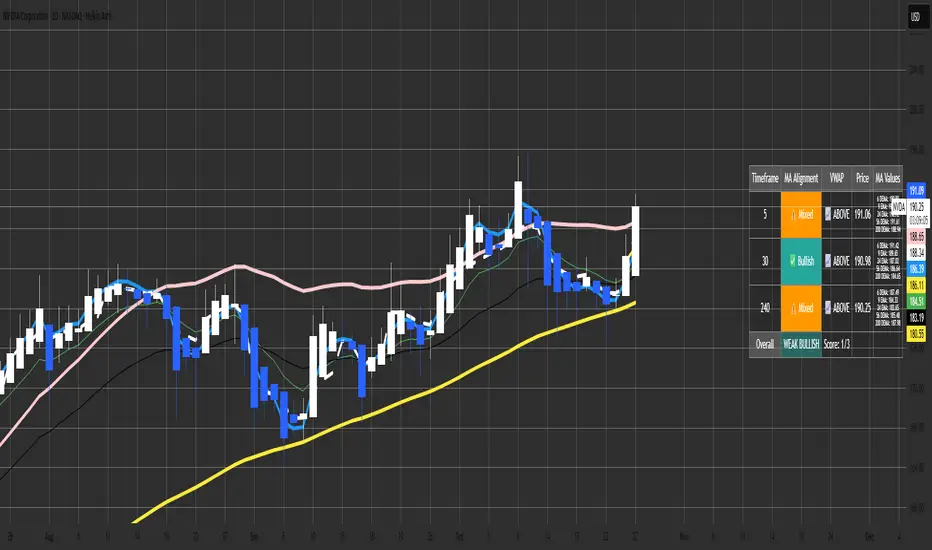
Malama's MTF MA Alignment ScannerMalama's Multi-Timeframe Moving Average Alignment Scanner (MTF MA Scanner) is an overlay indicator designed to simplify trend analysis by evaluating the alignment of multiple moving averages (MAs) across user-defined timeframes. It scans for bullish (MAs stacked ascending), bearish (descending), or mixed/neutral configurations, incorporating a VWAP (Volume Weighted Average Price) filter to contextualize price position relative to volume-based equilibrium. The result is a compact dashboard table summarizing signals from up to three timeframes, helping traders spot confluence for entries or reversals without manually switching charts. This tool draws from classic MA ribbon concepts but adds flexible MA types, dynamic sorting, and an overall trend score for quicker multi-TF insights.
Core Mechanics
The indicator processes data in layers to detect alignment and bias:
Moving Average Calculation: Supports five customizable MAs per timeframe, with types including Simple (SMA), Exponential (EMA), Double Exponential (DEMA for reduced lag), Smoothed (SMMA), or Butterworth 2-Pole filter (a low-lag recursive smoother approximating Ehlers' design for cleaner signals). Defaults use EMAs at lengths 6, 9, 21, 56, and 200—shorter for fast trends, longer for structure. Users enable/disable each independently.
Alignment Detection: For enabled MAs, it dynamically sorts them by length (shortest first) and checks their relative order: All ascending (shortest MA > longest) signals "Bullish" (uptrend strength); all descending signals "Bearish" (downtrend); otherwise "Mixed" or "Neutral" (if <2 MAs). This avoids bias from unsorted plots.
VWAP Integration: Computes session-anchored VWAP (daily/weekly/monthly) as a volume-weighted mean, classifying price as "Above" (bullish bias) or "Below" (bearish) to filter alignments—e.g., bullish MA stack above VWAP strengthens longs.
Multi-Timeframe Aggregation: Pulls MA and VWAP data from up to three timeframes (e.g., current, 5m, 15m) using secure requests without lookahead bias. It consolidates into a table: Per-TF rows show alignment status (with icons: ✅ Bullish, ❌ Bearish, ⚠️ Mixed, ➖ Neutral), VWAP icon/status (📈 Above, 📉 Below), current price, and optional MA values (e.g., "9 EMA: 1.2345").
Overall Summary: Counts bullish/bearish TFs for a net score (e.g., 2/3 bullish = "Weak Bullish"), highlighting confluence in the final row.
This setup emphasizes regime detection: Aligned short-term MAs confirm momentum, while longer ones validate structure, all filtered by VWAP for volume context.
Why This Adds Value & Originality
Standard MA crossovers or ribbons often clutter charts or require manual TF switches, leading to analysis fatigue. Here, the mashup of diverse MA types (e.g., lag-reduced DEMA with smooth Butterworth) into a sortable alignment check creates a "trend thermometer" that's adaptable—e.g., EMAs for responsiveness in forex, SMAs for stocks. The VWAP layer adds a fair-value anchor absent in pure MA tools, while the dashboard condenses MTF data into one glanceable view with a net score, reducing cognitive load. It's not a simple merge: Dynamic UDT-based sorting ensures consistent evaluation regardless of user tweaks, and optional value display aids precise level targeting. This makes it uniquely practical for confluence trading, evolving basic alignment into a scannable system without repainting risks.
How to Use
Setup: Add to your chart (overlay=true). In inputs: Enable TFs (e.g., 1H for structure, 15m/5m for entries); customize MAs (e.g., switch to DEMA for volatile crypto); set VWAP anchor (Daily for intraday). Toggle table position/size and chart plots.
Interpret the Dashboard (top-right default):
Per-TF Rows: Green cells for Bullish (long bias); red for Bearish (short); orange for Mixed (caution); gray for Neutral/low data. Check VWAP for confirmation—e.g., Bullish + Above = strong buy setup.
MA Values Column (if enabled): Lists current levels (e.g., "21 EMA: 4500.50") for support/resistance pulls.
Overall Row: "Strong Bullish" (all green) for aggressive longs; "Weak" variants for scaled entries. Score like "2/3" shows TF agreement.
Trading Application: On a 1H chart, look for 3/3 Bullish with price above VWAP for longs—enter on pullback to shortest MA. Use alerts (e.g., "All Timeframes Bullish") for notifications. Best on liquid assets (e.g., EURUSD, SPX) across 15m-4H. Combine with price action for edges.
Customization Tips: Disable unused MAs to declutter; test Butterworth on noisy data for smoother aligns.
Limitations & Disclaimer
Alignments lag by MA lengths and TF resolutions, so they're directional filters—not precise entries (pair with candlesticks). VWAP resets on anchors, potentially skewing mid-session. In sideways markets, "Mixed" dominates—avoid forcing trades. No built-in risk management; backtest on your symbols (e.g., via Strategy Tester) to validate. Results use historical data without guarantees—markets evolve. Not financial advice; trade at your own risk. For feedback, comment publicly.1.1s
Better DEMAThe Better DEMA is a new tool designed to recreate the classical moving average DEMA, into a smoother, more reliable tool. Combining many methodologies, this script offers users a unique insight into market behavior.
How does it work?
First, to get a smoother signal, we need to calculate the Gaussian filter. A Gaussian filter is a smoothing filter that reduces noise and detail by averaging data with weights following a Gaussian (bell-shaped) curve.
Now that we have the source, we will calculate the following:
n2 = n/2 (half of the user defined length)
a = 2/(1+n)
ns
Now that we have that out of the way, it is time to get into the core.
Now we calculate 2 EMAs:
slow EMA => EMA over n
fast EMA => EMA over n2 period
Rather then now doing this:
DEMA = fast EMA * 2 - slow EMA
I found this to be better:
DEMA = slow EMA * (1-a) + fast EMA * a
As a last touch I took a little something from the HMA, and used a EMA with period of √n to smooth the entire the thing.
The Trend condition at base is the following (but feel free to FAFO with it):
Long = dema > dema yesterday and dema < src
Short = dema < dema yesterday and dema > src
Methodology
While the DEMA is an amazing tool used in many great indicators, it can be far too noisy.
This made me test out many filters, out of which the Gaussian performed best.
Then I tried out the non subtractive approach and that worked too, as it made it smoother.
Compacting on all I learned and smoothing it bit by bit, I think I can say this is worth looking into :).
Use cases:
Following Trends => classic, effective :)
Smoothing sources for other indicators => if done well enough, could be useful :)
Easy trend visualization => Added extra options for that.
Strategy development => Yes
Another good thing is it does not a high lookback period, so it should be better and less overfit.
That is all for today Gs,
Have fun and enjoy!

RED RICHI EMA 34&55This indicator displays two exponential moving averages (EMA 34 & EMA 55) to identify mid-term trend direction.
It also marks crossover points with green and red circles for bullish and bearish trend shifts.

[DEM] Double Hull Moving Average (DHMA) Double Hull Moving Average (DHMA) is designed to create an ultra-smooth and responsive trend-following indicator by applying the Hull Moving Average calculation twice to reduce lag while maintaining smoothness. The indicator first calculates a Hull Moving Average of the source price over the specified length (default 233), then applies another Hull Moving Average to the result, and finally uses the standard Hull formula (2 * HMA1 - HMA2) to create the Double Hull Moving Average. The resulting line changes color dynamically from green when trending upward to red when trending downward, with matching bar colors to provide clear visual confirmation of trend direction, offering traders a highly refined moving average that responds quickly to price changes while filtering out most market noise.
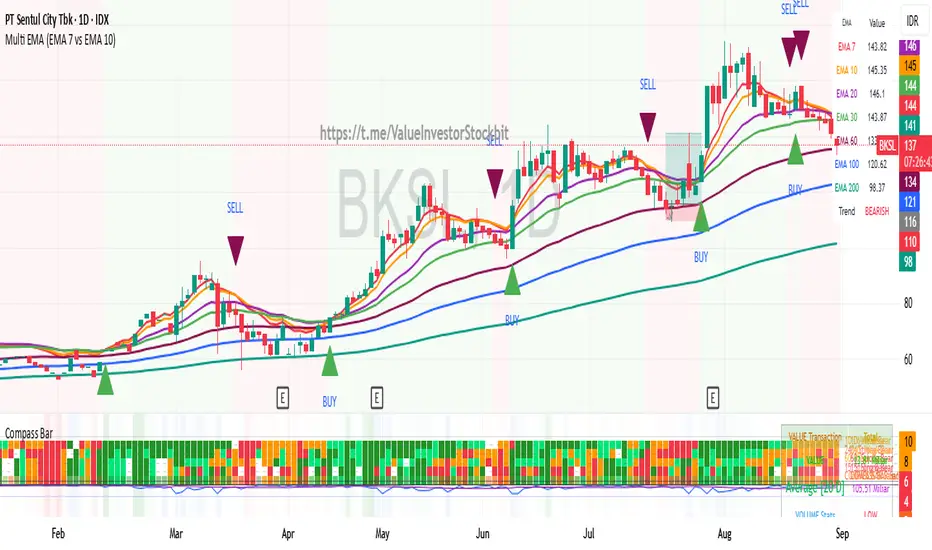
Multi Triple EMA Crossover [Salamun]Multi EMA Crossover Indicator Function:
1. Identifying Trends:
Short EMA (7, 10, 20) for short term trend
Intermediate EMA (30, 60, 100) for intermediate trends
Long EMA (200) for long term trend
The shorter the EMA period, the more sensitive it is to price changes.
2. Providing Entry/Exit Signals:
Green Arrow (BUY) : When fast EMA crosses above slow EMA = bullish momentum
Red Arrow (SELL) : When the fast EMA crosses below the slow EMA = bearish momentum
How to Read Indicators:
✅ Bullish Condition:
Price is above the majority of EMA
The short EMA is above the long EMA
Light green background
A green arrow appears.
❌ Bearish Condition:
Price is below the majority of EMA
The short EMA is below the long EMA
Pink background
A red arrow appears
📊 Tips Trading:
Trend confirmation : Make sure the EMAs are in sequence (EMA7 > EMA10 > EMA20 for uptrend)
Support/Resistance : EMA can function as dynamic support/resistance
Signal filter : Use higher timeframe for confirmation
Risk management : Do not trade against the 200 EMA trend.
The table on the top right displays the real-time values of all EMAs and the current trend status for easy quick analysis.
Volume Weighted EMAsIt's a script to calculate the volume weighted moving averages using exponential moving averages such as EMA, DEMA and TEMA instead of the pre-existing VWMA which uses SMA to calculate it.
Note: works only with charts that have volume data present, obviously !!!

Blended EMA (50 & 100)Plots EMA 50, EMA 100, and a blended EMA (average of the two)
Option to hide/show the original EMAs
Clean and lightweight — great for trend filtering on 1hr/4hr

DEMACROSSOVA BY FLACODouble EMAs for entry signals
ATR Bands for stoploss
Fibonacci bollinger bands for early exit confirmation

VWAP + EMA Retracement Indicator SwiftEdgeVWAP + EMA Retracement Indicator
Overview
The VWAP + EMA Retracement Indicator is a powerful and visually engaging tool designed to help traders identify high-probability buy and sell opportunities in trending markets. By combining the Volume Weighted Average Price (VWAP) with two Exponential Moving Averages (EMAs) and a unique retracement-based signal logic, this indicator pinpoints moments when the price pulls back to a key zone before resuming its trend. Its modern, AI-inspired visuals and customizable features make it both intuitive and adaptable for traders of all levels.
What It Does
This indicator generates buy and sell signals based on a sophisticated yet straightforward strategy:
Buy Signals: Triggered when the price is above VWAP, has recently retraced to the zone between two EMAs (default 12 and 21 periods), and a strong bullish candle closes above both EMAs.
Sell Signals: Triggered when the price is below VWAP, has retraced to the EMA zone, and a strong bearish candle closes below both EMAs.
Signal Filtering: A customizable cooldown period ensures that only the first signal in a sequence is shown, reducing noise while preserving opportunities for new trends.
Confidence Scores: Each signal includes an AI-inspired confidence score (0-100%), calculated from candle strength and price distance to VWAP, helping traders gauge signal reliability.
The indicator’s visuals enhance decision-making with dynamic gradient lines, a highlighted retracement zone, and clear signal labels, all customizable to suit your preferences.
How It Works
The indicator integrates several components that work together to create a cohesive trading tool:
VWAP: Acts as a dynamic support/resistance level, reflecting the average price weighted by volume. It filters signals to ensure buys occur in uptrends (price above VWAP) and sells in downtrends (price below VWAP).
Dual EMAs: Two EMAs (default 12 and 21 periods) define a retracement zone where the price is likely to consolidate before continuing its trend. Signals are generated only after the price exits this zone with conviction.
Retracement Logic: The indicator looks for price pullbacks to the EMA zone within a user-defined lookback window (default 5 candles), ensuring signals align with trend continuation patterns.
Candle Strength: Signals require strong candles (bullish for buys, bearish for sells) with a minimum body size based on the Average True Range (ATR), filtering out weak or indecisive moves.
Cooldown Mechanism: A unique feature that prevents signal clutter by allowing only the first signal within a user-defined period (default 3 candles), balancing responsiveness with clarity.
Confidence Score: Combines candle body size and price distance to VWAP to assign a score, giving traders an at-a-glance measure of signal strength without needing external analysis.
These components are carefully combined to capture high-probability setups while minimizing false signals, making the indicator suitable for both short-term and swing trading.
How to Use It
Add to Chart: Apply the indicator to a 15-minute chart (recommended) or your preferred timeframe.
Customize Settings:
VWAP Source: Choose the price source (default: hlc3).
EMA Periods: Adjust the fast and slow EMA periods (default: 12 and 21).
Retracement Window: Set how many candles to look back for retracement (default: 5).
ATR Period & Body Size: Define candle strength requirements (default: 14 ATR period, 0.3 multiplier).
Cooldown Period: Control the minimum candles between signals (default: 3; set to 0 to disable).
Candle Requirements: Toggle whether signals require bullish/bearish candles or entire candle above/below EMAs.
Visuals: Enable/disable gradient colors, retracement zone, confidence scores, and choose a color scheme (Neon, Light, or Dark).
Interpret Signals:
Buy: A green "Buy" label with a confidence score appears below the candle when conditions are met.
Sell: A red "Sell" label with a confidence score appears above the candle.
Use the confidence score to prioritize higher-probability signals (e.g., above 80%).
Trade Management: Combine signals with your risk management strategy, such as setting stop-loss below the retracement zone and targeting a 1:2 risk-reward ratio.
Why It’s Unique
The VWAP + EMA Retracement Indicator stands out due to its thoughtful integration of classic indicators with modern enhancements:
Balanced Signal Filtering: The cooldown mechanism ensures clarity without missing key opportunities, unlike many indicators that overwhelm with frequent signals.
AI-Inspired Confidence: The confidence score simplifies decision-making by quantifying signal strength, mimicking advanced analytical tools in an accessible way.
Elegant Visuals: Dynamic gradients, a highlighted retracement zone, and customizable color schemes (Neon, Light, Dark) create a sleek, futuristic interface that’s both functional and visually appealing.
Flexibility: Extensive customization options let traders tailor the indicator to their style, from conservative swing trading to aggressive scalping.

DEMA RIBBONDouble EMA ribbon indicator -
Best used for Short Term trade entry and exit
This consists of 3 Double EMAs - 10,21 & 50 for better trade.
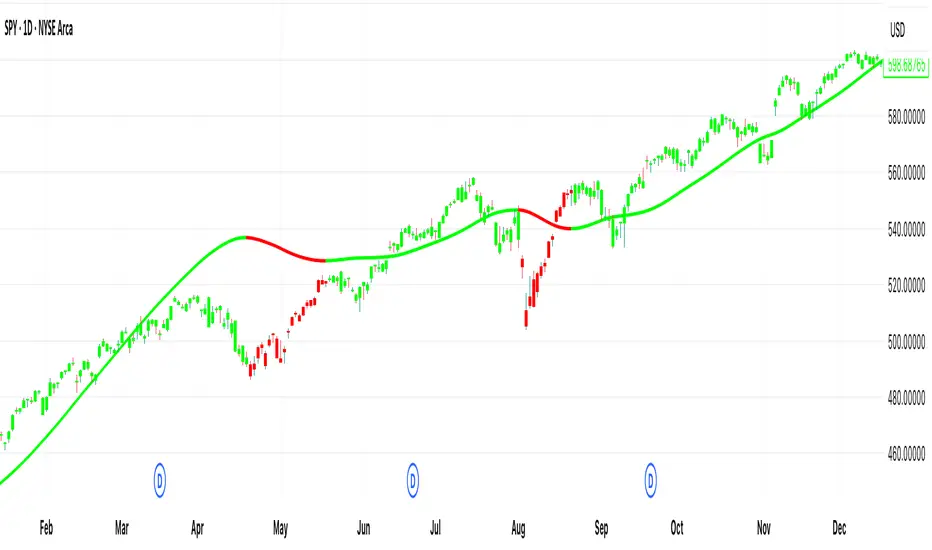
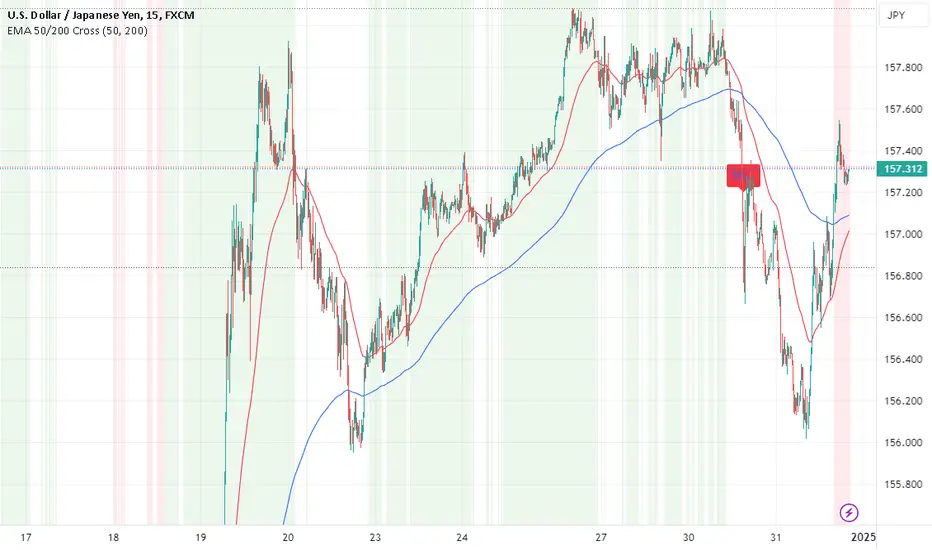
EMA Crossover Strategy with 50 & 200 EMAs - Faisal AnwarThis indicator uses 50 and 200-day Exponential Moving Averages (EMAs) to identify significant trend directions and potential trading opportunities through golden crossovers and death crosses. It highlights the role of EMAs as dynamic support in uptrends and downtrends, enhancing trend-following strategies.
Detailed Explanation:
EMAs Used:
The strategy utilizes two key EMAs — the 50-day EMA and the 200-day EMA. The 50-day EMA is often seen as a medium-term trend indicator, while the 200-day EMA is regarded as a benchmark for the long-term market trend.
Golden Crossover:
This occurs when the 50-day EMA crosses above the 200-day EMA, traditionally considered a bullish signal indicating potential long positions.
Death Cross:
This event is marked by the 50-day EMA crossing below the 200-day EMA, typically viewed as a bearish signal suggesting potential short positions.
Trend Support Identification:
The script also identifies when the price is above the 50-day EMA during an uptrend (indicating ongoing support) and when the price is above the 200-day EMA during a downtrend, suggesting the EMA is acting as resistance turning into support.
Visual Tools:
The indicator plots these EMAs on the chart with distinct colors for easy differentiation and uses background color changes to visually indicate when these EMAs act as support. Buy and sell signals are clearly marked with shapes and text directly on the chart for actionable insights.
Usage Tips:
Trading Decisions:
This indicator is best used in markets with clear trends, where EMAs can effectively identify shifts in momentum and serve as reliable support or resistance levels.
Complementary Tools:
Consider combining this EMA strategy with other technical analysis tools like RSI or MACD for confirmation of signals to enhance the reliability of the trading signals.
Ideal for:
Traders looking for a visual tool to assist in identifying trend directions and optimal points for entering or exiting trades based on established technical analysis principles.
Gauti Market Maker Killzone EMA1. Identifying the Trend
Use Daily (1D) and Hourly (1H) Exponential Moving Averages (EMAs) to define the overall trend:
Bullish Trend: Both 1D and 1H EMAs are upward sloping, and the price is above these EMAs.
Bearish Trend: Both 1D and 1H EMAs are downward sloping, and the price is below these EMAs.
2. Confirmation with Higher Timeframes
Bullish Conditions:
Check 1D and 4H charts for price action above the EMA bands.
Look for price forming higher highs and higher lows or respecting support at the EMA bands.
Bearish Conditions:
Check 1D and 4H charts for price action below the EMA bands.
Look for price forming lower highs and lower lows or respecting resistance at the EMA bands.
Note: Crossover of EMAs on higher timeframes is an optional extra confirmation, but not mandatory for entry.
3. Entry Strategy
Use the 15-Minute (15M) timeframe for entries.
Entries are taken only during Killzones:
Killzones: London Open, New York Open, or other intraday key trading sessions. (Define the time ranges for these zones based on your trading hours.)
Wait for the price to touch or pull back to the EMA band during the Killzones in the direction of the overall trend:
In a bullish trend, enter long when the price touches the EMA band and shows signs of rejection or reversal.
In a bearish trend, enter short when the price touches the EMA band and shows signs of rejection or reversal.
4. Checklist for Entry
Confirm the following before entering:
1D Trend aligns with the 1H Trend.
Price Action in 1D and 4H supports the trend.
Killzone session is active.
Price is reacting to the EMA band on the 15M chart in the trend direction.
