Elite Display# 😎 Elite Display - Simple Chart Info with Style
**Never lose track of what you're looking at!**
A clean, fun way to display your asset name, timeframe, and daily performance directly on your chart. Created by ** ** for traders who like their charts both informative and stylish.
## 📊 **What it shows:**
- Asset name (BTCUSDT) or description (Bitcoin/TetherUS)
- Current timeframe (1H, 4H, 1D, etc.)
- Daily % change with green/red colors
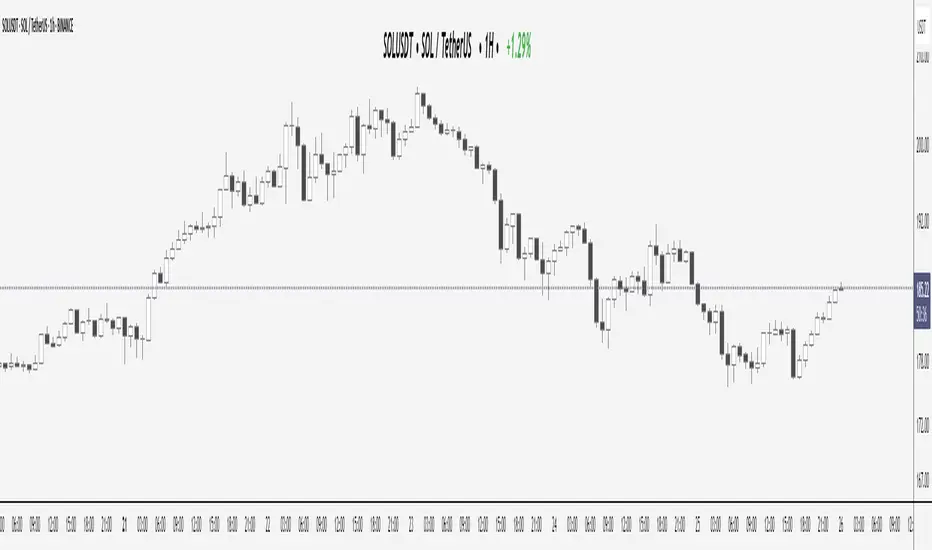
**Example:** `BTCUSDT | 1H | +2.45%`
## 🎨 **Make it yours:**
- **60+ separator styles** - From classic `|` to fun emojis 🚀💎⚡
- **Mood mode** - Separators react to your performance (😄 for gains, 😢 for losses)
- **Position anywhere** - 9 spots on your chart
- **Custom styling** - Colors, fonts, sizes, bold/italic
## 🎯 **Perfect for:**
- Multi-timeframe analysis (never forget which TF you're on!)
- Taking clean screenshots for social media
- Avoiding "wait, what symbol is this?" moments
- Adding a bit of personality to your workspace
## ⚙️ **Super simple setup:**
1. Add to chart
2. Pick what to show (asset/timeframe/both)
3. Choose your style (classic, fun, or reactive mood)
4. Position it wherever you want
5. Done!
**It's just chart info... but way more fun!** 😊
*Works on all markets: Stocks, Crypto, Forex, Commodities*# 📊 TradingHUD - Your Smart Chart Companion
**Transform your charts with the ultimate context display!** Never lose track of your symbol, timeframe, and performance again. This highly customizable indicator brings personality and clarity to your trading workspace.
## 🚀 **Key Features:**
✅ **5 Display Modes:**
- Asset Name (ticker only)
- Full Description (complete name)
- Both combined
- Timeframe Only
- Daily Variation Only
✅ **60+ Separator Styles in 3 Categories:**
- 🎨 **Classic** (15): Professional symbols (|, •, →, ★, etc.)
- 🎉 **Fun** (20): Colorful objects (🚀, 💎, ⚡, 🎯, 💰, etc.)
- 🎭 **Mood** (40+): Reactive yellow faces!
- 😄 **Happy** (21): 😀😊🥰😎🥳 (for green gains)
- 😢 **Sad** (23): 😢😭🥺😞😩 (for red losses)
✅ **Intelligent Variation Display:**
- Daily % change with smart color coding
- Green/red performance tracking
- Only appears on relevant timeframes (intraday + daily)
- Automatically hidden on weekly/monthly
✅ **Ultimate Customization:**
- 9 positioning options anywhere on chart
- Font families: Default or Monospace
- Bold/italic text formatting
- Custom colors and sizes
- Flexible element ordering
## 🎭 **Mood Mode Magic:**
Watch your separators celebrate wins with 😄🤑🚀 or empathize with losses using 😢😭💸. Toggle this emotional feature on/off anytime!
## 💡 **Perfect For:**
- Multi-timeframe analysis
- Screenshot documentation with context
- Avoiding symbol confusion
- Real-time performance tracking
- Adding personality to professional charts
- Social media trading posts
## ⚙️ **Quick Setup:**
1. Add TradingHUD to your chart
2. Select display mode (Asset/Description/Both/etc.)
3. Choose separator style (Classic/Fun/Mood)
4. Position anywhere you want
5. Customize colors, fonts, and formatting
6. Trade with confidence and style!
## 🎯 **Live Examples:**
- **Classic**: `BTCUSDT | 1H | +2.45%`
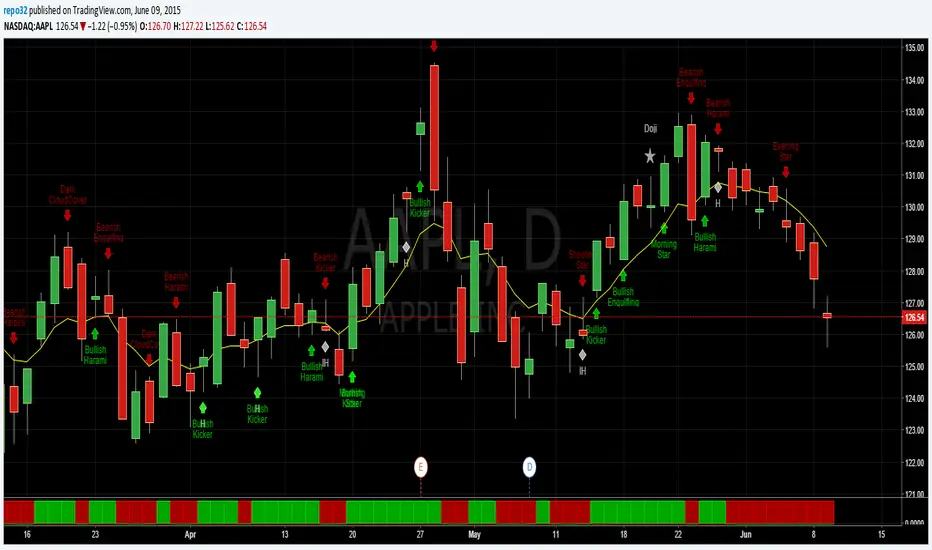
- **Fun**: `AAPL 🚀 4H 🚀 -1.23%`
- **Happy Mood**: `Gold 😄 1D 😄 +3.67%`
- **Sad Mood**: `BTC 😢 15min 😢 -5.12%`
**Professional meets personality. Context meets creativity. This is TradingHUD.** 📈✨
*Compatible with all markets: Stocks, Crypto, Forex, Commodities, Indices*
Display
MTF TREND-PANEL-(AS)
0). INTRODUCTION: "MTF TREND-PANEL-(AS)" is a technical tool for traders who often perform multi-timeframe analysis.
This simple tool is meant for traders who wish to monitor and keep track of trend directions simultaneously on various timeframes, ranging from 1MIN to 3MONTHS (or other - 'DIFF')
script enhances decision-making efficiency and provides a clearer picture of market condition by integrating multiple timeframe analysis into a single panel.
1). WARNING!:
-script doesn't make any calculations on its own really but is more of a tool for traders to remember what is happening on other time frames
- use tooltips to navigate settings easier
2). MAIN OPTIONS:
- Keeps track of up to 7 timeframes. (NUMBER of TimeFrames setting, from 1-7)
- Customizable Display: Choose to display nothing, upward/downward arrows, or a range indication for each timeframe.
- timeframe options: '1-MIN','5-MIN','15-MIN','30-MIN','1H','4H','1D','1W','1M','3M','DIFF'
- Color Coding: Define your preferred colors for each timeframe
- set position of the table and size of text (Position/text)
- Personal Touch: Add your own trading maxim or motto for inspiration to show up when SHOW TEXT is turned on
3. )OPTIONS:
-NUMBER of TimeFrames setting: from 1-7 - how many rows to show
-SHOW TABLE: Toggle to display or hide the trend table panel.
-SHOW TEXT: Show or hide your personalized trading maxim.
-SHOW TREND: Enable to display trend direction arrows.
-SHOW_CLRS: Turn on to activate color coding for each timeframe.
-position/text size for table
-settings for each timeframe:color,time,trend
-place to type ur own text
5). How to Use the Script:
-After adding the script to your chart, use the 'NUMBER of TimeFrames' setting to select how many timeframes you want to track (1 to 7).
-Customize the appearance of each timeframe row using the color and arrow options.
-For trend analysis, the script offers arrows to indicate upward, downward, or ranging markets.
-decide what trend dominates particular TF (using other tools - script does not calculate trend on its own )
- mark trends on panel to keep track of all TF
-Enable or disable various features like the table panel, trader maxim, and color coding using the ON/OFF options.
6). just in case:
- ask me anything about the code
-don't be shy to report any bugs or offer improvements of any kind.
- originally created for @ict_whiz and made public at his request

Label Display DemoA label function for display an arbitrary value above or below the chart.
There is no convenient way to display the value of a variable in pinescript. This is most convenient way I found.
It will follow the current bar (the position is calculated with highest/lowest and atr value, as such it will never display over the chart)
In this script we display ATR for the example

Price above/below EMAThis script will give you red/green columns to indicate if price is above or below a certain EMA. With Candlestick charting, we are looking for price in relation to the 8 ema Trigger Line (T-Line). You can adjust this indicator to fit your need. Simple, but nice to quickly see.
Oops. Last line's title should be "Sell". Doesn't affect display though.