High & Low Oscillator 13x8 CrossOscillator for various uses, divergence versus price action and "0" crossing of trend/move change among others. Use with cautionIndicateur Pine Script®par cns58
[RS]Linear Regression Bull and Bear Power V0EXPERIMENTAL: Bull and Bear power based on linear regression (this is a non lagging oscillator, the parameter are for the lookup window for the donchian extremes) this indicator can also be used for convergence/divergence.Indicateur Pine Script®par RicardoSantos1313467
[RS]Price Divergence Detector V0Price Overlay for Multiple Method Choice Divergence Detection:Indicateur Pine Script®par RicardoSantos33837
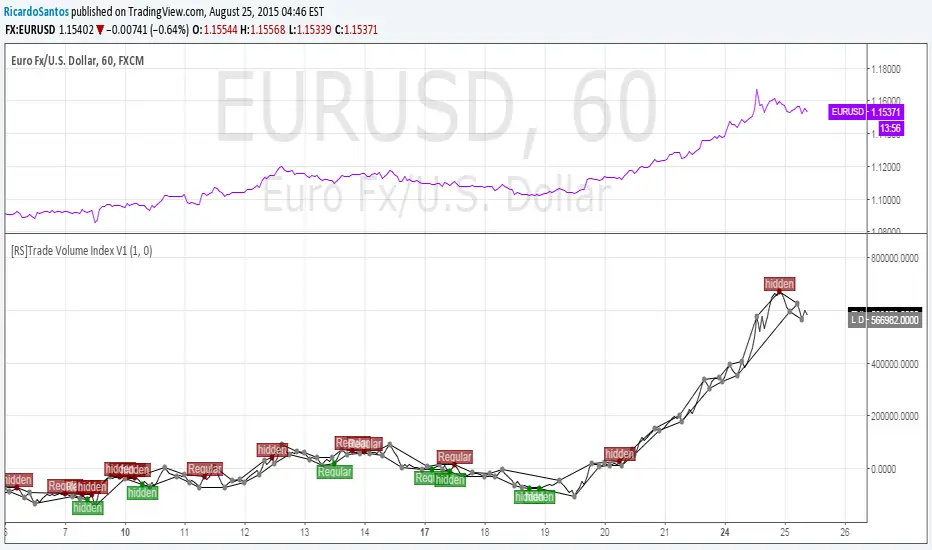
[RS]Trade Volume Index V1As described here: update: added divergence detection.Indicateur Pine Script®par RicardoSantos99270
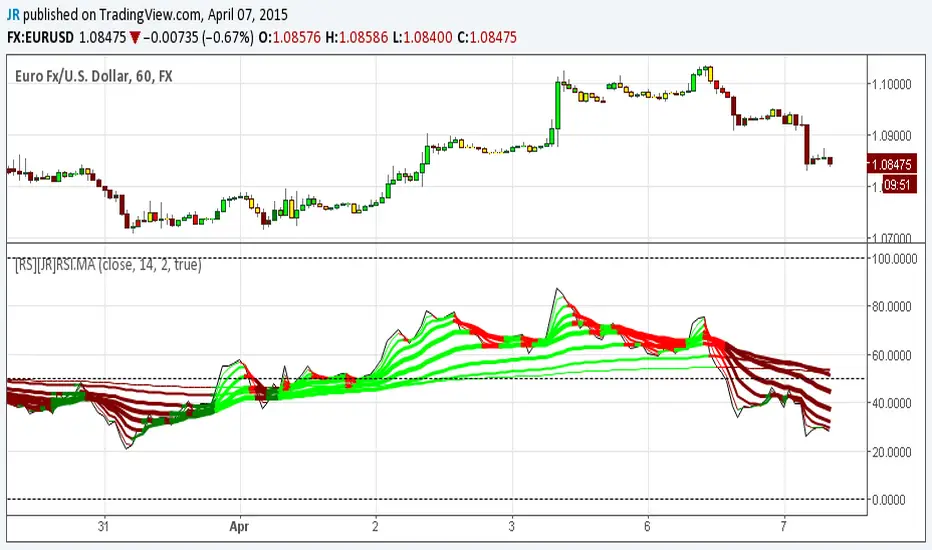
[RS]RSI Divergence V5 Thank You Richard Santos!!! This is a great indicator guys.Its good for measuring divergence in an objective way. The idea is to measure the high to high and the low to low (stock vs. indicator) with the low to high and high to low (stock vs. indicator). This is the basis of divergence. I love this one. I would also add you can draw angles on the indicator and the stocks. All in all a great indicator. Richard Santos was nice enough to modify one of his scripts for this one. Credit goes to him. You can also use this for measuring volatility when the lines narrow or widen. Indicateur Pine Script®par SpreadEagle711818 2.1 K
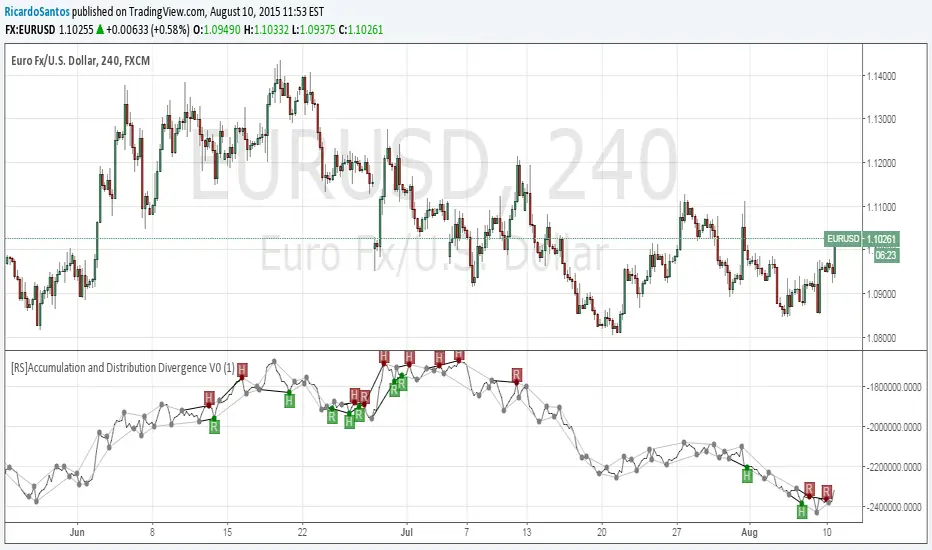
[RS]Accumulation and Distribution Divergence V0EXPERIMENTAL: Accumulation and Distribution Divergence detection.Indicateur Pine Script®par RicardoSantos2121 1.1 K
[RS]MACD Divergence V0EXPERIMENTAL: MACD Divergence detection. looks like macd is more prone for missing the extremes in price then the rsi due to lag.Indicateur Pine Script®par RicardoSantos22 1.4 K
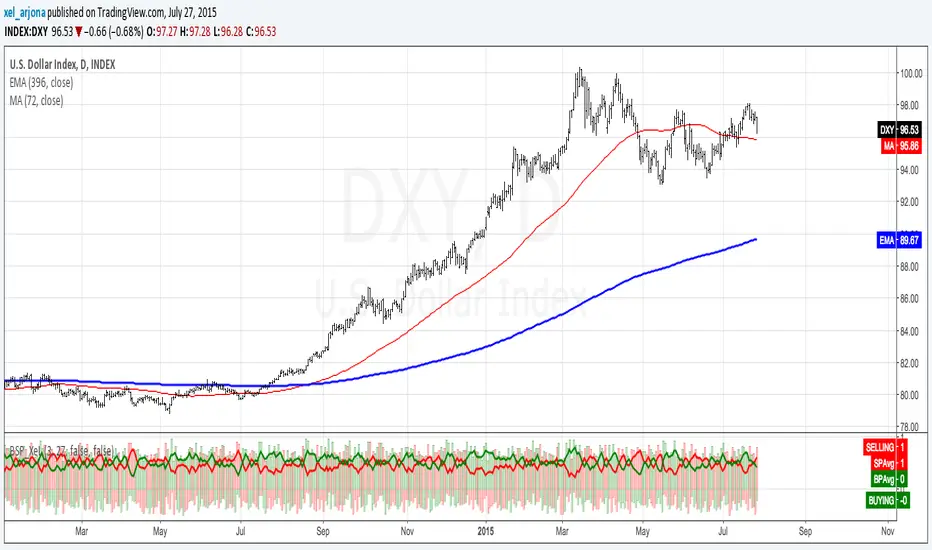
BUY & SELL VOLUME TO PRICE PRESSURE by @XeL_ArjonaBUY & SELL PRICE TO VOLUME PRESSURE By Ricardo M Arjona @XeL_Arjona DISCLAIMER: The Following indicator/code IS NOT intended to be a formal investment advice or recommendation by the author, nor should be construed as such. Users will be fully responsible by their use regarding their own trading vehicles/assets. The embedded code and ideas within this work are FREELY AND PUBLICLY available on the Web for NON LUCRATIVE ACTIVITIES and must remain as is. Pine Script code MOD's and adaptations by @XeL_Arjona with special mention in regard of: Buy (Bull) and Sell (Bear) "Power Balance Algorithm" by: Stocks & Commodities V. 21:10 (68-72): "Bull And Bear Balance Indicator by Vadim Gimelfarb" Normalisation (Filter) from Karthik Marar's VSA work: karthikmarar.blogspot.mx Buy to Sell Convergence / Divergence and Volume Pressure Counterforce Histogram Ideas by: @XeL_Arjona WHAT IS THIS? The following indicators try to acknowledge in a K-I-S-S approach to the eye (Keep-It-Simple-Stupid), the two most important aspects of nearly every trading vehicle: -- PRICE ACTION IN RELATION BY IT'S VOLUME -- Volume Pressure Histogram: Columns plotted in positive are considered the dominant Volume Force for the given period. All "negative" columns represents the counterforce Vol.Press against the dominant. Buy to Sell Convergence / Divergence: It's a simple adaptation of the popular "Price Percentage Oscillator" or MACD but taking Buying Pressure against Selling Pressure Averages, so given a Positive oscillator reading (>0) represents Bullish dominant Trend and a Negative reading (<0) a Bearish dominant Trend. Histogram is the diff between RAW Volume Pressures Convergence/Divergence minus Normalised ones (Signal) which helps as a confirmation. Volume bars are by default plotted from RAW Volume Pressure algorithms, but they can be as well filtered with Karthik Marar's approach against a "Total Volume Average" in favor to clean day to day noise like HFT. ALL NEW IDEAS OR MODIFICATIONS to these indicators are Welcome in favor to deploy a better and more accurate readings. I will be very glad to be notified at Twitter: @XeL_Arjona Any important addition to this work MUST REMAIN PUBLIC by means of CreativeCommons CC & TradingView. -- 2015Indicateur Pine Script®par xel_arjona4242 7.2 K
BUY & SELL VOLUME TO PRICE PRESSURE by @XeL_ArjonaBUY & SELL PRICE TO VOLUME PRESSURE By Ricardo M Arjona @XeL_Arjona DISCLAIMER: The Following indicator/code IS NOT intended to be a formal investment advice or recommendation by the author, nor should be construed as such. Users will be fully responsible by their use regarding their own trading vehicles/assets. The embedded code and ideas within this work are FREELY AND PUBLICLY available on the Web for NON LUCRATIVE ACTIVITIES and must remain as is. Pine Script code MOD's and adaptations by @XeL_Arjona with special mention in regard of: Buy (Bull) and Sell (Bear) "Power Balance Algorithm" by: Stocks & Commodities V. 21:10 (68-72): "Bull And Bear Balance Indicator by Vadim Gimelfarb" Normalisation (Filter) from Karthik Marar's VSA work: karthikmarar.blogspot.mx Buy to Sell Convergence / Divergence and Volume Pressure Counterforce Histogram Ideas by: @XeL_Arjona WHAT IS THIS? The following indicators try to acknowledge in a K-I-S-S approach to the eye (Keep-It-Simple-Stupid), the two most important aspects of nearly every trading vehicle: -- PRICE ACTION IN RELATION BY IT'S VOLUME -- Volume Pressure Histogram: Columns plotted in positive are considered the dominant Volume Force for the given period. All "negative" columns represents the counterforce Vol.Press against the dominant. Buy to Sell Convergence / Divergence: It's a simple adaptation of the popular "Price Percentage Oscillator" or MACD but taking Buying Pressure against Selling Pressure Averages, so given a Positive oscillator reading (>0) represents Bullish dominant Trend and a Negative reading (<0) a Bearish dominant Trend. Histogram is the diff between RAW Volume Pressures Convergence/Divergence minus Normalised ones (Signal) which helps as a confirmation. Volume bars are by default plotted from RAW Volume Pressure algorithms, but they can be as well filtered with Karthik Marar's approach against a "Total Volume Average" in favor to clean day to day noise like HFT. ALL NEW IDEAS OR MODIFICATIONS to these indicators are Welcome in favor to deploy a better and more accurate readings. I will be very glad to be notified at Twitter: @XeL_Arjona Any important addition to this work MUST REMAIN PUBLIC by means of CreativeCommons CC & TradingView. -- 2015Indicateur Pine Script®par xel_arjona1212 1.6 K
BUY & SELL VOLUME PRESSURE by @XeL_ArjonaBUY & SELL PRICE TO VOLUME PRESSURE By Ricardo M Arjona @XeL_Arjona DISCLAIMER: The Following indicator/code IS NOT intended to be a formal investment advice or recommendation by the author, nor should be construed as such. Users will be fully responsible by their use regarding their own trading vehicles/assets. The embedded code and ideas within this work are FREELY AND PUBLICLY available on the Web for NON LUCRATIVE ACTIVITIES and must remain as is. Pine Script code MOD's and adaptations by @XeL_Arjona with special mention in regard of: Buy (Bull) and Sell (Bear) "Power Balance Algorithm" by: Stocks & Commodities V. 21:10 (68-72): "Bull And Bear Balance Indicator by Vadim Gimelfarb" Normalisation (Filter) from Karthik Marar's VSA work: karthikmarar.blogspot.mx Buy to Sell Convergence / Divergence and Volume Pressure Counterforce Histogram Ideas by: @XeL_Arjona WHAT IS THIS? The following indicators try to acknowledge in a K-I-S-S approach to the eye (Keep-It-Simple-Stupid), the two most important aspects of nearly every trading vehicle: -- PRICE ACTION IN RELATION BY IT'S VOLUME -- Volume Pressure Histogram: Columns plotted in positive are considered the dominant Volume Force for the given period. All "negative" columns represents the counterforce Vol.Press against the dominant. Buy to Sell Convergence / Divergence: It's a simple adaptation of the popular "Price Percentage Oscillator" or MACD but taking Buying Pressure against Selling Pressure Averages, so given a Positive oscillator reading (>0) represents Bullish dominant Trend and a Negative reading (<0) a Bearish dominant Trend. Histogram is the diff between RAW Volume Pressures Convergence/Divergence minus Normalised ones (Signal) which helps as a confirmation. Volume bars are by default plotted from RAW Volume Pressure algorithms, but they can be as well filtered with Karthik Marar's approach against a "Total Volume Average" in favor to clean day to day noise like HFT. ALL NEW IDEAS OR MODIFICATIONS to these indicators are Welcome in favor to deploy a better and more accurate readings. I will be very glad to be notified at Twitter: @XeL_Arjona Any important addition to this work MUST REMAIN PUBLIC by means of CreativeCommons CC & TradingView. -- 2015Indicateur Pine Script®par xel_arjona1313 2.2 K
[RS]RSI Divergence Candles V2Update: added midline, changed some OB/OS lines color.Indicateur Pine Script®par RicardoSantosMis à jour 66482
[RS][JR]RSI Ribbon + CandleRSI Ribbon + Candle By Ricardo Santos and JR In this chart rendering we are combining RSI and Moving Averages. For an added features we included colors to the candles and ribbons. Lime and green displays a strong bullish trend, yellow is caution or no trade, red and maroon are bearish trends. You can also find divergences using the ribbon. Divergence Indicateur Pine Script®par QuantitativeExhaustion66740
Ultimate Oscillator Divergence Detector v0.1I wanted a more dynamic divergence indicator than the stock one so this is what's come of it so far. This is a very early version but I found its detecting normal bullish divergences pretty well so I thought I'd release it. Right now it only supports normal bullish divergences. I'm working on improving accuracy before I add in normal bearish divergences, and then will be handling hidden divergences. The spacing parameter will probably need to be tweaked based on the time frame of interest. For small time frames a value of 3 seems to work, for longer ones I go up to 7. Anything below 3 will be extremely sensitive and anything above 10 will hardly notice anything. The spacing for the example here is 3 for the main graph and 7 for the ultimate oscillator graph.Indicateur Pine Script®par blackdog662166 1.2 K
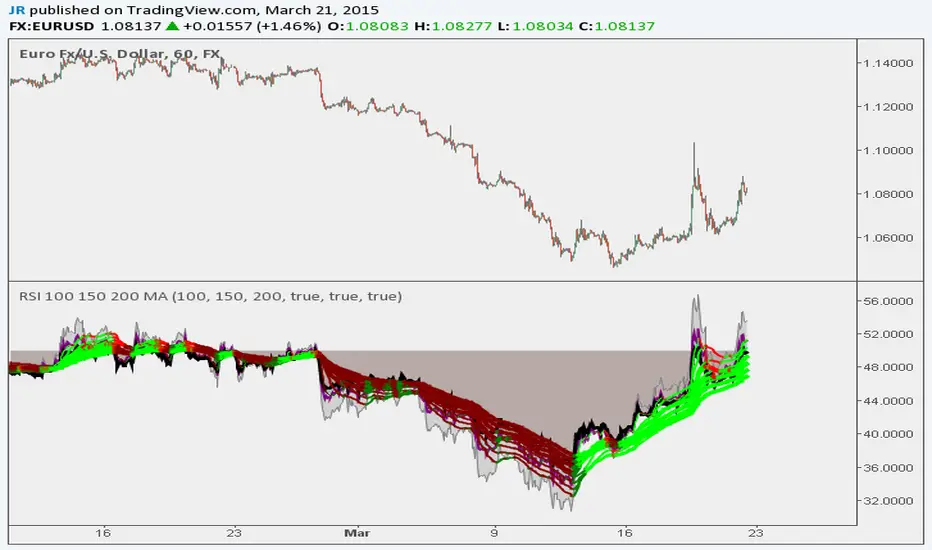
RSI 100 150 200 MA Ribbon Following Trends and Finding Divergences Here is a script example that uses a long length (100, 150, 200) RSI MA Ribbon to detect trend reversals using lower time frames. You can also use traditional RSI to find divergences. Built Best for 1H to 10 Min Charting BTCUSD Indicateur Pine Script®par QuantitativeExhaustion1111984
LX Rsi Divergence BarsThis script colours the bars when they are below or boyond a specified RSI thresholdIndicateur Pine Script®par lix22794
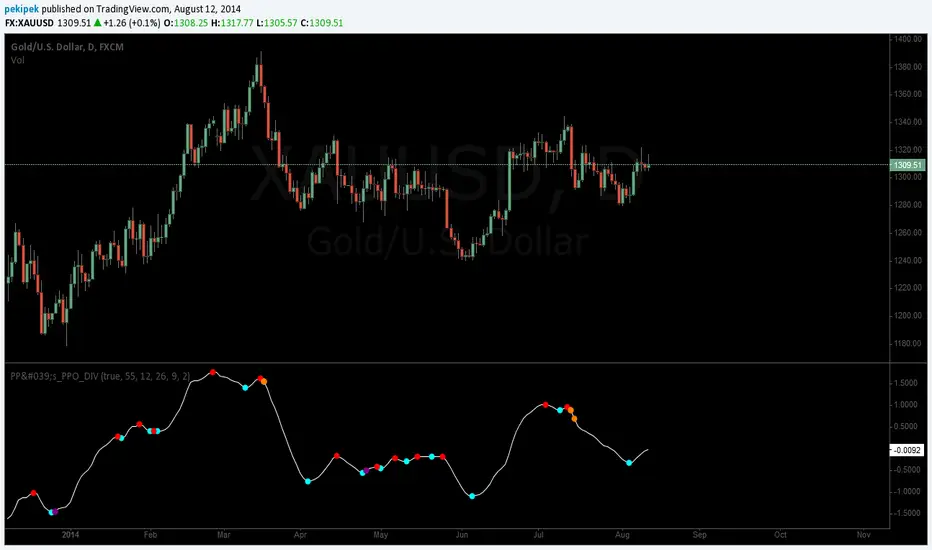
Pekipek's PPO Divergence BETABeta divergence indicator, you can exchange the Price Percentage Oscillator (PPO) for any oscillator. You can play around with the look-back period if you want to use long term divergences. WARNING: Because its impossible to make the look-back period of the lowest/highest functions dynamic, the indicator can plot divergences sometimes at places where there are none, however in my experience this does not occur so much. Also it is impossible to plot isolated lines, so its hard to visually see which divergence(s) exactly is(are) being signaled. Once these features become possible I can really refine the indicator.Indicateur Pine Script®par pekipek6060 5.2 K