Long and Short Term Highs and LowsLong and Short Term Highs and Lows
Overview:
This indicator is designed to help traders identify significant price points by marking new highs and lows over two distinct timeframes—a long-term and a short-term period. It achieves this by drawing optional channel lines that outline the highest highs and lowest lows over the chosen time periods and by plotting visual markers (triangles) on the chart when a new high or low is detected.
Key Features:
Dual Timeframe Analysis:
Long Term: Uses a user-defined “Time Period” (default 52) and “Time Unit” (default: Weekly) to determine long-term high and low levels.
Short Term: Uses a separate “Time Period” (default 50) and “Time Unit” (default: Daily) to compute short-term high and low levels.
Optional Channel Display:
For both long and short term periods, you have the option to display a channel by plotting the highest and lowest values as lines. This visual channel helps to delineate the range within which the price has traded over the selected period.
New High/Low Markers:
The indicator identifies moments when the highest high or lowest low is updated relative to the previous bar.
When a new high is established, an up triangle is plotted above the bar.
Conversely, when a new low occurs, a down triangle is plotted below the bar.
Separate input toggles allow you to enable or disable these markers independently for the long-term and short-term setups.
Inputs and Settings:
Long Term High/Low Period Settings:
Show New High/Low? (STW): Toggle to enable or disable the plotting of new high/low markers for the long-term period.
Time Period: The number of bars used to calculate the highest high and lowest low (default is 52).
Time Unit: The timeframe on which the long-term calculation is based (default is Weekly).
Show Channel? (SCW): Toggle to display the channel lines that connect the long-term high and low levels.
Short Term High/Low Period Settings:
Show New High/Low?: Toggle to enable or disable the plotting of new high/low markers for the short-term period.
Time Period: The number of bars used for calculating the short-term extremes (default is 50).
Time Unit: The timeframe on which the short-term calculations are based (default is Daily).
Show Channel?: Toggle to display the channel lines for the short-term highs and lows.
Indicator Logic:
Channel Calculation:
The script uses the request.security function to pull data from the specified timeframes. For each timeframe:
It calculates the lowest low over the defined period using ta.lowest.
It calculates the highest high over the defined period using ta.highest.
These values can be optionally plotted as channel lines when the “Show Channel?” option is enabled.
New High/Low Detection:
For each timeframe, the indicator compares the current high (or low) with its immediate previous value:
New High: When the current high exceeds the previous bar’s high, an up triangle is drawn above the bar.
New Low: When the current low falls below the previous bar’s low, a down triangle is drawn below the bar.
Usage and Interpretation:
Trend Identification:
When new highs (or lows) occur, they can signal the start of a strong upward (or downward) movement. The indicator helps you visually track these critical turning points over both longer and shorter periods.
Channel Breakouts:
The optional channel display offers additional context. Price movement beyond these channels may indicate a breakout or a significant shift in trend.
Customizable Timeframes:
You can adjust both the time period and time unit to fit your trading style—whether you’re focusing on longer-term trends or short-term price action.
Conclusion:
This indicator provides a dual-layer analysis by combining long-term and short-term perspectives, making it a versatile tool for identifying key highs and lows. Whether you are looking to confirm trend strength or spot potential breakouts, the “Long and Short Term Highs and Lows” indicator adds a valuable visual element to your TradingView charts.
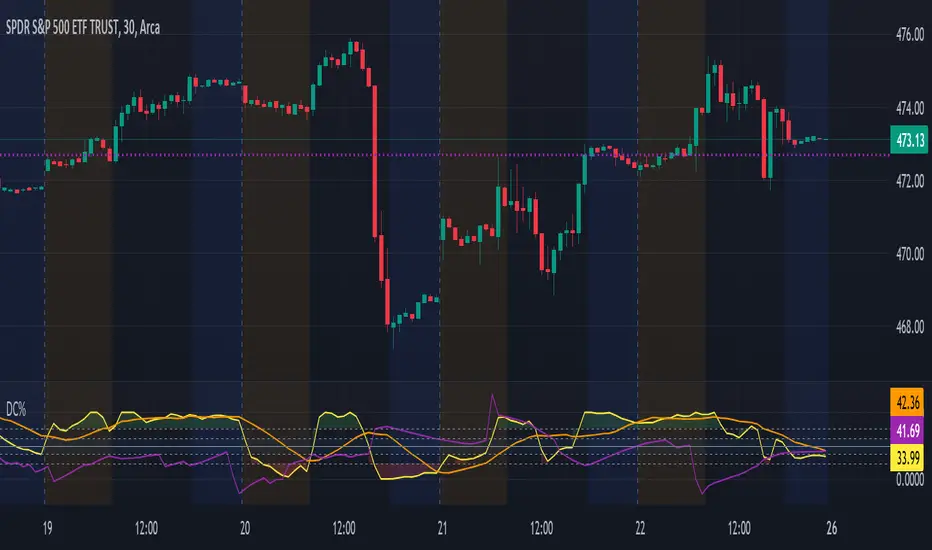
Canaux de Donchian (DC)

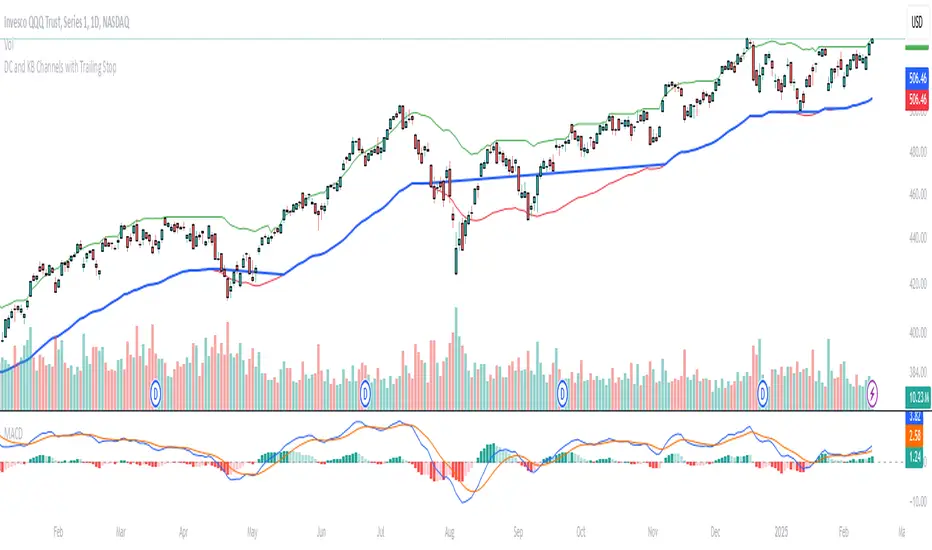
Donchian and Keltner Channels Trend Following with Trailing StopLong Only Trend-following model based on Keltner Channels and Donchian Channels.
These indicators include a noise region, which allows prices to oscillate without requiring position adjustments.
When price trades above the upper band, it signals strength; when it trades below the lower band, it signals weakness.
Keltner Channels
Keltner Channels are volatility-based envelopes set above and below an exponential moving average. Keltner Channels use the Average True Range (ATR), which measures daily volatility, to set channel distance.
Donchian Channel
Donchian Channels are are used to identify market trends and volatility. The upper and lower bands are based on the highest high and lowest low of a specified period. When the price moves above the upper band, it indicates a bullish breakout, while a
move below the lower band indicates a bearish breakout. The distance between the upper and lower channel of the Donchian Channel indicates the asset’s volatility.
Trend Following Model
The default settings are:
Upper Keltner and Upper Donchian Channel Length : 20
Lower Keltner and Lower Donchian Channel Length : 40
Keltner ATR Multiplier: 2
Entries, Exits and Trailing Stop
Entry : When price exceeds the upper band of at least one of these indicators.
Exit : When price undercuts the lower band of at least one of these indicators.
Trailing Stop : See below.
Trailing Stop
This is a stop-loss order that moves with the price of the underlying. It is designed to “trail” the price up (in the case of a long position) or down (for a short position), locking in profits as the price moves in a favorable direction.
At the end of day t, there was a Trailing Stop level in place. For the next day (day t + 1), the Trailing Stop will be adjusted. The new Trailing Stop will be the higher of two values:
The Trailing Stop from the previous day (day t).
The Lower Band computed at the end of day t + 1.
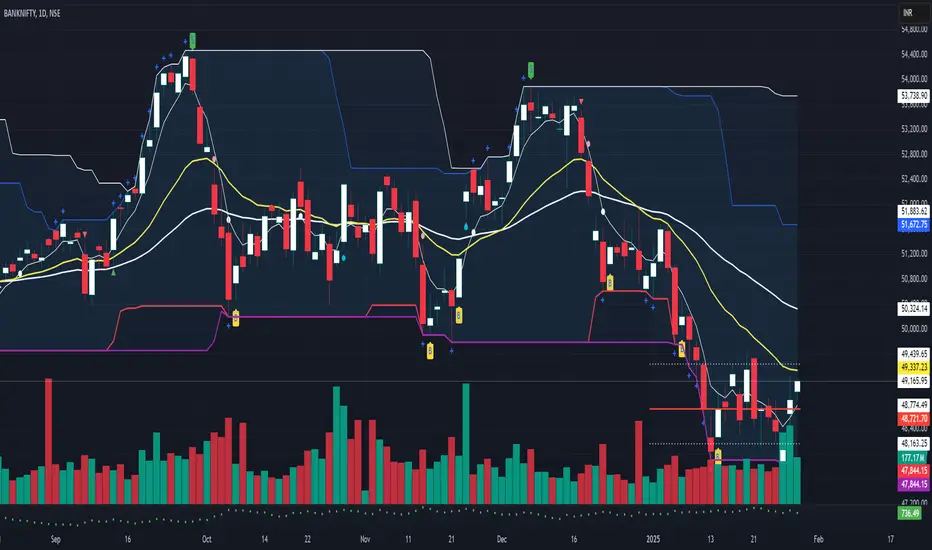
Donchian Reversal Signals with LabelsOverview:
This indicator is designed to identify potential reversal signals based on price action relative to two Donchian Channels. It plots **"BUY"** and **"SELL"** labels on the chart when specific conditions are met, helping traders spot potential trend reversals.
---
Key Features:
1. Dual Donchian Channels:
- The indicator uses two Donchian Channels with user-defined lengths (`length1` and `length2`).
- The upper band of each channel is the highest high over the specified period.
- The lower band of each channel is the lowest low over the specified period.
2. Reversal Signals:
- A yellow "BUY" label appears below a green (bullish) candle if:
- The previous candle is red (bearish).
- The previous red candle touches or breaches either of the lower Donchian Channels.
- A green "SELL" label appears above a red (bearish) candle if:
- The previous candle is green (bullish).
- The previous green candle touches or breaches either of the upper Donchian Channels.
3. Visual Clarity:
- The labels are placed above or below the candles for easy visibility.
- The use of colors (yellow for buy, green for sell) makes it intuitive to interpret the signals.
---
How It Works:
1. Donchian Channel Calculation:
- The upper and lower bands of the two Donchian Channels are calculated using the highest high and lowest low over the specified periods (`length1` and `length2`).
2. Candle Color Detection:
- The script identifies whether the current and previous candles are bullish (green) or bearish (red) based on their open and close prices.
3. Signal Conditions:
- For a **"BUY" signal**:
- The current candle must be green.
- The previous candle must be red and touch or breach either of the lower Donchian Channels.
- For a **"SELL" signal**:
- The current candle must be red.
- The previous candle must be green and touch or breach either of the upper Donchian Channels.
4. Label Placement:
- The labels are plotted using `shape.labelup` and `shape.labeldown` for clear visibility.
---
Input Parameters:
- **Donchian Channel Length 1 (`length1`)**: The period for the first Donchian Channel (default: 20).
- **Donchian Channel Length 2 (`length2`)**: The period for the second Donchian Channel (default: 34).
---
How to Use:
1. Add the indicator to your chart.
2. Adjust the lengths of the Donchian Channels if needed.
3. Look for **"BUY"** and **"SELL"** labels on the chart:
- A **yellow "BUY" label** below a green candle suggests a potential bullish reversal.
- A **green "SELL" label** above a red candle suggests a potential bearish reversal.
4. Use these signals in conjunction with other technical analysis tools for confirmation.
---
Example Use Case:
- If the price touches the lower Donchian Channel and forms a red candle, followed by a green candle, a **"BUY" label** will appear, indicating a potential upward reversal.
- If the price touches the upper Donchian Channel and forms a green candle, followed by a red candle, a **"SELL" label** will appear, indicating a potential downward reversal.
---
Customization:
- You can modify the lengths of the Donchian Channels to suit your trading style.
- The colors and text of the labels can also be adjusted in the script if desired.
---
Disclaimer:
This indicator is designed to assist traders in identifying potential reversal signals. However, it should not be used in isolation. Always confirm signals with additional analysis and risk management strategies.
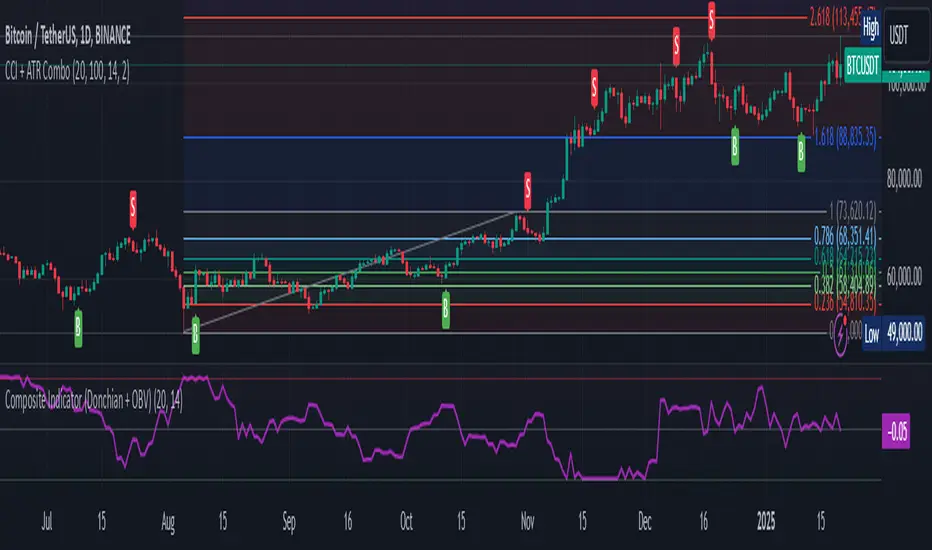
Composite Indicator (Donchian + OBV)Composite Indicator (Donchian + OBV)
The Composite Indicator (Donchian + OBV) is a powerful tool designed to evaluate the strength of market breakouts and momentum trends , offering traders a comprehensive perspective on price action. This indicator combines the Donchian Channel with On-Balance Volume (OBV) to create a dynamic and easy-to-interpret metric scaled between -1 and 1 .
Key Features
Breakout Strength Analysis:
- The indicator assesses the strength of price breakouts relative to the upper and lower bounds of the Donchian Channel.
- Positive values close to 1 indicate a strong bullish breakout.
- Negative values close to -1 indicate a strong bearish breakout.
Momentum Detection with OBV:
- On-Balance Volume (OBV) tracks the cumulative buying and selling volume to gauge market momentum.
- The smoothed OBV trend ensures the momentum component aligns with price action, reducing noise.
Integrated Composite Value:
- Combines breakout strength and OBV momentum into a single metric for enhanced clarity.
- The final composite value highlights whether the market is bullish, bearish, or neutral.
Divergence Detection:
- Spot bullish divergences when the indicator rises while price falls, suggesting a potential upward reversal.
- Identify bearish divergences when the indicator falls while price rises, hinting at a potential downward reversal.
How It Works
Donchian Channel Analysis:
- Calculates the highest high and lowest low over a user-defined period to establish the upper and lower channels .
- Breakouts beyond these channels contribute to the breakout strength component.
OBV Momentum:
- Measures cumulative volume trends to validate price movements.
- Momentum is derived from the rate of change in smoothed OBV values.
Composite Calculation:
- Combines breakout strength and OBV momentum, normalized and scaled to -1 to 1 for clarity.
How to Use
Bullish Breakout:
- When the indicator value approaches 1 , it signals a strong upward breakout supported by positive OBV momentum.
- Example Action: Consider a Buy if price breaks the upper Donchian Channel with increasing OBV.
Bearish Breakout:
- When the indicator value approaches -1 , it indicates a strong downward breakout supported by negative OBV momentum.
- Example Action: Consider a Sell if price breaks the lower Donchian Channel with decreasing OBV.
Neutral Market:
- When the value is near 0 , the market is likely balanced with no significant breakout or momentum detected.
Divergence Opportunities:
- Bullish Divergence: Price makes lower lows, but the indicator trends upward → Potential upward reversal.
- Bearish Divergence: Price makes higher highs, but the indicator trends downward → Potential downward reversal.
Customization Options
Donchian Channel Length: Adjust the period for the upper and lower bounds.
OBV Smoothing Length: Modify the smoothing period for OBV to fine-tune momentum detection.
Scaling Adjustments: The composite value is automatically normalized for consistency across timeframes.
Ideal Use Cases
Breakout Trading: Identify and confirm strong breakouts in volatile markets.
Momentum Confirmation: Validate price movements with volume-based momentum.
Reversal Detection: Leverage divergences to spot potential market reversals.
Example Applications
Strong Bullish Signal:
- Price breaks the upper channel , and OBV shows increasing volume → Composite value near 1 .
- Action: Enter a Buy position and set a Stop Loss below the upper channel.
Strong Bearish Signal:
- Price breaks the lower channel , and OBV shows decreasing volume → Composite value near -1 .
- Action: Enter a Sell position and set a Stop Loss above the lower channel.
Neutral Market:
- Composite value near 0 suggests indecision or consolidation. Wait for a breakout.
Limitations
Best used alongside additional tools like RSI or MACD for filtering noise and improving decision-making.
Requires careful parameter tuning based on the asset and timeframe.
Final Thoughts
The Composite Indicator (Donchian + OBV) offers traders a versatile tool to navigate complex markets. By blending breakout analysis with volume-based momentum, this indicator provides an actionable edge for identifying high-probability opportunities and potential reversals.
Breakaway Fair Value Gaps [LuxAlgo]The Breakaway Fair Value Gap (FVG) is a typical FVG located at a point where the price is breaking new Highs or Lows.
🔶 USAGE
In the screenshot above, the price range is visualized by Donchian Channels.
In theory, the Breakaway FVGs should generally be a good indication of market participation, showing favor in the FVG's breaking direction. This is a combination of buyers or sellers pushing markets quickly while already at the highest high or lowest low in recent history.
While this described reasoning seems conventional, looking into it inversely seems to reveal a more effective use of these formations.
When the price is pushed to the extremities of the current range, the price is already potentially off balance and over-extended. Then an FVG is created, extending the price further out of balance.
With this in consideration, After identifying a Breakaway FVG, we could logically look for a reversion to re-balance the gap.
However, it would be illogical to believe that the FVG will immediately mitigate after formation. Because of this, the dashboard display for this indicator shows the analysis for the mitigation likelihood and timeliness.
In the example above, the information in the dashboard would read as follows (Bearish example):
Out of 949 Bearish Breakaway FVGs, 80.19% are shown to be mitigated within 60 bars, with the average mitigation time being 13 bars.
The other 19.81% are not mitigated within 60 bars. This could mean the FVG was mitigated after 60 bars, or it was never mitigated.
The unmitigated FVGs within the analysis window will extend their mitigation level to the current bar. We can see the number of bars since the formation is represented to the right of the live mitigation level.
Utilizing the current distance readout helps to better judge the likelihood of a level being mitigated.
Additionally, when considering these mitigation levels as targets, an additional indicator or analysis can be used to identify specific entries, which would further aid in a system's reliability.
🔶 SETTINGS
Trend Length: Sets the (DC) Trend length to use for Identifying Breakaway FVGs.
Show Mitigation Levels: Optionally hide mitigation levels if you would prefer only to see the Breakaway FVGs.
Maximum Duration: Sets the analysis duration for FVGs, Past this length in bars, the FVG is counted as "Un-Mitigated".
Show Dashboard: Optionally hide the dashboard.
Use Median Duration: Display the Median of the Bar Length data set rather than the Average.

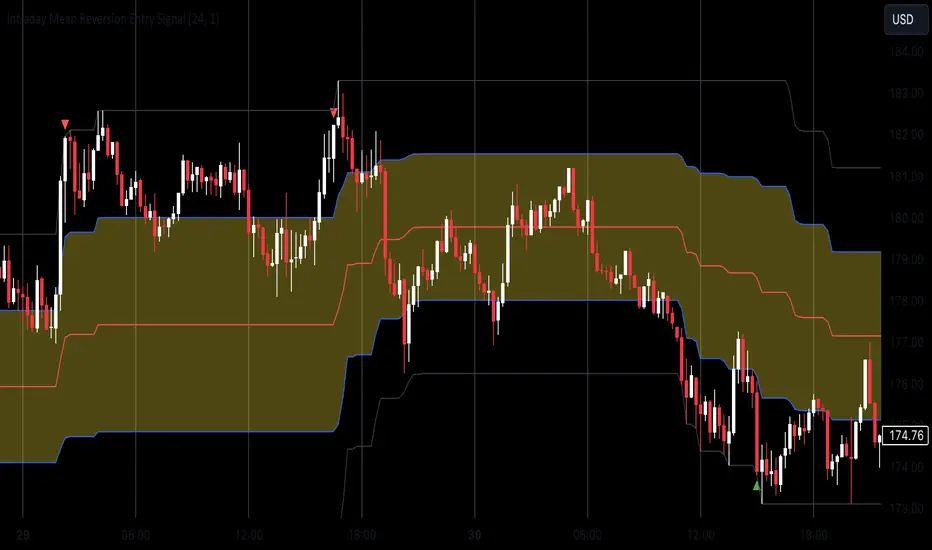
Mean Reversion Entry Signal
Mean Reversion Entry Signal Indicator
The Mean Reversion Entry Signal indicator is a trading tool designed for traders looking to capitalize on market corrections. This script leverages mean reversion principles, utilizing price levels and the Relative Strength Index (RSI) to generate potential entry signals for both long and short positions.
Key Features:
1. **Dynamic Price Levels**:
- The indicator calculates critical price levels over a user-defined lookback period, including:
- High (H)**: The highest price point over the lookback period.
- Low (L)**: The lowest price point over the lookback period.
- Midpoint (M)**: The average of the high and low.
- Midpoint High (Mh)** and **Midpoint Low (Ml)**: Additional reference levels derived from M for more nuanced trading signals.
2. User-Configurable Inputs:
- Lookback Period: Traders can specify the number of hours to look back for the calculations, allowing for tailored analysis that fits various trading strategies. By default the lookback is set for 24 hours, as i consider it the most adequate for day trading.
- Aggression Level: This input lets users choose their trading strategy's intensity, affecting the sensitivity of entry signals based on the percentage difference from the midpoint.
3. Entry Signal Generation:
The script evaluates market conditions to signal potential trades:
- Long Entries: Indicated when the price is below the Ml level and the price demonstrates a significant distance from the midpoint (M), coupled with RSI being near the oversold territory.
- Short Entries: Triggered when the price exceeds the Mh level, also indicating a significant distance from M, while the RSI indicates near overbought conditions.
4. Visual Indicators:
Clear visual signals are plotted directly on the chart:
- Long Signals are represented as upward triangles in green.
- Short Signals appear as downward triangles in red.
- Important price levels (M, H, L, Mh, and Ml) are displayed to provide traders with immediate context for potential trades.
5. No Entry Zone:
The area between Mh and Ml is shaded to indicate a "No Entry Zone," helping traders identify regions where conditions may not be favorable for taking new positions.
This can also be used as potencial profit taking area.
Conclusion
1. This indicator was built mainly for day trading, using timeframes between 1 minute and 1 hour. If you want to use it in 1D time frame, for instance, you should adjust the lookback period to 120 hours or so.
2. To use this as a strategy, you should not be afraid to "add to your losers" as the trade goes against you and the signals continue to appear.
Enjoy
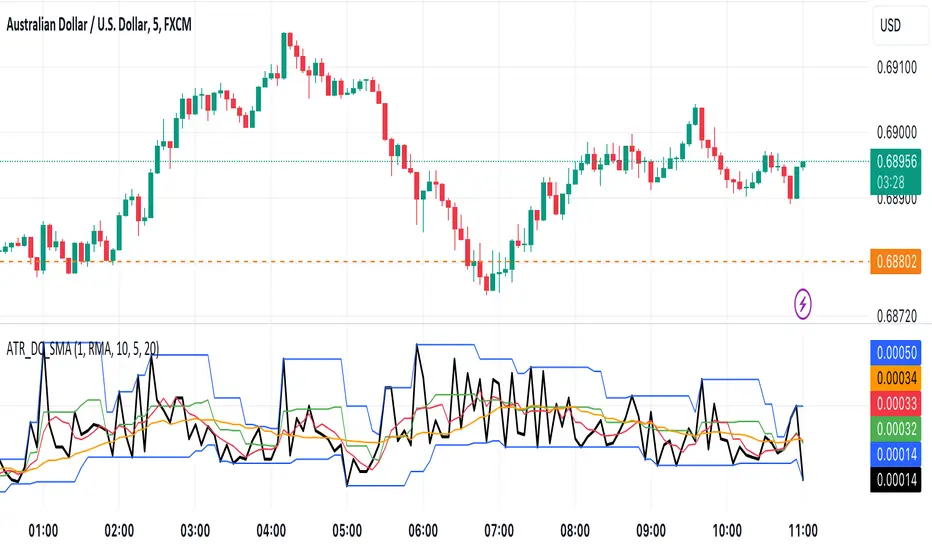
ATR with Donchian Channels and SMAsThis script combines the Average True Range (ATR), Donchian Channels, and Simple Moving Averages (SMAs) to provide a comprehensive tool for volatility and trend analysis.
Key Components:
ATR Calculation: The ATR is used to measure market volatility. It is calculated as a moving average of the true range over a specified length, which you can customize using different smoothing methods: RMA, SMA, EMA, or WMA. ATR helps identify periods of high and low volatility, giving insights into potential breakout or consolidation phases in the market.
Donchian Channels on ATR: The Donchian Channels are calculated based on the highest and lowest values of the ATR over a user-defined period. The upper and lower bands provide a volatility range, and the middle line represents the average of the two. This can help visualize the range of market volatility and detect possible trend reversals or continuations.
SMAs on ATR: Two Simple Moving Averages (SMA) are applied to the ATR values. These SMAs act as a smoothed version of the ATR, providing additional insight into volatility trends. By adjusting the length of these SMAs, you can track short-term and long-term volatility movements, helping in decision-making for potential entries and exits.
Inputs:
ATR Length: Set the length for calculating the ATR.
Smoothing Method: Choose from RMA, SMA, EMA, or WMA for smoothing the ATR calculation.
Donchian Channel Length: Set the length for calculating the highest and lowest ATR values for Donchian Channels.
SMA Lengths: Two adjustable lengths for applying SMAs to the ATR.
Visualization:
ATR Plot: The ATR is plotted in red, allowing you to see the market's volatility at a glance.
Donchian Channels: Blue lines represent the upper and lower bands, while the green line represents the middle line of the Donchian Channels, helping you visualize the volatility range.
SMAs: Two SMAs (green and orange) are plotted to smooth out the ATR and identify trends in volatility.
Use Cases:
Breakout Detection: High ATR values breaking out of the Donchian Channels may signal increased volatility and a potential breakout.
Trend Analysis: SMAs on ATR help smooth volatility trends, aiding in determining if the market is entering a more volatile or stable period.
Stop-Loss Placement: ATR and Donchian Channels can be used to set dynamic stop-loss levels based on market volatility.
This script is versatile and can be used across different asset classes, such as stocks, forex, crypto, and commodities. It is especially useful for traders who want to incorporate volatility into their trading strategies for better risk management and trend detection.
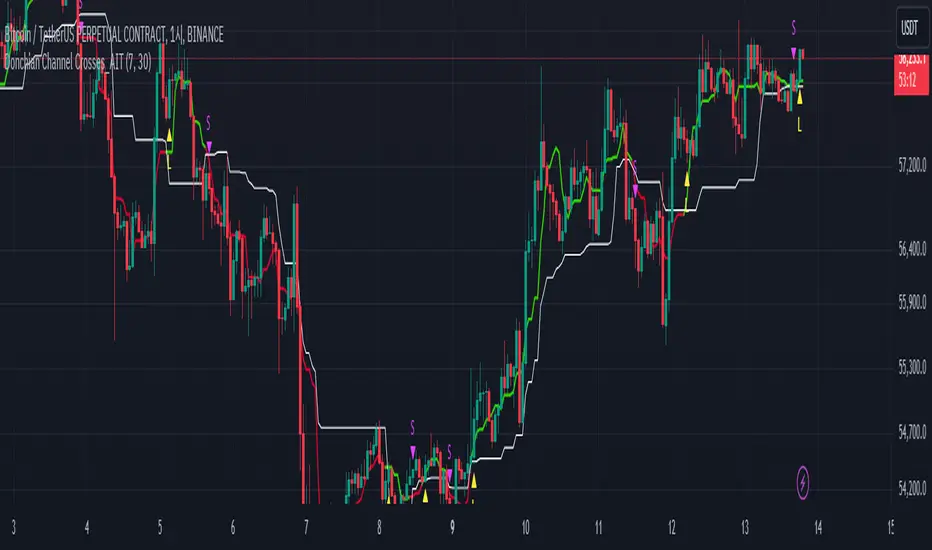
Donchian Channel Crosses_AITIndicator Name: Donchian Channel Crosses_AIT
Programming Language: Pine Script (TradingView)
Description
The Donchian Channel Crosses_AIT indicator is designed to provide trading signals based on the crossover of two Donchian Channels with different lookback periods. The indicator uses two channels, Donchian Channel A (default 7-day period) and Donchian Channel B (default 30-day period), to detect upward or downward momentum shifts. The signals are generated when the middle line of Donchian Channel A crosses above or below the middle line of Donchian Channel B.
Components
Donchian Channel A:
Default period: 7 days (modifiable by the user).
Middle Line: Calculated as the average of the highest high and lowest low over the period.
The middle line changes color depending on its position relative to Donchian Channel B.
Green: When Donchian Channel A's middle line is above Donchian Channel B's middle line.
Red: When Donchian Channel A's middle line is below Donchian Channel B's middle line.
Donchian Channel B:
Default period: 30 days (modifiable by the user).
Middle Line: Also calculated as the average of the highest high and lowest low over the period.
Always displayed as a white line with a line thickness of 1.
Long Signal:
Triggered when the middle line of Donchian Channel A crosses above the middle line of Donchian Channel B.
Displayed as a yellow triangle pointing up (L) below the price bar.
Short Signal:
Triggered when the middle line of Donchian Channel A crosses below the middle line of Donchian Channel B.
Displayed as a fuchsia triangle pointing down (S) above the price bar.
Settings
Donchian Channel A:
Default period: 7 days (modifiable via user input).
Middle line changes color based on its relationship to Donchian Channel B.
Donchian Channel B:
Default period: 30 days (modifiable via user input).
Middle line is always white and displayed with a line thickness of 1.
Signal Display:
Long Signal: A yellow "L" triangle is displayed when Donchian Channel A’s middle line crosses above Donchian Channel B’s middle line.
Short Signal: A fuchsia "S" triangle is displayed when Donchian Channel A’s middle line crosses below Donchian Channel B’s middle line.
Signals can be toggled on or off using the "Show Signals" setting.
Usage
Trend Confirmation:
Use this indicator to confirm trend direction by monitoring the relationship between Donchian Channel A and Donchian Channel B.
Uptrend: When Donchian Channel A’s middle line is above Donchian Channel B’s middle line (green line for Donchian A).
Downtrend: When Donchian Channel A’s middle line is below Donchian Channel B’s middle line (red line for Donchian A).
Entry and Exit Signals:
Long Signal: Enter a buy position when Donchian Channel A crosses above Donchian Channel B.
Short Signal: Enter a sell position when Donchian Channel A crosses below Donchian Channel B.
Visual Representation:
The Donchian Channels are drawn on the price chart, with Donchian Channel A dynamically changing color depending on its relative position to Donchian Channel B.
Curved Price Channels (Zeiierman)█ Overview
The Curved Price Channels (Zeiierman) is designed to plot dynamic channels around price movements, much like the traditional Donchian Channels, but with a key difference: the channels are curved instead of straight. This curvature allows the channels to adapt more fluidly to price action, providing a smoother representation of the highest high and lowest low levels.
Just like Donchian Channels, the Curved Price Channels help identify potential breakout points and areas of trend reversal. However, the curvature offers a more refined approach to visualizing price boundaries, making it potentially more effective in capturing price trends and reversals in markets that exhibit significant volatility or price swings.
The included trend strength calculation further enhances the indicator by offering insight into the strength of the current trend.
█ How It Works
The Curved Price Channels are calculated based on the asset's average true range (ATR), scaled by the chosen length and multiplier settings. This adaptive size allows the channels to expand and contract based on recent market volatility. The central trendline is calculated as the average of the upper and lower curved bands, providing a smoothed representation of the overall price trend.
Key Calculations:
Adaptive Size: The ATR is used to dynamically adjust the width of the channels, making them responsive to changes in market volatility.
Upper and Lower Bands: The upper band is calculated by taking the maximum close value and adjusting it downward by a factor proportional to the ATR and the multiplier. Similarly, the lower band is calculated by adjusting the minimum close value upward.
Trendline: The trendline is the average of the upper and lower bands, representing the central tendency of the price action.
Trend Strength
The Trend Strength feature in the Curved Price Channels is a powerful feature designed to help traders gauge the strength of the current trend. It calculates the strength of a trend by analyzing the relationship between the price's position within the curved channels and the overall range of the channels themselves.
Range Calculation:
The indicator first determines the distance between the upper and lower curved channels, known as the range. This range represents the overall volatility of the price within the given period.
Range = Upper Band - Lower Band
Relative Position:
The next step involves calculating the relative position of the closing price within this range. This value indicates where the current price sits in relation to the overall range.
RelativePosition = (Close - Trendline) / Range
Normalization:
To assess the trend strength over time, the current range is normalized against the maximum and minimum ranges observed over a specified look-back period.
NormalizedRange = (Range - Min Range) / (Max Range - Min Range)
Trend Strength Calculation:
The final Trend Strength is calculated by multiplying the relative position by the normalized range and then scaling it to a percentage.
TrendStrength = Relative Position * Normalized Range * 100
This approach ensures that the Trend Strength not only reflects the direction of the trend but also its intensity, providing a more comprehensive view of market conditions.
█ Comparison with Donchian Channels
Curved Price Channels offer several advantages over Donchian Channels, particularly in their ability to adapt to changing market conditions.
⚪ Adaptability vs. Fixed Structure
Donchian Channels: Use a fixed period to plot straight lines based on the highest high and lowest low. This can be limiting because the channels do not adjust to volatility; they remain the same width regardless of how much or how little the price is moving.
Curved Price Channels: Adapt dynamically to market conditions using the Average True Range (ATR) as a measure of volatility. The channels expand and contract based on recent price movements, providing a more accurate reflection of the market's current state. This adaptability allows traders to capture both large trends and smaller fluctuations more effectively.
⚪ Sensitivity to Market Movements
Donchian Channels: Are less sensitive to recent price action because they rely on a fixed look-back period. This can result in late signals during fast-moving markets, as the channels may not adjust quickly enough to capture new trends.
Curved Price Channels: Respond more quickly to changes in market volatility, making them more sensitive to recent price action. The multiplier setting further allows traders to adjust the channel's sensitivity, making it possible to capture smaller price movements during periods of low volatility or filter out noise during high volatility.
⚪ Enhanced Trend Strength Analysis
Donchian Channels: Do not provide direct insight into the strength of a trend. Traders must rely on additional indicators or their judgment to gauge whether a trend is strong or weak.
Curved Price Channels: Includes a built-in trend strength calculation that takes into account the distance between the upper and lower channels relative to the trendline. A broader range between the channels typically indicates a stronger trend, while a narrower range suggests a weaker trend. This feature helps traders not only identify the direction of the trend but also assess its potential longevity and strength.
⚪ Dynamic Support and Resistance
Donchian Channels: Offer static support and resistance levels that may not accurately reflect changing market dynamics. These levels can quickly become outdated in volatile markets.
Curved Price Channels: Offer dynamic support and resistance levels that adjust in real-time, providing more relevant and actionable trading signals. As the channels curve to reflect price movements, they can help identify areas where the price is likely to encounter support or resistance, making them more useful in volatile or trending markets.
█ How to Use
Traders can use the Curved Price Channels in similar ways to Donchian Channels but with the added benefits of the adaptive, curved structure:
Breakout Identification:
Just like Donchian Channels, when the price breaks above the upper curved band, it may signal the start of a bullish trend, while a break below the lower curved band could indicate a bearish trend. The curved nature of the channels helps in capturing these breakouts more precisely by adjusting to recent volatility.
Volatility:
The width of the price channels in the Curved Price Channels indicator serves as a clear indicator of current market volatility. A wider channel indicates that the market is experiencing higher volatility, as prices are fluctuating more dramatically within the period. Conversely, a narrower channel suggests that the market is in a lower volatility state, with price movements being more subdued.
Typically, higher volatility is observed during negative trends, where market uncertainty or fear drives larger price swings. In contrast, lower volatility is often associated with positive trends, where prices tend to move more steadily and predictably. The adaptive nature of the Curved Price Channels reflects these volatility conditions in real time, allowing traders to assess the market environment quickly and adjust their strategies accordingly.
Support and Resistance:
The trend line act as dynamic support and resistance levels. Due to it's adaptive nature, this level is more reflective of the current market environment than the fixed level of Donchian Channels.
Trend Direction and Strength:
The trend direction and strength are highlighted by the trendline and the directional candle within the Curved Price Channels indicator. If the price is above the trendline, it indicates a positive trend, while a price below the trendline signals a negative trend. This directional bias is visually represented by the color of the directional candle, making it easy for traders to quickly identify the current market trend.
In addition to the trendline, the indicator also displays Max and Min values. These represent the highest and lowest trend strength values within the lookback period, providing a reference point for understanding the current trend strength relative to historical levels.
Max Value: Indicates the highest recorded trend strength during the lookback period. If the Max value is greater than the Min value, it suggests that the market has generally experienced more positive (bullish) conditions during this time frame.
Min Value: Represents the lowest recorded trend strength within the same period. If the Min value is greater than the Max value, it indicates that the market has been predominantly negative (bearish) over the lookback period.
By assessing these Max and Min values, traders gain an immediate understanding of the underlying trend. If the current trend strength is close to the Max value, it indicates a strong bullish trend. Conversely, if the trend strength is near the Min value, it suggests a strong bearish trend.
█ Settings
Trend Length: Defines the number of bars used to calculate the core trendline and adaptive size. A length of 200 will create a smooth, long-term trendline that reacts slowly to price changes, while a length of 20 will create a more responsive trendline that tracks short-term movements.
Multiplier: Adjusts the width of the curved price channels. A higher value tightens the channels, making them more sensitive to price movements, while a lower value widens the channels. A multiplier of 10 will create tighter channels that are more sensitive to minor price fluctuations, which is useful in low-volatility markets. A multiplier of 2 will create wider channels that capture larger trends and are better suited for high-volatility markets.
Trend Strength Length: Defines the period over which the maximum and minimum ranges are calculated to normalize the trend strength. A length of 200 will smooth out the trend strength readings, providing a stable indication of trend health, whereas a length of 50 will make the readings more reactive to recent price changes.
-----------------
Disclaimer
The information contained in my Scripts/Indicators/Ideas/Algos/Systems does not constitute financial advice or a solicitation to buy or sell any securities of any type. I will not accept liability for any loss or damage, including without limitation any loss of profit, which may arise directly or indirectly from the use of or reliance on such information.
All investments involve risk, and the past performance of a security, industry, sector, market, financial product, trading strategy, backtest, or individual's trading does not guarantee future results or returns. Investors are fully responsible for any investment decisions they make. Such decisions should be based solely on an evaluation of their financial circumstances, investment objectives, risk tolerance, and liquidity needs.
My Scripts/Indicators/Ideas/Algos/Systems are only for educational purposes!

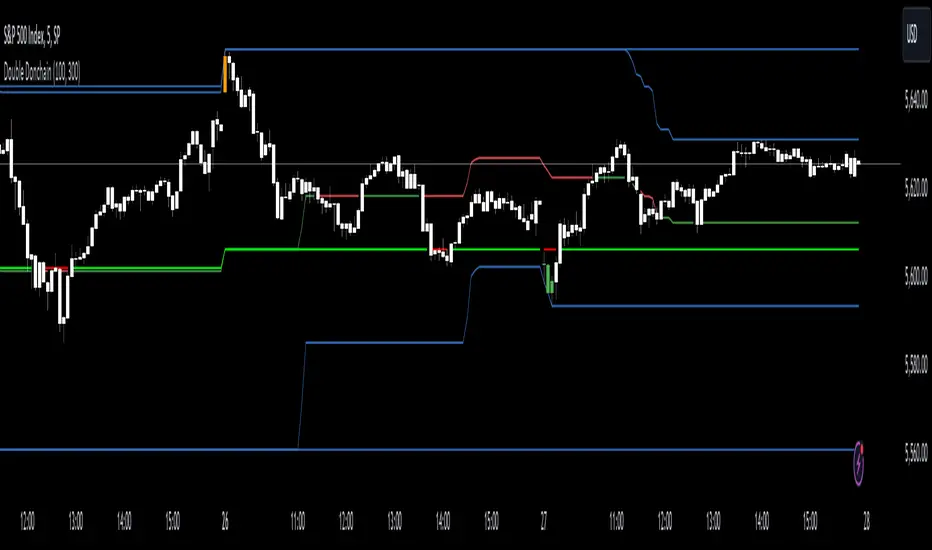
Double Donchian Channels [CrossTrade]Dual Channel System
The indicator incorporates two Donchian Channels - the Inner Channel and the Outer Channel. These channels are adjustable, allowing users to define their lengths according to their trading strategy.
Inner Channel: With a default length of 100 periods, the Inner Channel provides a closer view of market trends and potential support and resistance areas. It includes an upper, lower, and middle line (average of the upper and lower), offering detailed insights into shorter-term price movements.
Outer Channel: Set with a default length of 300 periods, the Outer Channel offers a broader perspective, ideal for identifying long-term trends and stronger levels of support and resistance.
Dynamic Color Coding: The middle lines of both channels change color based on the relationship between the previous close and the channel's basis. This feature provides an immediate visual cue regarding market sentiment.
Touching Bars Highlighting: The indicator highlights bars that touch the upper or lower bands of either channel. This is particularly useful for identifying potential reversals or continuation patterns.
Pullback Identification: By differentiating between bars that touch the Inner Channel only and those that touch the Outer Channel, the indicator helps in identifying pullbacks within a broader trend.
Customizable Alert System: Users can set up alerts for specific conditions - a bar touching the bottom band of the Inner Channel (green), the bottom band of the Outer Channel (blue), the upper band of the Inner Channel (red), and the upper band of the Outer Channel (orange). These alerts assist in timely decision-making and can be tailored to individual trading styles.
The indicator is a versatile tool designed to adapt to various trading styles and timeframes. Its features make it suitable for trend analysis, identifying potential reversal points, and understanding market volatility.
Luxmi AI Filtered Option Scalping Signals (INDEX)Introduction:
Luxmi AI Filtered Option Scalping Signals (INDEX) is an enhanced iteration of the Luxmi AI Directional Option Buying (Long Only) indicator. It's designed for use on index charts alongside the Luxmi AI Smart Sentimeter (INDEX) indicator to enhance performance. This indicator aims to provide refined signals for option scalping strategies, optimizing trading decisions within index markets.
Understanding directional bias is crucial when trading index and index options because it helps traders align their strategies with the expected movement of the underlying index.
The Luxmi AI Filtered Option Scalping Signals (INDEX) indicator aims to simplify and expedite decision-making through comprehensive technical analysis of various data points on a chart. By leveraging advanced analysis of data points, this indicator scrutinizes multiple factors simultaneously to offer traders clear and rapid insights into market dynamics.
The indicator is specifically designed for option scalping, a trading strategy that aims to profit from short-term price fluctuations. It prioritizes signals that are conducive to quick execution and capitalizes on rapid market movements typical of scalping strategies.
Major Features:
Trend Cloud:
Working Principle:
The script utilizes the Relative Strength Index (RSI) to assess market momentum, identifying bullish and bearish phases based on RSI readings. It calculates two boolean variables, bullmove and bearmove, which signal shifts in momentum direction by considering changes in the Exponential Moving Average (EMA) of the closing price. When RSI indicates bullish momentum and the closing price's EMA exhibits positive changes, bullmove is triggered, signifying the start of a bullish phase. Conversely, when RSI suggests bearish momentum and the closing price's EMA shows negative changes, bearmove is activated, marking the beginning of a bearish phase. This systematic approach helps in understanding the current trend of the price. The script visually emphasizes these phases on the chart using plot shape markers, providing traders with clear indications of trend shifts.
Benefits of Using Trend Cloud:
Comprehensive Momentum Assessment: The script offers a holistic view of market momentum by incorporating RSI readings and changes in the closing price's EMA, enabling traders to identify both bullish and bearish phases effectively.
Structured Trend Recognition: With the calculation of boolean variables, the script provides a structured approach to recognizing shifts in momentum direction, enhancing traders' ability to interpret market dynamics.
Visual Clarity: Plotshape markers visually highlight the start and end of bullish and bearish phases on the chart, facilitating easy identification of trend shifts and helping traders to stay informed.
Prompt Response: Traders can promptly react to changing market conditions as the script triggers alerts when bullish or bearish phases begin, allowing them to seize potential trading opportunities swiftly.
Informed Decision-Making: By integrating various indicators and visual cues, the script enables traders to make well-informed decisions and adapt their strategies according to prevailing market sentiment, ultimately enhancing their trading performance.
How to use this feature:
The most effective way to maximize the benefits of this feature is to use it in conjunction with other key indicators and visual cues. By combining the color-coded clouds, which indicate bullish and bearish sentiment, with other features such as IS candles, microtrend candles, volume candles, and sentimeter candles, traders can gain a comprehensive understanding of market dynamics. For instance, aligning the color of the clouds with the trend direction indicated by IS candles, microtrend candles, and sentimeter candles can provide confirmation of trend strength or potential reversals.
Furthermore, traders can leverage the trend cloud as a trailing stop-loss tool for long entries, enhancing risk management strategies. By adjusting the stop-loss level based on the color of the cloud, traders can trail their positions to capture potential profits while minimizing losses. For long entries, maintaining the position as long as the cloud remains green can help traders stay aligned with the prevailing bullish sentiment. Conversely, a shift in color from green to red serves as a signal to exit the position, indicating a potential reversal in market sentiment and minimizing potential losses. This integration of the trend cloud as a trailing stop-loss mechanism adds an additional layer of risk management to trading strategies, increasing the likelihood of successful trades while reducing exposure to adverse market movements.
Moreover, the red cloud serves as an indicator of decay in option premiums and potential theta effect, particularly relevant for options traders. When the cloud turns red, it suggests a decline in option prices and an increase in theta decay, highlighting the importance of managing options positions accordingly. Traders may consider adjusting their options strategies, such as rolling positions or closing out contracts, to mitigate the impact of theta decay and preserve capital. By incorporating this insight into options pricing dynamics, traders can make more informed decisions about their options trades.
Scalping Cloud:
The scalping cloud serves as a specialized component within the trend cloud feature, specifically designed to pinpoint potential long and short entry points within the overarching trend cloud. Here's how it works:
Trend Identification: The trend cloud feature typically highlights the prevailing trend direction based on various technical indicators, price action, or other criteria. It visually represents the momentum and direction of the market over a given period.
Refined Entry Signals: Within this broader trend context, the scalping cloud narrows its focus to identify shorter-term trading opportunities. It does this by analyzing more granular price movements and shorter timeframes, seeking out potential entry points that align with the larger trend.
Long and Short Entries: The scalping cloud distinguishes between potential long (buy) and short (sell) entry opportunities within the trend cloud. For instance, within an uptrend indicated by the trend cloud, the scalping cloud might identify brief retracements or pullbacks as potential long entry points. Conversely, in a downtrend, it may signal short entry opportunities during temporary upward corrections.
Risk Management: By identifying potential entry points within the context of the trend, the scalping cloud also aids in risk management. Traders can use these signals to place stop-loss orders and manage their positions effectively, reducing the risk of adverse price movements.
The scalping cloud operates by analyzing the crossover and crossunder events between two key indicators: the Double Exponential Moving Average (DEMA) and a Weighted Average. Here's how it works:
Double Exponential Moving Average (DEMA): DEMA is a type of moving average that seeks to reduce lag by applying a double smoothing technique to price data. It responds more quickly to price changes compared to traditional moving averages, making it suitable for identifying short-term trends and potential trading opportunities.
Weighted Average: The weighted average calculates the average price of an asset over a specified period. However, it incorporates a weighting scheme that assigns more significance to recent price data, resulting in a more responsive indicator that closely tracks current market trends.
CE and NO CE Signals:
CE signals typically represent a Long Scalping Opportunity, suggesting that conditions are favorable for entering a long position. These signals indicate a strong upward momentum in the market, which traders can exploit for short-term gains through scalping strategies.
On the other hand, when there are no CE signals present, it doesn't necessarily mean that the trend has reversed or turned bearish. Instead, it indicates that the trend is still bullish, but the market is experiencing an active pullback. During a pullback, prices may temporarily retreat from recent highs as traders take profits or reevaluate their positions. While the overall trend remains upward, the pullback introduces a degree of uncertainty, making it less favorable for entering new long positions.
In such a scenario, traders may opt to exercise caution and refrain from entering new long positions until the pullback phase has concluded. Instead, they might consider waiting for confirmation signals, such as the resumption of CE signals or other bullish indications, before reengaging in long positions.
PE and NO PE Signals:
PE signals typically indicate a Short Entry opportunity, signaling that market conditions are conducive to entering a short position.
Conversely, when there are no PE signals present, it signifies that while the trend remains bearish, the market is currently in an active phase of consolidation or pullback. During such periods, prices may temporarily rise from recent lows, reflecting a pause in the downward momentum. While the overall trend remains downward, the absence of PE signals suggests that it may not be an optimal time to enter new short positions.
In this context, traders may exercise caution and wait for clearer signals before initiating new short positions. They might monitor the market closely for signs of a resumption in bearish momentum, such as the emergence of PE signals or other bearish indications. Alternatively, traders may choose to wait on the sidelines until market conditions stabilize or provide clearer directional signals.
Working Principle Of CE and PE Signals:
The feature calculates candlestick values based on the open, high, low, and close prices of each bar. By comparing these derived candlestick values, it determines whether the current candlestick is bullish or bearish. Additionally, it signals when there is a change in the color (bullish or bearish) of the derived candlesticks compared to the previous bar, enabling traders to identify potential shifts in market sentiment.
Micro Trend Candles:
Working Principle:
This feature begins by initializing variables to determine trend channel width and track price movements. Average True Range (ATR) is then calculated to measure market volatility, influencing the channel's size. Highs and lows are identified within a specified range, and trends are assessed based on price breaches, with potential changes signaled accordingly. The price channel is continually updated to adapt to market shifts, and arrows are placed to indicate potential entry points. Colors are assigned to represent bullish and bearish trends, dynamically adjusting based on current market conditions. Finally, candles on the chart are colored to visually depict the identified micro trend, offering traders an intuitive way to interpret market sentiment and potential entry opportunities.
Benefits of using Micro Trend Candles:
Traders can use these identified micro trends to spot potential short-term trading opportunities. For example:
Trend Following: Traders may decide to enter trades aligned with the prevailing micro trend. If the candles are consistently colored in a certain direction, traders may consider entering positions in that direction.
Reversals: Conversely, if the script signals a potential reversal by changing the candle colors, traders may anticipate trend reversals and adjust their trading strategies accordingly. For instance, they might close existing positions or enter new positions in anticipation of a trend reversal.
It's important to note that these micro trends are short-term in nature and may not always align with broader market trends. Therefore, traders utilizing this script should consider their trading timeframes and adjust their strategies accordingly.
How to use this feature:
This feature assigns colors to candles to represent bullish and bearish trends, with adjustments made based on current market conditions. Green candles accompanied by a green trend cloud signal a potential long entry, while red candles suggest caution, indicating a bearish trend. This visual representation allows traders to interpret market sentiment intuitively, identifying optimal entry points and exercising caution during potential downtrends.
Scalping Candles (Inspired by Elliott Wave and Open Interest Concepts):
Working Principle:
This feature draws inspiration from the Elliot Wave method, utilizing technical analysis techniques to discern potential market trends and sentiment shifts. It begins by calculating the variance between two Exponential Moving Averages (EMAs) of closing prices, mimicking Elliot Wave's focus on wave and trend analysis. The shorter-term EMA captures immediate price momentum, while the longer-term EMA reflects broader market trends. A smoother Exponential Moving Average (EMA) line, derived from the difference between these EMAs, aids in identifying short-term trend shifts or momentum reversals.
Benefits of using Scalping Candles Inspired by Elliott Wave:
The Elliott Wave principle is a form of technical analysis that attempts to predict future price movements by identifying patterns in market charts. It suggests that markets move in repetitive waves or cycles, and traders can potentially profit by recognizing these patterns.
While this script does not explicitly analyze Elliot Wave patterns, it is inspired by the principle's emphasis on trend analysis and market sentiment. By calculating and visualizing the difference between EMAs and assigning colors to candles based on this analysis, the script aims to provide traders with insights into potential market sentiment shifts, which can align with the broader philosophy of Elliott Wave analysis.
How to use this feature:
Candlestick colors are assigned based on the relationship between the EMA line and the variance. When the variance is below or equal to the EMA line, candles are colored red, suggesting a bearish sentiment. Conversely, when the variance is above the EMA line, candles are tinted green, indicating a bullish outlook. Though not explicitly analyzing Elliot Wave patterns, the script aligns with its principles of trend analysis and market sentiment interpretation. By offering visual cues on sentiment shifts, it provides traders with insights into potential trading opportunities, echoing Elliot Wave's emphasis on pattern recognition and trend analysis.
Chart Timeframe Support and Resistance:
Working Principle:
This feature serves to identify and visualize support and resistance levels on the chart, primarily based on the chosen Chart Timeframe (CTF). It allows users to specify parameters such as the number of bars considered on the left and right sides of each pivot point, as well as line width and label color. Moreover, users have the option to enable or disable the display of these levels. By utilizing functions to calculate pivot highs and lows within the specified timeframe, the script determines the highest high and lowest low surrounding each pivot point.
Additionally, it defines functions to create lines and labels for each detected support and resistance level. Notably, this feature incorporates a trading method that emphasizes the concept of resistance turning into support after breakouts, thereby providing valuable insights for traders employing such strategies. These lines are drawn on the chart, with colors indicating whether the level is above or below the current close price, aiding traders in visualizing key levels and making informed trading decisions.
Benefits of Chart Timeframe Support and Resistance:
Identification of Price Levels: Support and resistance levels help traders identify significant price levels where buying (support) and selling (resistance) pressure may intensify. These levels are often formed based on historical price movements and are regarded as areas of interest for traders.
Decision Making: Support and resistance levels assist traders in making informed trading decisions. By observing price reactions near these levels, traders can gauge market sentiment and adjust their strategies accordingly. For example, traders may choose to enter or exit positions, set stop-loss orders, or take profit targets based on price behavior around these levels.
Risk Management: Support and resistance levels aid in risk management by providing reference points for setting stop-loss orders. Traders often place stop-loss orders below support levels for long positions and above resistance levels for short positions to limit potential losses if the market moves against them.
How to use this feature:
Planning Long Positions: When considering long positions, it's advantageous to strategize when the price is in proximity to a support level identified by the script. This suggests a potential area of buying interest where traders may expect a bounce or reversal in price. Additionally, confirm the bullish bias by ensuring that the trend cloud is green, indicating favorable market conditions for long trades.
Waiting for Breakout: If long signals are generated near resistance levels detected by the script, exercise patience and wait for a breakout above the resistance. A breakout above resistance signifies potential strength in the upward momentum and may present a more opportune moment to enter long positions. This approach aligns with trading methodologies that emphasize confirmation of bullish momentum before initiating trades.
StopLoss and Target Lines:
In addition to generating entry signals, this indicator also incorporates predefined stop-loss ray lines and configurable risk-reward (R:R) target lines to enhance risk management and profit-taking strategies. Here's how these features work:
Predefined Stop-loss Ray Lines: The indicator automatically plots stop-loss ray lines on the chart, serving as visual guidelines for setting stop-loss levels. These stop-loss lines are predetermined based on specific criteria, such as volatility levels, support and resistance zones, or predefined risk parameters. Traders can use these lines as reference points to place their stop-loss orders, aiming to limit potential losses if the market moves against their position.
Configurable Risk-Reward (R:R) Target Lines: In addition to stop-loss lines, the indicator allows traders to set configurable risk-reward (R:R) target lines on the chart. These target lines represent predefined price levels where traders intend to take profits based on their desired risk-reward ratio. By adjusting the placement of these lines, traders can customize their risk-reward ratios according to their trading preferences and risk tolerance.
Risk Management: The predefined stop-loss ray lines help traders manage risk by providing clear exit points if the trade goes against their expectations. By adhering to these predetermined stop-loss levels, traders can minimize potential losses and protect their trading capital, thereby enhancing overall risk management.
Profit-taking Strategy: On the other hand, the configurable R:R target lines assist traders in establishing profit-taking strategies. By setting target levels based on their desired risk-reward ratio, traders can aim to capture profits at predefined price levels that offer favorable risk-reward profiles. This allows traders to systematically take profits while ensuring that potential gains outweigh potential losses over the long term.
The stop-loss and target lines incorporated in this indicator are dynamic in nature, providing traders with the flexibility to utilize them as trailing stop-loss and extended take-profit targets. Here's how these dynamic features work:
Trailing Stop-loss: Traders can employ the stop-loss lines as trailing stop-loss levels, allowing them to adjust their stop-loss orders as the market moves in their favor. As the price continues to move in the desired direction, indicator can dynamically adjust the stop-loss line to lock in profits while still allowing room for potential further gains. This trailing stop-loss mechanism helps traders secure profits while allowing their winning trades to continue running as long as the market remains favorable.
Extended Take Profit Targets: Similarly, traders can utilize the target lines as extended take-profit targets, enabling them to capture additional profits beyond their initial profit targets. By adjusting the placement of these target lines based on evolving market conditions or technical signals, traders can extend their profit-taking strategy to capitalize on potential price extensions or trend continuations. This flexibility allows traders to maximize their profit potential by capturing larger price movements while managing their risk effectively.
Rangebound Bars:
When the Rangebound Bars feature is enabled, the indicator represents candles in a distinct purple color to visually denote periods of sideways or range-bound price action. This visual cue helps traders easily identify when the market is consolidating and lacking clear directional momentum. Here's how it works:
Purple Candle Color: When the Rangebound Bars feature is active, the indicator displays candlesticks in a purple color to highlight periods of sideways price movement. This color differentiation stands out against the usual colors used for bullish (e.g., green or white) and bearish (e.g., red or black) candles, making it easier for traders to recognize range-bound conditions at a glance.
Signaling Sideways Price Action: The purple coloration of candles indicates that price movements are confined within a relatively narrow range and lack a clear upward or downward trend. This may occur when the market is consolidating, experiencing indecision, or undergoing a period of accumulation or distribution.
Working Principle:
The Rangebound Bars feature of this indicator is designed to assist traders in identifying and navigating consolidating market conditions, where price movements are confined within a relatively narrow range. This feature utilizes Pivot levels and the Average True Range (ATR) concept to determine when the market is range-bound and provides signals to stay out of such price action. Here's how it works:
Pivot Levels: Pivot levels are key price levels derived from the previous period's high, low, and closing prices. They serve as potential support and resistance levels and are widely used by traders to identify significant price levels where price action may stall or reverse. The Rangebound Bars feature incorporates Pivot levels into its analysis to identify ranges where price tends to consolidate.
Average True Range (ATR): The Average True Range is a measure of market volatility that calculates the average range between the high and low prices over a specified period. It provides traders with insights into the level of price volatility and helps set appropriate stop-loss and take-profit levels. In the context of the Rangebound Bars feature, ATR is used to gauge the extent of price fluctuations within the identified range.

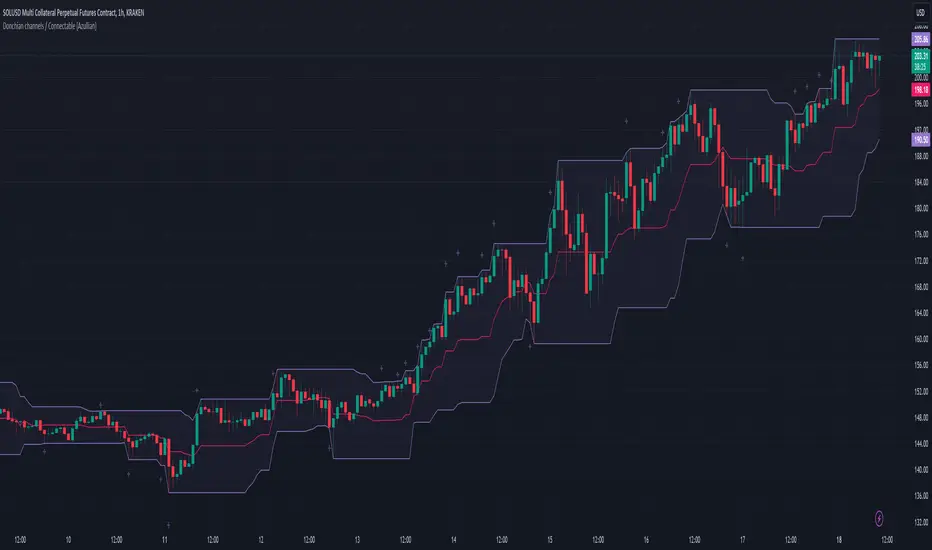
Donchian channels / Connectable [Azullian]Refine your breakout trading techniques with Donchian Channels. Accurately pinpoint significant highs and lows, enhancing your capacity to detect and react to key market movements.
This connectable Donchian channels indicator is part of an indicator system designed to help test, visualize and build strategy configurations without coding. Like all connectable indicators , it interacts through the TradingView input source, which serves as a signal connector to link indicators to each other. All connectable indicators send signal weight to the next node in the system until it reaches either a connectable signal monitor, signal filter and/or strategy.
█ UNIFORM SETTINGS AND A WAY OF WORK
Although connectable indicators may have specific weight scoring conditions, they all aim to follow a standardized general approach to weight scoring settings, as outlined below.
■ Connectable indicators - Settings
• 🗲 Energy: Energy applies an ATR multiplier to the plotted shapes on the chart. A higher value plots shapes farther away from the candle, enhancing visibility.
• ☼ Brightness: Brightness determines the opacity of the shape plotted on the chart, aiding visibility. Indicator weight also influences opacity.
• → Input: Use the input setting to specify a data source for the indicator. Here you can connect the indicator to other indicators.
• ⌥ Flow: Determine where you want to receive signals from:
○ Both: Weights from this indicator and the connected indicator will apply
○ Indicator only: Only weights from this indicator will apply
○ Input only: Only weights from the connected indicator will apply
• ⥅ Weight multiplier: Multiply all weights in the entire indicator by a given factor, useful for quickly testing different indicators in a granular setup.
• ⥇ Threshold: Set a threshold to indicate the minimum amount of weight it should receive to pass it through to the next indicator.
• ⥱ Limiter: Set a hard limit to the maximum amount of weight that can be fed through the indicator.
■ Connectable indicators - Weight scoring settings
▢ Weight scoring conditions
• SM – Signal mode: Enable specific conditions for weight scoring
○ All: All signals will be scored.
○ Entries only: Only entries will score
○ Exits only: Only exits will score.
○ Entries & exits: Both entries and exits will score.
○ Zone: Continuous scoring for each candle within the zone.
• SP – Signal period: Defines a range of candles within which a signal can score.
• SC - Signal count: Specifies the number of bars to retrospectively examine and score.
○ Single: Score for a single occurrence
○ All occurrences: Score for all occurrences
○ Single + Threshold: Score for single occurrences within the signal period (SP)
○ Every + Threshold: Score for all occurrences within the signal period (SP)
▢ Weight scoring direction
• ES: Enter Short weight
• XL: Exit long weight
• EL: Enter Long weight
• XS: Exit Short weight
▢ Weight scoring values
• Weights can hold either positive or negative scores. Positive weights enhance a particular trading direction, while negative weights diminish it.
█ Donchian channels - INDICATOR SETTINGS
■ Main settings
• Enable/Disable Indicator: Toggle the entire indicator on or off.
• S - Source: Choose an alternative data source for the Donchian channels calculation.
• T - Timeframe: Select an alternative timeframe for the Donchian channels calculation.
• LE - Length: Determine the period the Donchian channels are calculated on
• Enable/Disable plotting: Toggle the plotting of the Donchian channels
• U: Choose a color for the upper band
• B: Choose a color for the basis
• L: Choose a color for the lower band
• BG: Choose a color for Donchian channels background
■ Scoring functionality
• The Donchian channels score long entries when the current low price is equal to lower band.
• The Donchian channels score long exits when the current high price is equal to the upper band.
• The Donchian channels score long zones the entire time the current low price is equal to the lower band.
• The Donchian channels score short entries when the current high is equal to the upper band.
• The Donchian channels score short exits when the current low is equal to the lower band.
• The Donchian channels score short zones the entire time the current high price is equal to the upper band.
█ PLOTTING
• Standard: Symbols (EL, XS, ES, XL) appear relative to candles based on set conditions. Their opacity and position vary with weight.
• Conditional Settings: A larger icon appears if global conditions are met. For instance, with a Threshold(⥇) of 12, Signal Period (SP) of 3, and Scoring Condition (SC) set to "EVERY", a Donchian channels signaling over two times in 3 candles (scoring 6 each) triggers a larger icon.
█ USAGE OF CONNECTABLE INDICATORS
■ Connectable chaining mechanism
Connectable indicators can be connected directly to the signal monitor, signal filter or strategy , or they can be daisy chained to each other while the last indicator in the chain connects to the signal monitor, signal filter or strategy. When using a signal filter you can chain the filter to the strategy input to make your chain complete.
• Direct chaining: Connect an indicator directly to the signal monitor, signal filter or strategy through the provided inputs (→).
• Daisy chaining: Connect indicators using the indicator input (→). The first in a daisy chain should have a flow (⌥) set to 'Indicator only'. Subsequent indicators use 'Both' to pass the previous weight. The final indicator connects to the signal monitor, signal filter, or strategy.
■ Set up this indicator with a signal filter and strategy
The indicator provides visual cues based on signal conditions. However, its weight system is best utilized when paired with a connectable signal filter, signal monitor, or strategy .
Let's connect the Donchian channels to a connectable signal filter and a strategy :
1. Load all relevant indicators
• Load Donchian channels / Connectable
• Load Signal filter / Connectable
• Load Strategy / Connectable
2. Signal Filter: Connect the Donchian channels to the Signal Filter
• Open the signal filter settings
• Choose one of the three input dropdowns (1→, 2→, 3→) and choose : Donchian channels / Connectable: Signal Connector
• Toggle the enable box before the connected input to enable the incoming signal
3. Signal Filter: Update the filter signals settings if needed
• The default settings of the filter enable EL (Enter Long), XL (Exit Long), ES (Enter Short) and XS (Exit Short).
4. Signal Filter: Update the weight threshold settings if needed
• All connectable indicators load by default with a score of 6 for each direction (EL, XL, ES, XS)
• By default, weight threshold (TH) is set at 5. This allows each occurrence to score, as the default score in each connectable indicator is 1 point above the threshold. Adjust to your liking.
5. Strategy: Connect the strategy to the signal filter in the strategy settings
• Select a strategy input → and select the Signal filter: Signal connector
6. Strategy: Enable filter compatible directions
• Set the signal mode of the strategy to a compatible direction with the signal filter.
Now that everything is connected, you'll notice green spikes in the signal filter representing long signals, and red spikes indicating short signals. Trades will also appear on the chart, complemented by a performance overview. Your journey is just beginning: delve into different scoring mechanisms, merge diverse connectable indicators, and craft unique chains. Instantly test your results and discover the potential of your configurations. Dive deep and enjoy the process!
█ BENEFITS
• Adaptable Modular Design: Arrange indicators in diverse structures via direct or daisy chaining, allowing tailored configurations to align with your analysis approach.
• Streamlined Backtesting: Simplify the iterative process of testing and adjusting combinations, facilitating a smoother exploration of potential setups.
• Intuitive Interface: Navigate TradingView with added ease. Integrate desired indicators, adjust settings, and establish alerts without delving into complex code.
• Signal Weight Precision: Leverage granular weight allocation among signals, offering a deeper layer of customization in strategy formulation.
• Advanced Signal Filtering: Define entry and exit conditions with more clarity, granting an added layer of strategy precision.
• Clear Visual Feedback: Distinct visual signals and cues enhance the readability of charts, promoting informed decision-making.
• Standardized Defaults: Indicators are equipped with universally recognized preset settings, ensuring consistency in initial setups across different types like momentum or volatility.
• Reliability: Our indicators are meticulously developed to prevent repainting. We strictly adhere to TradingView's coding conventions, ensuring our code is both performant and clean.
█ COMPATIBLE INDICATORS
Each indicator that incorporates our open-source 'azLibConnector' library and adheres to our conventions can be effortlessly integrated and used as detailed above.
For clarity and recognition within the TradingView platform, we append the suffix ' / Connectable' to every compatible indicator.
█ COMMON MISTAKES, CLARIFICATIONS AND TIPS
• Removing an indicator from a chain: Deleting a linked indicator and confirming the "remove study tree" alert will also remove all underlying indicators in the object tree. Before removing one, disconnect the adjacent indicators and move it to the object stack's bottom.
• Point systems: The azLibConnector provides 500 points for each direction (EL: Enter long, XL: Exit long, ES: Enter short, XS: Exit short) Remember this cap when devising a point structure.
• Flow misconfiguration: In daisy chains the first indicator should always have a flow (⌥) setting of 'indicator only' while other indicator should have a flow (⌥) setting of 'both'.
• Hide attributes: As connectable indicators send through quite some information you'll notice all the arguments are taking up some screenwidth and cause some visual clutter. You can disable arguments in Chart Settings / Status line.
• Layout and abbreviations: To maintain a consistent structure, we use abbreviations for each input. While this may initially seem complex, you'll quickly become familiar with them. Each abbreviation is also explained in the inline tooltips.
• Inputs: Connecting a connectable indicator directly to the strategy delivers the raw signal without a weight threshold, meaning every signal will trigger a trade.
█ A NOTE OF GRATITUDE
Through years of exploring TradingView and Pine Script, we've drawn immense inspiration from the community's knowledge and innovation. Thank you for being a constant source of motivation and insight.
█ RISK DISCLAIMER
Azullian's content, tools, scripts, articles, and educational offerings are presented purely for educational and informational uses. Please be aware that past performance should not be considered a predictor of future results.
Donchian Channel Trend MeterInspired by the Chande Trend Meter (this is not the Chande Trend Meter), this indicator aims to show the trend so you can make trading decisions accordingly. This is calculated by looking at Donchian Channels over a number of lengths (20, 40, 60 periods, etc.), converting them to percent, and then applying a weighting and smoothing similar to the Know Sure Thing Indicator. This results in smooth trend line that is not disturbed by large fluctuations in price action.
When the line is below 20%, you have a strong down trend. Values between 20 - 40% are a weak down trend. Values between 40 - 60% are no trend (slightly bullish or bearish if above or below 50%). Similarly, 60 - 80% is a weak uptrend, and above 80% is a strong uptrend. Trade signals can be turned on or off that correspond to crosses over 50%. It can be useful in spotting divergence.

Donchian Channels StrengthTL;DR - A different approach calculating strength based on Donchain channels
My approach calculating strength by using the difference between price and donchain average. It is possible to use the highest/lowest value of a given source (like close) or to use the highest high/lowest low (by using the option 'include wicks') for the strength calculation
I added multiple moving averages which can be used in the calculations incl. SMMA (RMA) which is used in RSI calculation and works best for me.
Usage is similar to RSI: DC Strength oscillates between 0 and 100. Low values (<20) indicate a bearish situation while high values (>80) indicate bullish ones. Center line (50) crossings can also indicate a possible trend change.

Donchian Channels %I enjoy Donchian Channels for identifying trends. However, I hate having them on my chart. They are next to impossible to interpret at a glance. This script converts DCs to a % making a useful oscillator. The horizontal lines on the chart correspond to the Fib retracements below 50%. There are many ways to trade using this script and it works on any time frame. Moving average crosses are worth your attention, particularly, the 34 period MA (purple line). Enjoy and happy trading.
GKD-C Turtle Trading Channel [Loxx]The Giga Kaleidoscope GKD-C Turtle Trading Channel is a confirmation module included in Loxx's "Giga Kaleidoscope Modularized Trading System."
█ GKD-C Turtle Trading Channel
The "Turtle Trading Channel" refers to a method of trading based on a concept taught by Richard Dennis and William Eckhardt to a group of traders known as the Turtles in the 1980s. This approach involves a set of rules for buying and selling commodities or financial instruments, primarily based on breakouts from a certain range.
In trading, a "channel" is often represented as two lines on a price chart: an upper line representing a resistance level and a lower line representing a support level. In the context of Turtle Trading, these lines are typically drawn based on recent high and low prices, and trades are initiated when the price breaks out of this channel, indicating a potential trend.
█ Giga Kaleidoscope Modularized Trading System
Core components of an NNFX algorithmic trading strategy
The NNFX algorithm is built on the principles of trend, momentum, and volatility. There are six core components in the NNFX trading algorithm:
1. Volatility - price volatility; e.g., Average True Range, True Range Double, Close-to-Close, etc.
2. Baseline - a moving average to identify price trend
3. Confirmation 1 - a technical indicator used to identify trends
4. Confirmation 2 - a technical indicator used to identify trends
5. Continuation - a technical indicator used to identify trends
6. Volatility/Volume - a technical indicator used to identify volatility/volume breakouts/breakdown
7. Exit - a technical indicator used to determine when a trend is exhausted
8. Metamorphosis - a technical indicator that produces a compound signal from the combination of other GKD indicators*
*(not part of the NNFX algorithm)
What is Volatility in the NNFX trading system?
In the NNFX (No Nonsense Forex) trading system, ATR (Average True Range) is typically used to measure the volatility of an asset. It is used as a part of the system to help determine the appropriate stop loss and take profit levels for a trade. ATR is calculated by taking the average of the true range values over a specified period.
True range is calculated as the maximum of the following values:
-Current high minus the current low
-Absolute value of the current high minus the previous close
-Absolute value of the current low minus the previous close
ATR is a dynamic indicator that changes with changes in volatility. As volatility increases, the value of ATR increases, and as volatility decreases, the value of ATR decreases. By using ATR in NNFX system, traders can adjust their stop loss and take profit levels according to the volatility of the asset being traded. This helps to ensure that the trade is given enough room to move, while also minimizing potential losses.
Other types of volatility include True Range Double (TRD), Close-to-Close, and Garman-Klass
What is a Baseline indicator?
The baseline is essentially a moving average, and is used to determine the overall direction of the market.
The baseline in the NNFX system is used to filter out trades that are not in line with the long-term trend of the market. The baseline is plotted on the chart along with other indicators, such as the Moving Average (MA), the Relative Strength Index (RSI), and the Average True Range (ATR).
Trades are only taken when the price is in the same direction as the baseline. For example, if the baseline is sloping upwards, only long trades are taken, and if the baseline is sloping downwards, only short trades are taken. This approach helps to ensure that trades are in line with the overall trend of the market, and reduces the risk of entering trades that are likely to fail.
By using a baseline in the NNFX system, traders can have a clear reference point for determining the overall trend of the market, and can make more informed trading decisions. The baseline helps to filter out noise and false signals, and ensures that trades are taken in the direction of the long-term trend.
What is a Confirmation indicator?
Confirmation indicators are technical indicators that are used to confirm the signals generated by primary indicators. Primary indicators are the core indicators used in the NNFX system, such as the Average True Range (ATR), the Moving Average (MA), and the Relative Strength Index (RSI).
The purpose of the confirmation indicators is to reduce false signals and improve the accuracy of the trading system. They are designed to confirm the signals generated by the primary indicators by providing additional information about the strength and direction of the trend.
Some examples of confirmation indicators that may be used in the NNFX system include the Bollinger Bands, the MACD (Moving Average Convergence Divergence), and the MACD Oscillator. These indicators can provide information about the volatility, momentum, and trend strength of the market, and can be used to confirm the signals generated by the primary indicators.
In the NNFX system, confirmation indicators are used in combination with primary indicators and other filters to create a trading system that is robust and reliable. By using multiple indicators to confirm trading signals, the system aims to reduce the risk of false signals and improve the overall profitability of the trades.
What is a Continuation indicator?
In the NNFX (No Nonsense Forex) trading system, a continuation indicator is a technical indicator that is used to confirm a current trend and predict that the trend is likely to continue in the same direction. A continuation indicator is typically used in conjunction with other indicators in the system, such as a baseline indicator, to provide a comprehensive trading strategy.
What is a Volatility/Volume indicator?
Volume indicators, such as the On Balance Volume (OBV), the Chaikin Money Flow (CMF), or the Volume Price Trend (VPT), are used to measure the amount of buying and selling activity in a market. They are based on the trading volume of the market, and can provide information about the strength of the trend. In the NNFX system, volume indicators are used to confirm trading signals generated by the Moving Average and the Relative Strength Index. Volatility indicators include Average Direction Index, Waddah Attar, and Volatility Ratio. In the NNFX trading system, volatility is a proxy for volume and vice versa.
By using volume indicators as confirmation tools, the NNFX trading system aims to reduce the risk of false signals and improve the overall profitability of trades. These indicators can provide additional information about the market that is not captured by the primary indicators, and can help traders to make more informed trading decisions. In addition, volume indicators can be used to identify potential changes in market trends and to confirm the strength of price movements.
What is an Exit indicator?
The exit indicator is used in conjunction with other indicators in the system, such as the Moving Average (MA), the Relative Strength Index (RSI), and the Average True Range (ATR), to provide a comprehensive trading strategy.
The exit indicator in the NNFX system can be any technical indicator that is deemed effective at identifying optimal exit points. Examples of exit indicators that are commonly used include the Parabolic SAR, and the Average Directional Index (ADX).
The purpose of the exit indicator is to identify when a trend is likely to reverse or when the market conditions have changed, signaling the need to exit a trade. By using an exit indicator, traders can manage their risk and prevent significant losses.
In the NNFX system, the exit indicator is used in conjunction with a stop loss and a take profit order to maximize profits and minimize losses. The stop loss order is used to limit the amount of loss that can be incurred if the trade goes against the trader, while the take profit order is used to lock in profits when the trade is moving in the trader's favor.
Overall, the use of an exit indicator in the NNFX trading system is an important component of a comprehensive trading strategy. It allows traders to manage their risk effectively and improve the profitability of their trades by exiting at the right time.
What is an Metamorphosis indicator?
The concept of a metamorphosis indicator involves the integration of two or more GKD indicators to generate a compound signal. This is achieved by evaluating the accuracy of each indicator and selecting the signal from the indicator with the highest accuracy. As an illustration, let's consider a scenario where we calculate the accuracy of 10 indicators and choose the signal from the indicator that demonstrates the highest accuracy.
The resulting output from the metamorphosis indicator can then be utilized in a GKD-BT backtest by occupying a slot that aligns with the purpose of the metamorphosis indicator. The slot can be a GKD-B, GKD-C, or GKD-E slot, depending on the specific requirements and objectives of the indicator. This allows for seamless integration and utilization of the compound signal within the GKD-BT framework.
How does Loxx's GKD (Giga Kaleidoscope Modularized Trading System) implement the NNFX algorithm outlined above?
Loxx's GKD v2.0 system has five types of modules (indicators/strategies). These modules are:
1. GKD-BT - Backtesting module (Volatility, Number 1 in the NNFX algorithm)
2. GKD-B - Baseline module (Baseline and Volatility/Volume, Numbers 1 and 2 in the NNFX algorithm)
3. GKD-C - Confirmation 1/2 and Continuation module (Confirmation 1/2 and Continuation, Numbers 3, 4, and 5 in the NNFX algorithm)
4. GKD-V - Volatility/Volume module (Confirmation 1/2, Number 6 in the NNFX algorithm)
5. GKD-E - Exit module (Exit, Number 7 in the NNFX algorithm)
6. GKD-M - Metamorphosis module (Metamorphosis, Number 8 in the NNFX algorithm, but not part of the NNFX algorithm)
(additional module types will added in future releases)
Each module interacts with every module by passing data to A backtest module wherein the various components of the GKD system are combined to create a trading signal.
That is, the Baseline indicator passes its data to Volatility/Volume. The Volatility/Volume indicator passes its values to the Confirmation 1 indicator. The Confirmation 1 indicator passes its values to the Confirmation 2 indicator. The Confirmation 2 indicator passes its values to the Continuation indicator. The Continuation indicator passes its values to the Exit indicator, and finally, the Exit indicator passes its values to the Backtest strategy.
This chaining of indicators requires that each module conform to Loxx's GKD protocol, therefore allowing for the testing of every possible combination of technical indicators that make up the six components of the NNFX algorithm.
What does the application of the GKD trading system look like?
Example trading system:
Backtest: Multi-Ticker CC Backtest
Baseline: Hull Moving Average
Volatility/Volume: Hurst Exponent
Confirmation 1: Advance Trend Pressure as shown on the chart above
Confirmation 2: uf2018
Continuation: Coppock Curve
Exit: Rex Oscillator
Metamorphosis: Baseline Optimizer
Each GKD indicator is denoted with a module identifier of either: GKD-BT, GKD-B, GKD-C, GKD-V, GKD-M, or GKD-E. This allows traders to understand to which module each indicator belongs and where each indicator fits into the GKD system.
? Giga Kaleidoscope Modularized Trading System Signals
Standard Entry
1. GKD-C Confirmation gives signal
2. Baseline agrees
3. Price inside Goldie Locks Zone Minimum
4. Price inside Goldie Locks Zone Maximum
5. Confirmation 2 agrees
6. Volatility/Volume agrees
1-Candle Standard Entry
1a. GKD-C Confirmation gives signal
2a. Baseline agrees
3a. Price inside Goldie Locks Zone Minimum
4a. Price inside Goldie Locks Zone Maximum
Next Candle
1b. Price retraced
2b. Baseline agrees
3b. Confirmation 1 agrees
4b. Confirmation 2 agrees
5b. Volatility/Volume agrees
Baseline Entry
1. GKD-B Baseline gives signal
2. Confirmation 1 agrees
3. Price inside Goldie Locks Zone Minimum
4. Price inside Goldie Locks Zone Maximum
5. Confirmation 2 agrees
6. Volatility/Volume agrees
7. Confirmation 1 signal was less than 'Maximum Allowable PSBC Bars Back' prior
1-Candle Baseline Entry
1a. GKD-B Baseline gives signal
2a. Confirmation 1 agrees
3a. Price inside Goldie Locks Zone Minimum
4a. Price inside Goldie Locks Zone Maximum
5a. Confirmation 1 signal was less than 'Maximum Allowable PSBC Bars Back' prior
Next Candle
1b. Price retraced
2b. Baseline agrees
3b. Confirmation 1 agrees
4b. Confirmation 2 agrees
5b. Volatility/Volume agrees
Volatility/Volume Entry
1. GKD-V Volatility/Volume gives signal
2. Confirmation 1 agrees
3. Price inside Goldie Locks Zone Minimum
4. Price inside Goldie Locks Zone Maximum
5. Confirmation 2 agrees
6. Baseline agrees
7. Confirmation 1 signal was less than 7 candles prior
1-Candle Volatility/Volume Entry
1a. GKD-V Volatility/Volume gives signal
2a. Confirmation 1 agrees
3a. Price inside Goldie Locks Zone Minimum
4a. Price inside Goldie Locks Zone Maximum
5a. Confirmation 1 signal was less than 'Maximum Allowable PSVVC Bars Back' prior
Next Candle
1b. Price retraced
2b. Volatility/Volume agrees
3b. Confirmation 1 agrees
4b. Confirmation 2 agrees
5b. Baseline agrees
Confirmation 2 Entry
1. GKD-C Confirmation 2 gives signal
2. Confirmation 1 agrees
3. Price inside Goldie Locks Zone Minimum
4. Price inside Goldie Locks Zone Maximum
5. Volatility/Volume agrees
6. Baseline agrees
7. Confirmation 1 signal was less than 7 candles prior
1-Candle Confirmation 2 Entry
1a. GKD-C Confirmation 2 gives signal
2a. Confirmation 1 agrees
3a. Price inside Goldie Locks Zone Minimum
4a. Price inside Goldie Locks Zone Maximum
5a. Confirmation 1 signal was less than 'Maximum Allowable PSC2C Bars Back' prior
Next Candle
1b. Price retraced
2b. Confirmation 2 agrees
3b. Confirmation 1 agrees
4b. Volatility/Volume agrees
5b. Baseline agrees
PullBack Entry
1a. GKD-B Baseline gives signal
2a. Confirmation 1 agrees
3a. Price is beyond 1.0x Volatility of Baseline
Next Candle
1b. Price inside Goldie Locks Zone Minimum
2b. Price inside Goldie Locks Zone Maximum
3b. Confirmation 1 agrees
4b. Confirmation 2 agrees
5b. Volatility/Volume agrees
Continuation Entry
1. Standard Entry, 1-Candle Standard Entry, Baseline Entry, 1-Candle Baseline Entry, Volatility/Volume Entry, 1-Candle Volatility/Volume Entry, Confirmation 2 Entry, 1-Candle Confirmation 2 Entry, or Pullback entry triggered previously
2. Baseline hasn't crossed since entry signal trigger
4. Confirmation 1 agrees
5. Baseline agrees
6. Confirmation 2 agrees
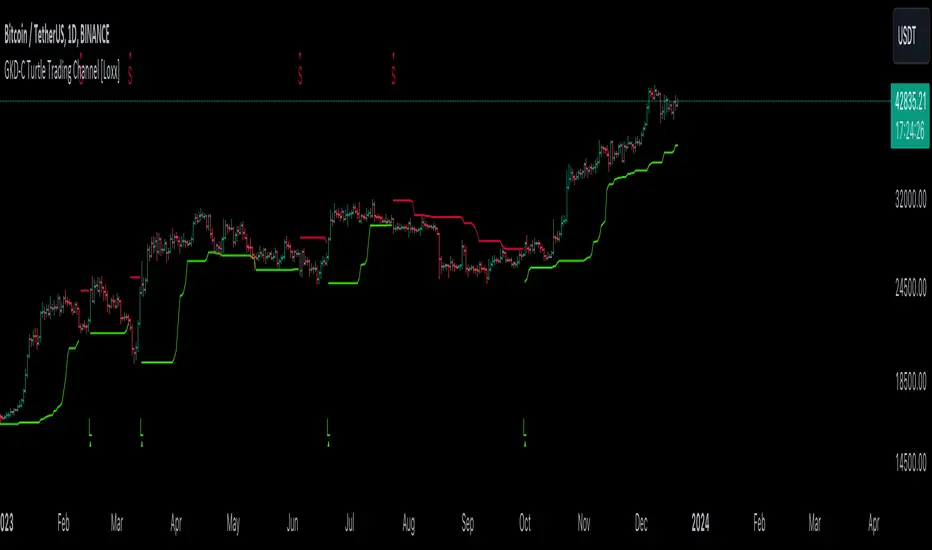
DNA GRAVITY PRICE V1 PINESCRIPTLABSWe can observe that this indicator displays the range within which the asset fluctuates around the average price, and its behavior depends on the parameters of amplitude and angular frequency. "price_mas" is a measure calculated as part of the indicator. It is derived by adding an adjusted amplitude (A_mas) multiplied by the cosine of the combination of angular frequency (w), time, and a phase shift (phi) to the average price (P0). This calculated value oscillates around the actual asset price and is used to identify potential turning points and the range where the price has established itself within the specified lookback period.
2.- At its core, the indicator utilizes the innovative concept of 'price_mas,' a calculated metric visualized in three essential colors: green to indicate low levels, blue for medium levels, and red for high levels. These colors reflect the position of the price in relation to a range determined by historical highs and lows.
In the context of the "DNA GRAVITY PRICE V1 " indicator, low, medium, and high levels specifically refer to the calculated value of 'price_mas,' which is a derived measure within the indicator. They do not directly refer to the actual asset price but rather to a calculated value that the indicator uses to analyze and predict the behavior of the asset's price.
This algorithm stands out for its ability to capture the 'strength' of the price through the 'price_mas' zones. Once the price exits the zones marked by the 'price_mas' (red, blue, and green plots), it tends to return with significant force.
Buy & Sell Signals:
Buy Signal: If the price and the Donchian lines cross above the high threshold, visually represented by red diamonds, it indicates a strong bullish momentum. This not only shows that the price is rising but also that the trend is strong enough to push the Donchian lines, which represent price extremes over a certain period, above the threshold. This convergence of movements, marked by the crossing over the red diamonds, suggests a higher probability of the bullish trend continuing.
Sell Signal: Similarly, if the price and the Donchian lines fall below the low threshold, visualized as green diamonds, this signals a significant bearish momentum. The simultaneous decline of the price and the Donchian lines below this threshold, marked by the green diamonds, indicates that not only is the price decreasing, but the bearish trend is strong enough to influence the price extremes calculated by the Donchian lines.
Configuration:
-The "Initial Dynamic Length of MAS Price" parameter controls the smoothness and sensitivity of the indicator. A high value smooths the Simple Moving Average (SMA), making the indicator less responsive to short-term price fluctuations. On the other hand, a low value makes the indicator more sensitive to short-term price fluctuations, generating faster and more volatile signals
-This parameter, "MAS Amplitude Percentage," determines the amplitude as a percentage. Increasing the Initial Dynamic Price will result in a larger amplitude relative to the price, leading to wider ranges for the indicator. Decreasing this value will have the opposite effect, reducing the amplitude relative to the price. Increasing "A_mas_pct" can make signals more extreme and less frequent, while decreasing it will make signals smoother and more frequent.
-This parameter, "Angular Frequency of MAS," affects the frequency of oscillations in the calculation of the "Initial Dynamic Price." A higher value of "w" will make the oscillations faster and more frequent, which means that the indicator will be more responsive to abrupt price changes. Conversely, a lower value will make the oscillations slower and smoother, making the indicator less sensitive to rapid price changes. Modifying ""Angular Frequency of MAS,"" directly impacts the frequency of oscillations in the indicator.
Español:
Podemos observar que este indicador muestra el rango en el cual el activo fluctúa alrededor del precio promedio y su comportamiento depende de los parámetros de amplitud y frecuencia angular. "price_mas" es una medida calculada como parte del indicador. Se deriva al sumar una amplitud ajustada (A_mas) multiplicada por el coseno de la combinación de frecuencia angular (w), tiempo y un desplazamiento de fase (phi) al precio promedio (P0). Este valor calculado oscila alrededor del precio real del activo y se utiliza para identificar posibles puntos de giro y el rango donde el precio se ha establecido dentro del período de búsqueda especificado.
En su núcleo, el indicador utiliza el innovador concepto de 'price_mas', una métrica calculada visualizada en tres colores esenciales: verde para indicar niveles bajos, azul para niveles medios y rojo para niveles altos. Estos colores reflejan la posición del precio en relación con un rango determinado por los máximos y mínimos históricos.
En el contexto del indicador "DNA GRAVITY PRICE V1", los niveles bajos, medios y altos se refieren específicamente al valor calculado de 'price_mas', que es una medida derivada dentro del indicador. No se refieren directamente al precio real del activo, sino a un valor calculado que el indicador utiliza para analizar y predecir el comportamiento del precio del activo.
Este algoritmo se destaca por su capacidad para capturar la 'fortaleza' del precio a través de las zonas de 'price_mas'. Una vez que el precio sale de las zonas marcadas por 'price_mas' (trazas rojas, azules y verdes), tiende a regresar con una fuerza significativa. Este comportamiento es crucial para los operadores, ya que proporciona oportunidades tanto para capitalizar las retracciones de precios como para anticipar posibles cambios de tendencia.
Señales de Compra y Venta:
Señal de Compra: Si el precio y las líneas Donchian cruzan por encima del umbral alto, visualmente representado por diamantes rojos, indica un fuerte impulso alcista. Esto no solo muestra que el precio está aumentando, sino que la tendencia es lo suficientemente fuerte como para empujar las líneas Donchian, que representan los extremos de precio durante un período determinado, por encima del umbral. Esta convergencia de movimientos, marcada por el cruce sobre los diamantes rojos, sugiere una mayor probabilidad de que la tendencia alcista continúe.
Señal de Venta: De manera similar, si el precio y las líneas Donchian caen por debajo del umbral bajo, visualizado como diamantes verdes, esto señala un fuerte impulso bajista. La caída simultánea del precio y las líneas Donchian por debajo de este umbral, marcada por los diamantes verdes, indica que no solo el precio está disminuyendo, sino que la tendencia bajista es lo suficientemente fuerte como para influir en los extremos de precio calculados por las líneas Donchian.
Configuración:
El parámetro "Longitud Dinámica Inicial de MAS Price" controla la suavidad y la sensibilidad del indicador. Un valor alto suaviza el Promedio Móvil Simple (SMA), lo que hace que el indicador sea menos sensible a las fluctuaciones de precio a corto plazo. Por otro lado, un valor bajo hace que el indicador sea más sensible a las fluctuaciones de precio a corto plazo, generando señales más rápidas y volátiles.
Este parámetro, "Porcentaje de Amplitud de MAS," determina la amplitud como un porcentaje. Aumentar el valor de "Longitud Dinámica Inicial de MAS Price" dará como resultado una amplitud más grande en relación con el precio, lo que conducirá a rangos más amplios para el indicador. Disminuir este valor tendrá el efecto contrario, reduciendo la amplitud en relación con el precio. Aumentar "Porcentaje de A_mas" puede hacer que las señales sean más extremas y menos frecuentes, mientras que disminuirlo hará que las señales sean más suaves y más frecuentes.
Este parámetro, "Frecuencia Angular de MAS," afecta la frecuencia de las oscilaciones en el cálculo del "Precio Móvil Simple Inicial." Un valor más alto de "w" hará que las oscilaciones sean más rápidas y frecuentes, lo que significa que el indicador será más receptivo a cambios abruptos en el precio. Por otro lado, un valor más bajo hará que las oscilaciones sean más lentas y suaves, haciendo que el indicador sea menos sensible a cambios rápidos en el precio. Modificar "Frecuencia Angular de MAS" afecta directamente la frecuencia de las oscilaciones en el indicador.
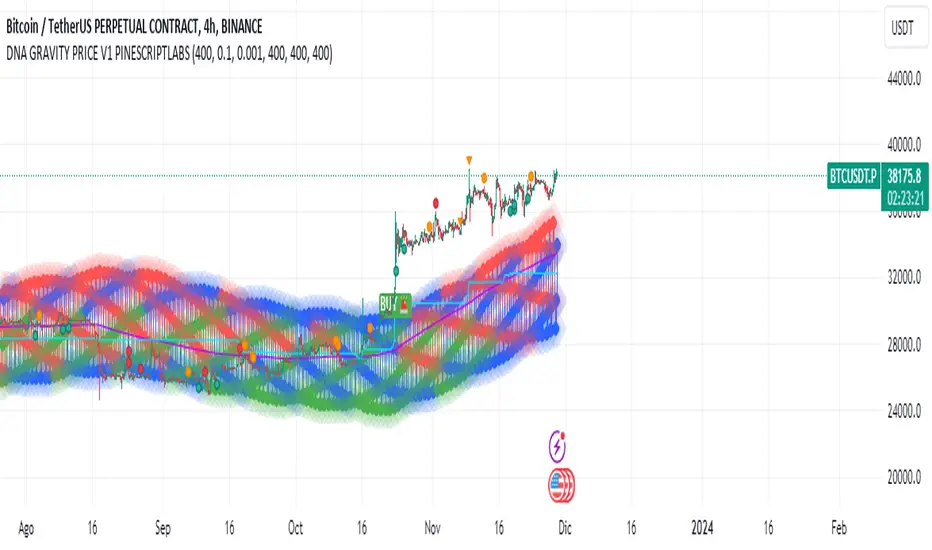
Optimal Length BackTester [YinYangAlgorithms]This Indicator allows for a ‘Optimal Length’ to be inputted within the Settings as a Source. Unlike most Indicators and/or Strategies that rely on either Static Lengths or Internal calculations for the length, this Indicator relies on the Length being derived from an external Indicator in the form of a Source Input.
This may not sound like much, but this application may allows limitless implementations of such an idea. By allowing the input of a Length within a Source Setting you may have an ‘Optimal Length’ that adjusts automatically without the need for manual intervention. This may allow for Traditional and Non-Traditional Indicators and/or Strategies to allow modifications within their settings as well to accommodate the idea of this ‘Optimal Length’ model to create an Indicator and/or Strategy that adjusts its length based on the top performing Length within the current Market Conditions.
This specific Indicator aims to allow backtesting with an ‘Optimal Length’ inputted as a ‘Source’ within the Settings.
This ‘Optimal Length’ may be used to display and potentially optimize multiple different Traditional Indicators within this BackTester. The following Traditional Indicators are included and available to be backtested with an ‘Optimal Length’ inputted as a Source in the Settings:
Moving Average; expressed as either a: Simple Moving Average, Exponential Moving Average or Volume Weighted Moving Average
Bollinger Bands; expressed based on the Moving Average Type
Donchian Channels; expressed based on the Moving Average Type
Envelopes; expressed based on the Moving Average Type
Envelopes Adjusted; expressed based on the Moving Average Type
All of these Traditional Indicators likewise may be displayed with multiple ‘Optimal Lengths’. They have the ability for multiple different ‘Optimal Lengths’ to be inputted and displayed, such as:
Fast Optimal Length
Slow Optimal Length
Neutral Optimal Length
By allowing for the input of multiple different ‘Optimal Lengths’ we may express the ‘Optimal Movement’ of such an expressed Indicator based on different Time Frames and potentially also movement based on Fast, Slow and Neutral (Inclusive) Lengths.
This in general is a simple Indicator that simply allows for the input of multiple different varieties of ‘Optimal Lengths’ to be displayed in different ways using Tradition Indicators. However, the idea and model of accepting a Length as a Source is unique and may be adopted in many different forms and endless ideas.
Tutorial:
You may add an ‘Optimal Length’ within the Settings as a ‘Source’ as followed in the example above. This Indicator allows for the input of a:
Neutral ‘Optimal Length’
Fast ‘Optimal Length’
Slow ‘Optimal Length’
It is important to account for all three as they generally encompass different min/max length values and therefore result in varying ‘Optimal Length’s’.
For instance, say you’re calculating the ‘Optimal Length’ and you use:
Min: 1
Max: 400
This would therefore be scanning for 400 (inclusive) lengths.
As a general way of calculating you may assume the following for which lengths are being used within an ‘Optimal Length’ calculation:
Fast: 1 - 199
Slow: 200 - 400
Neutral: 1 - 400
This allows for the calculation of a Fast and Slow length within the predetermined lengths allotted. However, it likewise allows for a Neutral length which is inclusive to all lengths alloted and may be deemed the ‘Most Accurate’ for these reasons. However, just because the Neutral is inclusive to all lengths, doesn’t mean the Fast and Slow lengths are irrelevant. The Fast and Slow length inputs may be useful for seeing how specifically zoned lengths may fair, and likewise when they cross over and/or under the Neutral ‘Optimal Length’.
This Indicator features the ability to display multiple different types of Traditional Indicators within the ‘Display Type’.
We will go over all of the different ‘Display Types’ with examples on how using a Fast, Slow and Neutral length would impact it:
Simple Moving Average:
In this example above have the Fast, Slow and Neutral Optimal Length formatted as a Slow Moving Average. The first example is on the 15 minute Time Frame and the second is on the 1 Day Time Frame, demonstrating how the length changes based on the Time Frame and the effects it may have.
Here we can see that by inputting ‘Optimal Lengths’ as a Simple Moving Average we may see moving averages that change over time with their ‘Optimal Lengths’. These lengths may help identify Support and/or Resistance locations. By using an 'Optimal Length' rather than a static length, we may create a Moving Average which may be more accurate as it attempts to be adaptive to current Market Conditions.
Bollinger Bands:
Bollinger Bands are a way to see a Simple Moving Average (SMA) that then uses Standard Deviation to identify how much deviation has occurred. This Deviation is then Added and Subtracted from the SMA to create the Bollinger Bands which help Identify possible movement zones that are ‘within range’. This may mean that the price may face Support / Resistance when it reaches the Outer / Inner bounds of the Bollinger Bands. Likewise, it may mean the Price is ‘Overbought’ when outside and above or ‘Underbought’ when outside and below the Bollinger Bands.
By applying All 3 different types of Optimal Lengths towards a Traditional Bollinger Band calculation we may hope to see different ranges of Bollinger Bands and how different lookback lengths may imply possible movement ranges on both a Short Term, Long Term and Neutral perspective. By seeing these possible ranges you may have the ability to identify more levels of Support and Resistance over different lengths and Trading Styles.
Donchian Channels:
Above you’ll see two examples of Machine Learning: Optimal Length applied to Donchian Channels. These are displayed with both the 15 Minute Time Frame and the 1 Day Time Frame.
Donchian Channels are a way of seeing potential Support and Resistance within a given lookback length. They are a way of withholding the High’s and Low’s of a specific lookback length and looking for deviation within this length. By applying a Fast, Slow and Neutral Machine Learning: Optimal Length to these Donchian Channels way may hope to achieve a viable range of High’s and Low’s that one may use to Identify Support and Resistance locations for different ranges of Optimal Lengths and likewise potentially different Trading Strategies.
Envelopes / Envelopes Adjusted:
Envelopes are an interesting one in the sense that they both may be perceived as useful; however we deem that with the use of an ‘Optimal Length’ that the ‘Envelopes Adjusted’ may work best. We will start with examples of the Traditional Envelope then showcase the Adjusted version.
Envelopes:
As you may see, a Traditional form of Envelopes even produced with a Machine Learning: Optimal Length may not produce optimal results. Unfortunately this may occur with some Traditional Indicators and they may need some adjustments as you’ll notice with the ‘Envelopes Adjusted’ version. However, even without the adjustments, these Envelopes may be useful for seeing ‘Overbought’ and ‘Oversold’ locations within a Machine Learning: Optimal Length standpoint.
Envelopes Adjusted:
By adding an adjustment to these Envelopes, we may hope to better reflect our Optimal Length within it. This is caused by adding a ratio reflection towards the current length of the Optimal Length and the max Length used. This allows for the Fast and Neutral (and potentially Slow if Neutral is greater) to achieve a potentially more accurate result.
Envelopes, much like Bollinger Bands are a way of seeing potential movement zones along with potential Support and Resistance. However, unlike Bollinger Bands which are based on Standard Deviation, Envelopes are based on percentages +/- from the Simple Moving Average.
We will conclude our Tutorial here. Hopefully this has given you some insight into how useful adding a ‘Optimal Length’ within an external (secondary) Indicator as a Source within the Settings may be. Likewise, how useful it may be for automation sake in the sense that when the ‘Optimal Length’ changes, it doesn’t rely on an alert where you need to manually update it yourself; instead it will update Automatically and you may reap the benefits of such with little manual input needed (aside from the initial setup).
If you have any questions, comments, ideas or concerns please don't hesitate to contact us.
HAPPY TRADING!

Donchian Trend SignalsThe Donchian Trend Signals is an indicator developed to help traders identify the current trend direction and potential liquidity grabs.
The usage of the indicator is very simple, on the chart you'll see a modified version of the classic and popular Donchian channel, calculated using the closing prices, that changes the color of the average middle line to indicate the direction of the current trend. The indicator also colors the candlestick.
Using the option "Complex Mode" will give your indicator additional data by changing the calculation method. These changes make the lines become the average between different lengths of the same Donchian channel formula.
Additionally, the indicator plots on the chart some buy or sell signals, displayed as diamonds above or below the candles. The signals are calculated to find potential liquidity grabs using the wicks, the true range of the candles, and the volume compared to his average value.

[KVA]Donchian Channel Percentage" The 'Donchian Channel Percentage ' (DC%) indicator, developed for TradingView’s Pine Script Version 5, is a unique tool designed to measure the current price’s position within the Donchian Channel. The Donchian Channel, a popular indicator in technical analysis, is defined by the highest high and the lowest low over a user-specified period.
Key Features :
User-Defined Period: Users can customize the lookback period (default 20 periods), allowing flexibility in different trading styles and timeframes.
Channel Calculation: The upper and lower bounds of the Donchian Channel are calculated based on the highest high and lowest low over the chosen period.
Percentage Calculation: DC% quantifies where the current price lies within the channel, presented as a percentage. A value of 0% indicates the price at the channel's low, and 100% signifies the price at the high.
Visualization: The DC% is plotted as a line graph, providing a clear visual representation of the price’s relative position. The indicator includes horizontal lines at 0% and 100%, marked in red and green, respectively, to depict the channel's boundaries.
Market Analysis Tool: DC% offers insights into market trends and potential overbought or oversold conditions, making it a valuable addition for traders who focus on channel-based strategies.
Applications :
The DC% is particularly useful for identifying breakout scenarios and potential reversals.
Traders can use this tool in conjunction with other indicators to enhance their market analysis, especially in strategies that capitalize on price extremes within a defined range.
In summary, the Donchian Channel Percentage offers traders a simple yet powerful tool to gauge the current price’s position within a historical high-low range. Its adaptability across various assets and timeframes makes it a versatile addition to any technical trader’s toolkit."

[OKX Signal Bot] Indicator Script Set Up TemplateDiscover the power of the Turtle Trade Channels Indicator (TUTCI), an innovative tool that integrates the time-tested principles of the legendary Turtle Trade system. This groundbreaking system shattered the belief that successful traders are born, not made, by transforming ordinary individuals into profitable traders.
The Turtle Trade Experiment, which achieved a remarkable 80% annual return over four years and amassed a staggering $150 million, showcased the immense potential of this trend-following strategy. Unlike the conventional "buy low and sell high" approach, the Turtle Trade system embraces a different philosophy—one of capturing substantial profits by following prevailing trends.
At the heart of the Turtle Trade Channels Indicator lies the concept of Donchian Channels, a powerful technical indicator developed by Richard Donchian. Building upon this foundation, the main rule of TUTCI is to identify 20-day breakouts and capitalize on them, while simultaneously utilizing a profit-taking strategy based on breaching 10-day highs or lows.
For long trades, the indicator signals a buying opportunity when the price breaks above the 20-day high. Conversely, for short trades, a selling opportunity arises when the price falls below the 20-day low. This systematic approach allows traders to align themselves with the prevailing momentum, capturing significant price movements.
To further enhance trading precision, TUTCI incorporates two key lines. The red line represents the trading line, indicating the direction of the trend. Price bars above the trend line suggest an uptrend, while those below indicate a downtrend. The dotted blue line serves as the exit line, guiding traders to close their positions when price action breaches the 10-day high or low. This rule safeguards profits and helps traders avoid potential trend reversals.
The Turtle Trade Channels Indicator (TUTCI) is a versatile tool applicable to various financial markets, including stocks, commodities, and forex. By harnessing the power of breakouts and integrating profit-taking rules, this indicator empowers traders to capitalize on favorable trading opportunities while managing risk effectively.
As with any trading strategy, it is crucial to conduct thorough backtesting and evaluation of the TUTCI system before implementing it in live trading. Traders can customize the indicator's parameters to align with their trading preferences and adapt to changing market conditions. Employing sound risk management techniques, such as position sizing and stop-loss orders, is paramount to protect capital and minimize potential losses.
Experience the transformational potential of the Turtle Trade Channels Indicator (TUTCI) and embark on a journey of trend following, capturing significant profits, and achieving trading success.
These scripts are only functioning as sample script templates to support okx alert standards. It is not intended to provide any investment, tax, or legal advice, nor should it be considered an offer to purchase, sell, hold or offer any services relating to digital assets. Digital assets, including stablecoins, involve a high degree of risk, can fluctuate greatly, and can even become worthless. You should carefully consider whether trading or holding digital assets is suitable for you in light of your financial condition and risk tolerance. OKX does not provide investment or asset recommendations. You are solely responsible for your investment decisions, and OKX is not responsible for any potential losses. Past performance is not indicative of future results. Please consult your legal/tax/investment professional for questions about your specific circumstances.

Koalafied Donchian Channel WidthDonchian Channel Width indicator with average channel width value and Standard Deviations shown.
Experimental gauge of volatility. Channel Width greater than average over lookback period shows higher levels of volatility, whereas channel width below average is correlated to low historical volatility. Extensions of width over user selected standard deviations show peaks in volatility.
Unique as average channel width is taken from array of value changes updating only when prior high/lows are breached instead of bar by bar like similar indicators.
Size of array (lookback) is user adjustable.
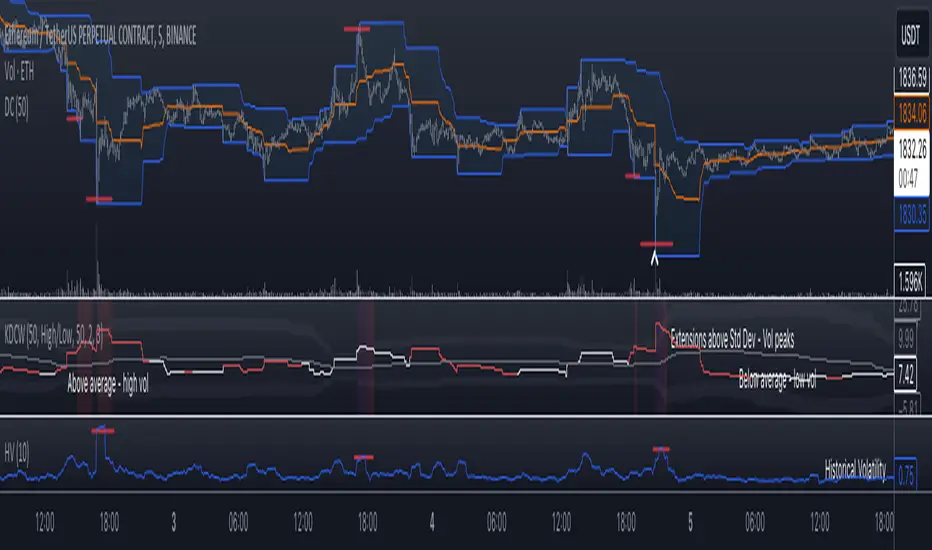
Sublime Trading | Donchian Breakout SignalsWhat kind of traders/investors are we?
We are trend followers. Our scripts are designed to be used on the higher timeframes (weekly/daily) to catch the large moves/trends in the market.
Most have heard of long-term trend following. Few know how to execute the strategy.
Our scripts are designed specifically to identify and invest in long-term market trends.
What does this script do?
It produces entry signals in a confirmed bull and bear trend.
The logic is based on Donchian 20, which serves the following two purposes:
1. Confirms end-of-day entry points in a long-term trend
2. Filters out entry points in a sideways market
The signal is produced on a break and close of the Donchian 20 high in a bull trend and a break and close of the Donchian 20 low in a bear trend.
How is the entry price produced?
The entry is based on a percentage value of the range of the breakout bar added to the high of the bar in a bull trend.
In a bear trend, the percentage is subtracted from the low of the bar.
This gives an objective entry when placing a position once the OHLC of a bar is confirmed at the end of the trading day.
How is the stoploss price produced?
The script uses the formula ATR 15 x 4.
We use ATR as it produces a stoploss which is unique to the volatility of the asset. The more volatile the asset, the wider the stoploss.
We use ATR 15 as it brings an average reading across half a month, incorporating days of extreme volatility.
The multiplier 4 works well to avoid positions being stopped out prematurely on pullbacks.
When the stoploss is hit, there is when traders and investors may consider exiting positions.
What is the best timeframe to use the script?
We recommend the daily timeframe as this is where trader and investors identify and enter long-term market trends.
The higher timeframes are where traders and investors take fewer positions but hold for longer time periods.
As a result, trend followers place priority on the quality of the entry rather than quantity.
What makes this script unique?
This script has been coded specifically for the daily timeframe to:
Highlight the start of a potential long-term trends.
Confirm entry points at the end of the trading day, absorbing intraday noise.
Reduce fake breakouts in a trend.
Continue to create entry points as the trend develops to allow for compounding.
Filter out breakouts in a sideways market.
This entry signal script helps traders and investors focus on the quality of a potential position when investing in long-term market trends.
