Top Detector V2 This indicator detects valid tops for future double tops. Once a top is confirmed, it displays an entry line for a potential entry point and a stop-loss line for a potential stop loss.
The indicator is fully programmable.
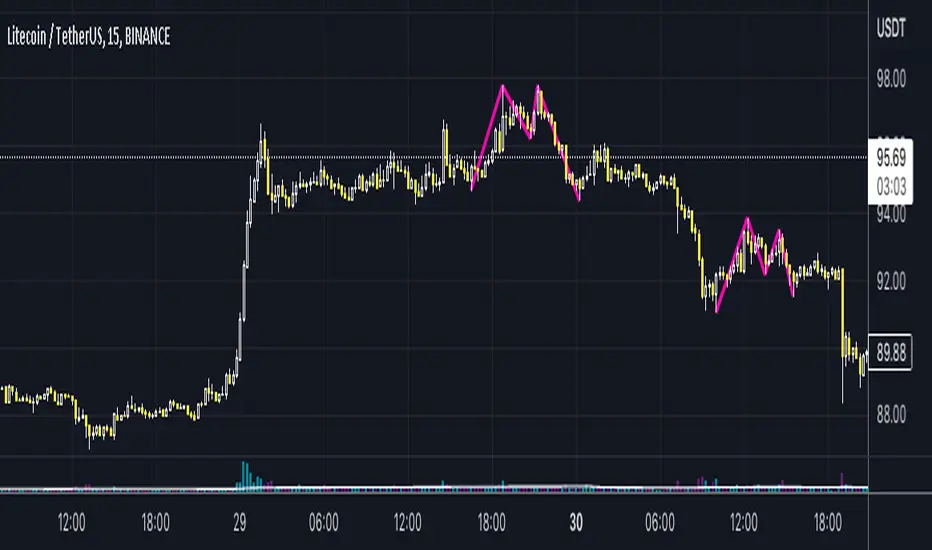
Doubletoppattern

Double Tops & Bottoms [QuantVue]This indicator is designed to detect and plot Double Tops and Double Bottoms, by setting the initial high or low using standard pivot points.
Double Tops
A Double Top is a bearish reversal pattern, typically found when an uptrend returns back to a prior peak. It signifies a potential turning point or resistance level and could potentially reverse in direction.
The pattern is confirmed as a Double Top when the price breaks above the resistance level, but closes below it. A decisive close below this level is seen as a confirmation of the bearish trend.
Double Bottoms
A Double Bottom, on the other hand, is a bullish reversal pattern typically found after a downtrend. It signals a potential turning point or support level where the price has bottomed and could potentially reverse upwards.
The pattern is confirmed as a Double Bottom when the price breaks below the support level, but closes above it. A decisive close above this level is viewed as a confirmation of the bullish trend.
Indicator Features
🔹Double Top Detection: When a double top is identified, a downward-pointing triangle will be plotted above the bar, and if the alerts are enabled, a notification will be triggered.
🔹Double Bottom Detection: When a double bottom is identified, an upward-pointing triangle will be plotted below the bar, and if the alerts are enabled, a notification will be triggered.
🔹Pivot Lookback: Defines the number of bars to the left and right of the pivot that must be lower/higher to qualify as a pivot.
🔹Maximum Length Between Tops/Bottoms: Maximum number of bars between two tops/bottoms to be considered a double top or bottom.
🔹Style Settings: Allows the user to customize the appearance of the lines indicating the tops/bottoms. Options include color selection, line style (dotted, dashed, or solid), and line thickness.
🔹Alerts: The user can enable or disable alerts for Double Top and Double Bottom.
Give this indicator a BOOST and COMMENT your thoughts!
We hope you enjoy.
Cheers!

Double top and double bottomThis script identifies double top and double bottom chart patterns
It has many settings. For example, you can choose by which extremums you want to identify patterns - by the edges of wicks (tails, shadows), or by the edges of candle bodies .
The Sensitivity parameter will allow you to control the frequency of detected patterns , depending on whether you want the patterns to be detected more often, or if they cover a larger number of candles and thus be more reliable.
There are also several settings which you can determine the parameters of the pattern - the length and proportions of the lines included in it .
You can also customize your styles.
All key settings are accompanied by tooltips
Pro Trading Art - Double Top & Bottom with alertThis indicator is based on ta.pivothigh and ta.pivotlow function. And with the help of different ph and pl I am detecting double top and double bottom.
Features
1. All signal are on realtime means no repaint
2. Able to detect precise double top & bottom
Input Field
Pivot Length : Default 10 => Use to detect pivot point

Double Top Double Bottom [MS]Automatic Double Top and Double Bottom pattern scanner for any time frame, any asset.
Simple to use, just add to your chart, and set the size (in the settings) for the patterns you want to find.
• Green patterns are bullish
• Red patterns are bearish
• Alerts are available for when new patterns are displayed
• When a pattern completes (at the neckline), it will change from dotted lines to solid lines.
To scan for multiple sizes of patterns, add the script to your chart multiple times.
Use the link below or PM us to obtain access to this indicator.

Fluffykat's Double Top indicator with alert v1This is a free double top indicator with an alert that has many settings to customize your double top.
From Wikipedia "The double top is a frequent price formation at the end of a bull market. It appears as two consecutive peaks of approximately the same price on a price-versus-time chart of a market. The two peaks are separated by a minimum in price, a valley. The price level of this minimum is called the neck line of the formation. The formation is completed and confirmed when the price falls below the neck line, indicating that further price decline is imminent or highly likely."
The following can be customized:
The left and right bar strengths for both the Right Top (RT) and Left Top (LT). For an explanation on RT/LT bar strength see (pivothigh) tradingview pine script API notes.
The price variance in % between RT / LT
The minimum and maximum allowable separation between RT/LT
Ability to toggle visibility of prices
Best regards.

Double Top Pattern IdentifierHello friends,
This script is a powerful, non-repainting detector for the classic Double Top pattern — one of the most widely recognized bearish reversal setups. The indicator automatically identifies and tracks developing 'M'-shaped formations in real-time, confirming valid entries once the neckline is broken and providing complete trade management features. No manual configuration for detection is needed — it works out of the box.
🛠 How It Works
It uses advanced techniques that involve pivot points analysis and do not rely on other indicators, ensuring robustness and adaptability across different market conditions. When a potential Double Top is detected, the indicator marks the pattern points, draws the neckline, and waits for confirmation.
Once confirmed, it generates a 'Short' signal with calculated Take Profit (TP) and Stop Loss (SL) levels.
The script includes a statistics table summarizing performance metrics — such as number of patterns, trade results, bar distances, and top differences — all dynamically updated on your chart.
🔥 Key Features
Pine Script V6 — optimized logic and performance
Works out of the box — no manual configuration required
Non-repainting detection
Fully visualized structure — points, neckline, TP, and SL plotted automatically
Multiple TP/SL modes: R/R ratio, ATR-based, percent, points, pips, ticks, or top-to-neckline distance
Trailing Stop Loss support
Interactive statistics table with pattern count, trade outcomes, profit ratio, and structural measurements
Smart alert system
Customizable alert messages with placeholders (price, ticker, timeframe, etc.)
Clean, updated UI with improved layout and organization
If you'd like access or have any questions, feel free to reach out to me directly via DM.
👋 Good luck and happy trading!
Script payant
