Kijun Sen Standard Deviation | QuantLapse SystemsOverview
The Kijun Sen Standard Deviation indicator by QuantLapse Systems is a volatility-aware trend-following framework that combines the structural equilibrium of the Kijun Sen (基準線) with statistically adaptive standard deviation bands.
By anchoring trend detection to market structure and confirming direction through volatility expansion, the indicator delivers a cleaner, more reliable regime classification across varying market conditions.
Rather than reacting to short-term noise, the system focuses on identifying statistically justified trend phases , making it well-suited for disciplined, rule-based trading.
Technical Composition, Calculation, Key Components & Features
📌 Kijun Sen (基準線) – Structural Trend Baseline
Calculated as the midpoint between the highest high and lowest low over a user-defined period.
Represents market equilibrium and structural balance rather than short-term momentum.
Naturally adapts to expanding and contracting price ranges.
Provides a stable baseline for regime detection and volatility validation.
Acts as the anchor for deviation bands and persistent trend-state logic.
Unlike fast or reactive moving averages, the Kijun Sen emphasizes price structure and equilibrium , making it especially effective for higher-quality trend confirmation.
📌 Volatility Adjustment – Standard Deviation Bands
Standard deviation is calculated over a configurable lookback to measure current price dispersion.
Upper and lower envelopes are formed by applying a deviation multiplier to the Kijun Sen.
Band width expands during volatility surges and contracts during consolidation.
Creates proportional, volatility-aware thresholds instead of static offsets.
Visually represents market energy through expanding and compressing channels.
These adaptive bands ensure that trend signals only occur when volatility supports directional movement.
📌 Trend Signal & Regime Calculation
Bullish Trend is confirmed when price closes above the upper deviation band.
Bearish Trend is confirmed when price closes below the lower deviation band.
Once established, the trend state persists until an opposing volatility break occurs.
This persistence reduces whipsaws and improves regime stability.
Trend state is reinforced with color-coded lines, envelopes, and background shading.
This volatility-confirmed persistence model is visible in the chart, where trends remain intact through minor pullbacks and only flip on decisive expansion.
How It Works in Trading
✅ Volatility-Confirmed Trend Detection – Requires expansion beyond deviation bands.
✅ Noise Suppression – Filters low-energy price movement within volatility envelopes.
✅ Regime Persistence – Maintains trend state until statistical invalidation.
✅ Immediate Visual Context – Direction, strength, and transitions are clear at a glance.
Visual Representation
Trend signals are displayed directly on price using both line and background context:
🟢 Green / Teal Kijun & Envelope → Confirmed bullish regime.
🔴 Red / Pink Kijun & Envelope → Confirmed bearish regime.
Semi-transparent band fill visualizes volatility expansion and compression.
Buy and Sell labels appear only on confirmed regime transitions.
The lower panel includes:
Strategy equity curve based on trend exposure.
Buy & Hold equity for performance comparison.
Background regime shading synchronized with trend state.
Features and User Inputs
The Kijun Sen Standard Deviation framework offers a focused yet powerful set of configurable inputs:
Kijun Sen Length – Controls structural trend sensitivity.
Standard Deviation Controls – Adjust lookback length and multiplier for regime strictness.
Backtesting & Date Filters – Define evaluation periods and starting conditions.
Display Options – Toggle labels, equity curves, and background shading.
Color Customization – Fully configurable buy/sell colors for trends and equity curves.
These controls allow users to balance responsiveness, stability, and clarity without overfitting.
Practical Applications
The Kijun Sen Standard Deviation indicator is designed for traders who prioritize structure, volatility confirmation, and regime awareness.
Primary Trend Filtering – Identify and stay aligned with dominant market direction.
Volatility-Aware Trend Following – Participate only when price expansion confirms intent.
Risk-Managed Exposure – Avoid chop during compression and transitional phases.
Systematic Strategy Development – Use as a regime engine or higher-timeframe filter.
Performance Evaluation – Compare trend-following equity against buy-and-hold benchmarks.
This framework bridges classical Ichimoku structure with modern statistical validation.
Conclusion
The Kijun Sen Standard Deviation indicator by QuantLapse Systems represents a refined evolution of Ichimoku-based trend analysis.
By integrating the structural equilibrium of the Kijun Sen with adaptive standard deviation confirmation, the system delivers clearer regime classification, reduced noise, and more reliable trend participation.
Rather than attempting to predict price, it focuses on confirming when trends are statistically justified .
Who should use Kijun Sen Standard Deviation:
📊 Trend-Following Traders – Stay aligned with dominant market structure.
⚡ Momentum & Swing Traders – Enter only on volatility-backed expansions.
🤖 Systematic & Algorithmic Traders – Ideal as a regime filter or trend-state engine.
Past performance is not indicative of future results.
Disclaimer: All trading involves risk, and no indicator can guarantee profitability.
Strategic Advice: Always backtest thoroughly, optimize parameters responsibly, and align settings with your timeframe, asset class, and risk tolerance before live deployment.
Educational

Low-High Waves for NeowaveOpen your chart at daily and hide the symbol graphic. Now you can see the waves. It’s including limited data sorry for this but I’m not a programmer and TradingView have limitations.

SFI Follow Trend Level 1 ( SFI Academy )“SFI Trading Level 1 Indicator is a proprietary indicator used by SFI Academy for its students, in combination with SFI Academy’s exclusive capital management toolset.”

Fair Value Gap [Tradeuminati]Fair Value Gap
Fair Value Gap is a clean and rule-based Fair Value Gap indicator for TradingView, designed to display only valid and confirmed Fair Value Gaps (FVGs) and Inverted Fair Value Gaps (iFVGs).
The indicator is built on a strict 3-candle FVG definition and operates exclusively on candle close, ensuring no repainting and no premature signals.
🔹 Key Features
Valid Fair Value Gaps (FVG)
- Detects bullish and bearish Fair Value Gaps using a precise 3-candle structure
- FVGs are only plotted after the confirming candle has closed
- A Fair Value Gap remains visible only as long as it is valid
- Once price closes beyond the FVG, it is removed or converted
Inverted Fair Value Gaps (iFVG)
- When a valid FVG is invalidated by a candle close, it can be converted into an iFVG
- iFVGs retain the original price range and structure
- Only valid iFVGs are displayed
- As soon as price closes through an iFVG, it is automatically removed
Clean & Controlled Visualization
- Only the last N active FVGs are displayed (bullish + bearish combined)
- Only the last N valid iFVGs are shown
- Boxes automatically extend to the current price + configurable bars
- Labels are dynamically positioned at the right edge of each zone
🔹 Technical Notes
- No repainting
- No intrabar signals
- Close-based validation only
- Works on all markets and timeframes
- Lightweight and performance-friendly
⚠️ Disclaimer
This indicator is for technical analysis purposes only and does not constitute trading or investment advice.

Trinity Swing Trading Buy and SellThis is a simple little Heiken Ashi MA + ADX & MACD trend-following trading system designed to capture medium- to longer-term moves while filtering out noise and weak trends. It combines modified Heiken Ashi candles (for smoother trend detection) with a moving average alignment, plus optional confirmation from ADX (trend strength) and MACD (momentum).
In practice, the indicator works well on higher timeframes (e.g., 1H, 4H, daily) where trends are more sustained. It performs best in trending markets and naturally avoids choppy/range-bound conditions thanks to the ADX filter (requiring ADX > 20 by default). All key components are fully customizable, so you can disable filters or adjust parameters to suit different instruments (stocks, forex, crypto, futures).
Default settings are:
16 HMA
8,17,9 MACD
15,20 ADX
Recommend to add an additional longer term EMA like 200 for long term trend confirmation.
Adjust inputs in the settings panel as needed:
Toggle MA, ADX, or MACD filters on/off.
Change MA type/length, MACD parameters, ADX threshold
- Use the visual blue diamonds (below bars) for long entries and purple diamonds (above bars) for short entries as confirmation of signals.
- Set alerts on the "Buy Alert" and "Sell Alert" conditions if you want real-time notifications.
This setup gives you a complete, rule-based system that avoids emotional trading and repetitive entries, making it suitable for both backtesting and live trading with proper risk management.

Udta Teer MKCIts normal vwap which is already available in TradingView. Now we have modified it with help of AI for bands

Fundamental Dashboard [Standalone]Overview
The Fundamental Strength Dashboard is a streamlined utility designed to evaluate the fundamental health of a stock directly on your chart. Instead of relying solely on price action, this indicator fetches real-time financial data to assess profitability, valuation, and financial stability.
It aggregates five core financial metrics into a single "Fundamental Score" (0-5) and displays a clear rating (Strong Buy, Buy, Neutral, or Weak/Sell) in a customizable dashboard table.
How It Works
The script analyzes the following 5 Key Fundamental Metrics. For a stock to receive a "point" for a specific metric, it must meet the criteria defined in your settings:
Net Income (Profitability): Checks if the company is actually profitable (Net Income > 0).
EPS (Earnings Per Share): Ensures the company has positive Earnings Per Share (TTM).
P/E Ratio (Valuation): Checks if the stock is valued reasonably compared to your maximum threshold (default: < 45).
Debt-to-Equity (Leverage): Analyzes financial risk. Lower is better (default: < 0.5).
ROE (Efficiency): Measures how effectively management uses equity to generate profit (default: > 15%).
The Scoring System
The indicator calculates a cumulative score based on how many of the above criteria are met:
Score 5/5 → STRONG BUY: The stock meets all profitability, valuation, and stability criteria.
Score 4/5 → BUY: The stock misses only one criterion but is otherwise fundamentally sound.
Score 0-3 → WEAK / SELL: The stock fails multiple fundamental checks (e.g., negative earnings, high debt, or overvaluation).
Features & Customization
Every trader has different risk appetites and sector preferences. You can fully customize the thresholds in the Settings menu:
Max P/E Threshold: Adjust this based on the sector (e.g., Tech stocks typically have higher P/Es than Utilities).
Min ROE %: Set your requirement for management efficiency.
Max Debt/Equity: Tighten or loosen leverage requirements.
Visuals: Change the table position (Top Right, Bottom Right, etc.) and color scheme to match your chart theme.
How to Use
Add the indicator to your chart.
Open the Settings (Gear icon).
Adjust the Dynamic Thresholds to fit the sector you are trading.
Look at the dashboard on the chart to see a snapshot of the stock's fundamental health.
Disclaimer
This script is for educational and informational purposes only. It relies on third-party financial data provided by TradingView, which may occasionally be missing or delayed. Always do your own research (DYOR) before making investment decisions.

Futures Tick DashboardThis is a simple dashboard that shows the novice future trade the necessary info about the info about the Micro on mini futures contract they are thinking about trading

Ram Key Levels (Daily Horizontals) + Day SeparatorsRam Key Levels (Daily Horizontals) + Day Separators

Least Squares Moving Average Zero Lag LeadLSMA Zero‑Lag + Lead Indicator
This indicator is a modified Least Squares Moving Average (LSMA) designed to reduce lag and optionally introduce a controlled forward‑leaning (lead) component. It is intended to be used either directly on price or as a smoother, more responsive input source for other indicators such as RSI, MACD, or regime filters.
1. What LSMA Is Doing
LSMA (Least Squares Moving Average) fits a straight‑line regression to the last N bars and evaluates that line at the current bar. Unlike simple or exponential averages, LSMA implicitly models trend direction and slope, which makes it more responsive during directional moves.
2. Zero‑Lag Adjustment
The zero‑lag version applies a simple error‑correction technique:
ZL = 2 × LSMA − LSMA(previous)
This cancels part of the inherent regression delay, producing a smoother line that reacts faster to turns while remaining stable in trends.
3. Lead Component (Optional)
On top of the zero‑lag LSMA, a slope‑based lead is added:
Lead = ZL + k × (ZL − ZL(previous))
Here, the recent slope is projected forward by a user‑controlled factor (k). This does not predict price, but it shifts the average slightly in the direction of current momentum, improving responsiveness for signal generation.
4. Why This Helps RSI and Similar Indicators
RSI and many oscillators operate on raw price changes, which can be noisy and lag‑prone. Feeding RSI with LSMA ZL or LSMA ZL + Lead instead of raw close price:
• Reduces noise without excessive smoothing
• Aligns RSI swings with underlying trend direction
• Improves timing of overbought/oversold transitions
• Reduces late signals after sharp reversals
In practice, this produces an RSI that reacts faster in trends but stays calmer in chop.
5. Practical Usage Tips
• Use LSMA ZL as a clean, low‑lag replacement for price in oscillators
• Add small lead values (0.5–1.0) only if earlier signals are needed
• Avoid high lead values in choppy markets
• Combine with regime or volatility filters for best results
This indicator is best thought of as a signal‑conditioning layer rather than a standalone trading system.

Resumo de Velas (120) ROMANOCounting the last 120 candles with volume data
Count of positive candles + count of negative candles
Ratio between negative and positive candles
If the ratio is greater than 1.20, enter a sell position
If the ratio is less than 0.80, enter a buy position
Use on a high timeframe chart
------------------------
Contagem das ultimas 120 velas com volumes
Contagem velas positivas + contagem velas negativas
Razão entre negativas e positivas
Se a razão é maior que 1.20 entra em venda
Se a razão é menor que 0.80 entra em compra
Uso no grafico de alto timeframe

BTC Gann Harmonics Weighted + Phase + EMA OptimizedBTC Gann Harmonics Weighted + Phase + EMA Optimized

TP & SL Indicator [TheScalpingAnt]
Overview
TP & SL Levels Clean is a precision trade-management tool designed to instantly plot professional-grade Take Profit and Stop Loss levels directly on your chart. Whether you are scalping, swing trading, or managing high-risk execution, this indicator removes guesswork by automatically calculating your SL and up to three configurable TP targets, displaying them with clean price labels on the right side of the chart.
This tool is built for traders who demand clarity, discipline, and execution accuracy.
Core Concepts
This indicator is designed around three key trading principles:
• Risk Management First
A clearly defined Stop Loss is essential in every professional trading strategy. The indicator ensures your SL is always visible and precise.
• Structured Profit Taking
Instead of randomly exiting trades, the tool delivers predefined TP targets to support scaling out and disciplined exits.
• Clean Visual Execution
Levels are displayed with bold lines and price tags, ensuring immediate readability without cluttering the chart.
LONG and SHORT trading directions are fully supported, ensuring it fits any trading style and asset class.
Key Features
• Automatically plots:
o Entry price level
o Stop Loss level
o TP1 (mandatory)
o TP2 (optional)
o TP3 (optional)
• Works for:
o LONG & SHORT positions
• Adjustable percentages for:
o SL %
o TP1 %
o TP2 %
o TP3 %
• Toggle ON/OFF visibility for TP2 & TP3
• Clean professional design
• Smart decimal precision based on instrument price
• Stable drawing logic using only the latest bar (no historical clutter)
• Precise price labels aligned on the right side of the chart
• Customizable line width
• Lightweight, fast, and optimized for performance
Customization & Flexibility
The indicator allows full personalization to match your trading strategy:
• Manually set Entry Price or let the indicator auto-detect from current price
• Choose Trade Direction: LONG or SHORT
• Define your exact:
o Stop Loss %
o Take Profit % levels
• Enable or disable TP2 and TP3 depending on your strategy
• Adjust line thickness
• Automatically adjusts price label decimal formatting for Forex, Crypto, Indices, and Stocks
This gives you total flexibility to adapt the tool to scalping, day trading, swing trading, or long-term positioning.
How to Use
1. Apply the indicator to your chart
2. Set:
o Entry Price (or leave 0 for automatic detection)
o Trade Direction (LONG / SHORT)
3. Define SL %, TP1 %, and optionally TP2 & TP3 %
4. Enable TP2 / TP3 toggles if needed
5. The indicator instantly plots:
o Entry line
o Stop Loss line
o Take Profit levels
6. Trade with visual confidence knowing your execution levels are clearly defined
Example Use Case
A trader plans a LONG position at 1.20000.
They configure:
• SL = -1.20%
• TP1 = +0.90%
• TP2 = +0.90% (optional)
• TP3 = +0.90% (optional)
The indicator immediately displays:
• Entry Reference Level
• Stop Loss Zone
• Profit Targets
This gives the trader an instant, structured trading framework without manual calculations, improving discipline and execution speed.
Settings Breakdown
Inputs:
• Entry Price (0 = auto)
• Trade Direction (LONG / SHORT)
• Stop Loss %
• TP1 %
• TP2 %
• TP3 %
• Toggle ON / OFF TP2
• Toggle ON / OFF TP3
• Line Width
• Built-in intelligent decimal formatting
Visuals:
• Bold colored levels
• Clear labels with precise price values
• Transparent clean UI
• Optimal spacing for visibility
Conclusion
TP & SL Levels Clean is built for serious traders who understand that consistent profitability comes from structured execution, not emotions. By combining clarity, flexibility, and professional visualization, this indicator helps you manage trades with precision and confidence.
If you are looking to simplify your workflow, improve discipline, and present professional execution management on your charts, this tool is for you.
Disclaimer
This indicator does not provide financial advice or guaranteed profits. It is a technical tool designed to support trade planning and execution. Trading involves risk, and users should always conduct their own analysis and manage risk responsibly

Michael Mor - ATRMichael Mor -ATR is a clean, lightweight chart watermark that gives you key stock context at a glance — without cluttering your chart or covering price action.
It’s designed for traders who want essential fundamentals + recent performance visible directly on the chart, in a subtle, professional style.
What it shows
You can toggle each line on or off:
Company name (optional market cap: M / B / T)
Symbol & timeframe
Sector & industry
ATR (14) with percentage of price and a quick volatility indicator
🟢 low volatility
🟡 medium volatility
🔴 high volatility

CRT 4H-DAY (Candle Range Theory)CRT 4H-DAY (Candle Range Theory) is a clean, price-based analytical tool designed to help traders contextualize market structure across multiple time horizons.
The indicator highlights key reference levels derived from recent market ranges and visualizes them directly on the chart in a minimal, non-intrusive way.
Its purpose is to improve spatial awareness of price behavior rather than generate direct trading signals.
CRT Trading is built for discretionary traders who prefer to combine contextual levels with their own analysis, price action, and risk management rules.
Key characteristics:
Multi-timeframe contextual reference levels
Clean and customizable visual layout
Works across crypto, forex, indices, and stocks
Designed for intraday and swing analysis
No repainting
No buy/sell signals
No future data usage
This indicator does not provide financial advice and should be used strictly as a supplementary analytical tool.
This indicator is for educational and analytical purposes only.
It does not provide trading signals or investment advice.
All trading decisions remain the sole responsibility of the user.

Fundamental Dashboard Publishing this script is a great idea because many traders in the Indian market struggle with TradingView's lack of data for SME (Small and Medium Enterprise) stocks.
Here is a professional, detailed description you can use for the Publishing Page. I have broken it down into sections that highlight the unique "Hybrid" technology of your script.
Title Idea: Fundamental Dashboard Pro: SME & Hybrid Live Valuation
Description:
Overview
The Fundamental Dashboard Pro is a high-performance financial analysis tool specifically designed for the Indian Stock Market (NSE/BSE). It solves the biggest problem faced by TradingView users in India: Missing or delayed data for SME and mid-cap stocks.
While standard TradingView indicators rely solely on built-in data feeds (which are often "N/A" for stocks like Alpex Solar, Oriana Power, or Insolation Energy), this script uses a Custom Hybrid Engine. It prioritizes a built-in, high-accuracy database of ~1,700 stocks while falling back to live TradingView data for everything else.
Key Features
📊 Accurate SME Data: Includes pre-loaded, professional-grade fundamental data (EPS, Net Profit, Debt/Equity, ROE) for over 1,600 Indian companies, including the SME segment.
⚡ Real-Time P/E Calculation: Unlike static dashboards, this script calculates the Price-to-Earnings (P/E) ratio dynamically. It takes the static EPS from the database and divides it by the live market price, ensuring your valuation metrics update every second.
🛡️ Intelligent Fallback Logic: If a ticker is not found in the custom database, the script automatically attempts to fetch live data from TradingView’s servers, ensuring you are never left without information.
🔍 Manual Ticker Search: Includes a "Manual Search" input in settings to bypass auto-detection. This is perfect for stocks that use different naming conventions between NSE and BSE (e.g., searching by code 543620 for Insolation Energy).
🚦 Automatic Rating System: A 5-point scoring system that evaluates a stock based on profitability, valuation, leverage, and efficiency, providing a visual "Buy/Sell/Neutral" rating.
How the Hybrid System Works
EPS/ROE/Debt: These metrics are quarterly and are pulled from a high-precision snapshot of Screener.in data embedded in the script.
Live Price: Pulled directly from the chart ticker.
Dynamic P/E: Calculated as Live Price / Stored EPS. This makes the valuation "Market-Live."
Scoring Criteria
The dashboard evaluates every stock against 5 fundamental pillars:
Profitability: Is the company making a Net Profit?
Earning Power: Is the EPS positive?
Valuation: Is the Live P/E below the user-defined threshold?
Debt Health: Is the Debt-to-Equity ratio below the safety limit?
Efficiency: Is the Return on Equity (ROE) above the target percentage?
Instructions for Use
Auto-Mode: Simply add the script to your chart. It will detect the ticker automatically.
Manual-Mode: If the dashboard shows "NOT FOUND" for a specific SME stock, go to Settings > Data & Thresholds and type the ticker name exactly as it appears on Screener (e.g., ALPEXSOLAR).
Customization: You can adjust the P/E, ROE, and Debt thresholds in the settings menu to match your specific investment criteria (e.g., Value vs. Growth investing).
Internal Note for Publishing (Technical):
Version: Pine Script v5
Optimization: The script uses string-compressed data chunks to remain within the 80,000 token limit while maximizing the stock database size.
Scope: Designed specifically for Indian markets but compatible with global tickers via the fallback engine.

Aroon (Any Source)Aroon (Any Source)
Overview
This indicator is an enhanced version of the classic Aroon Oscillator. It measures trend dominance based on the recency of highs and lows, with added flexibility to operate on any chosen source series and an optional price-scaling mechanism based on VWAP distance.
What the Indicator Does
The Aroon Oscillator compares how recently the most recent high and low occurred within a lookback window. The result is a bounded oscillator that indicates whether buyers or sellers are currently dominant.
This version adds: - Ability to run Aroon on any source - Optional smoothing to reduce noise - Optional VWAP-based price scaling
Core Outputs
• Aroon Up (0–100): Strength of recent highs
• Aroon Down (0–100): Strength of recent lows
• Aroon Oscillator (−100 to +100): Net dominance (Up − Down)
Inputs and Options
• Source: Input series used for calculations
• Aroon Length: Lookback window
• Use Source for High/Low: Enables Aroon-like mode on any series
• Show Oscillator: Toggles oscillator plot
• Show Aroon Up/Down: Toggles component lines
• Smooth Oscillator: Light smoothing (EMA/RMA/SMA)
• VWAP Price Scaling: Scales signal by VWAP distance normalized by ATR
How to Use It
Use the oscillator as a trend regime filter. Positive values indicate bullish dominance; negative values indicate bearish dominance. VWAP scaling helps suppress signals near equilibrium and emphasize extended moves.
Practical Notes
• Measures recency, not magnitude
• Best used as a regime or bias input
• Especially effective intraday with VWAP scaling

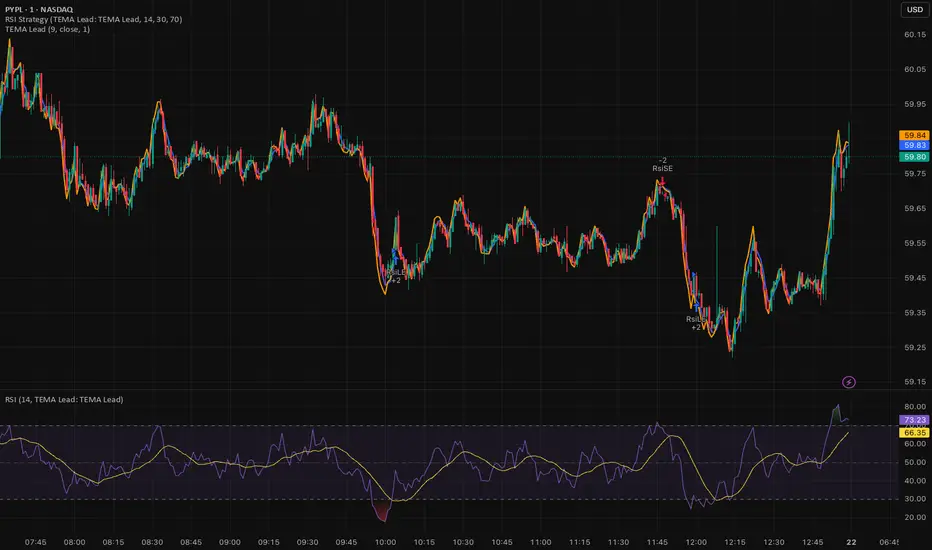
Triple EMA (TEMA) + Slope LeadThis indicator plots a standard Triple EMA (TEMA) and an optional slope-lead version. TEMA is a low-lag moving average built from three EMAs, allowing it to track price more closely than a single EMA. The Lead Strength (k) adds a small forward “push” based on the recent TEMA slope:
TEMA_lead = TEMA + k × (TEMA − TEMA ). Higher k values make the line react earlier but increase sensitivity in chop.
Used as a source for other indicators (RSI, MACD, stochastic, regime filters, etc.), TEMA or TEMA-Lead may improve signal quality by reducing noise, aligning momentum readings with trend direction, and producing earlier, cleaner transitions at turns, often without the excessive lag introduced by heavier smoothing.
My multiple MAs📈 My Multiple MAs — Multi-Timeframe Adaptive Moving Average
MY-MA is a multi-timeframe moving average indicator designed to help traders clearly identify trend direction, market cycles, and dynamic support & resistance using advanced MA logic.
This indicator combines Higher Timeframe Moving Averages with adaptive curve visualization, making it especially useful for swing trading, trend following, and market structure analysis.
🔹 Key Features
✅ Multi-Timeframe Moving Averages
- Plot moving averages from higher timeframes (e.g. 4H, 1D) directly on your current chart
- See the real trend context without switching timeframes
✅ Advanced MA Types
- Supports LMA (Least Moving Average) for smoother trend tracking
- Optional HIG / custom MA logic for cycle detection and turning points
✅ Market Cycle Visualization
- Curved MA behavior helps highlight trend expansion, exhaustion, and reversals
- Color-coded curves make bullish vs bearish phases easy to read
✅ Dynamic Price Labels
- Automatically displays MA price levels on the chart
- Helps identify key reaction zones and confluence areas
✅ Highly Customizable
- Control timeframe, MA length, source price, and offsets
- Toggle labels and lines independently for a clean chart
🔹 How to Use
- Above MA & rising → Bullish trend bias
- Below MA & falling → Bearish trend bias
- Price reacting near higher-TF MA → Potential support/resistance
- Curve flattening or bending → Possible trend exhaustion or reversal
- Best used together with price action, volume, or structure confirmation.
⚠️ Disclaimer
This indicator is a technical analysis tool only and does not provide financial advice. Always use proper risk management and confirmation before entering trades.

True Session Opens [TakingProphets]True Session Opens
- Description
- True Session Opens plots “true” session open levels (horizontal) for major trading windows
- Optional vertical session boundary markers and bottom session labels
- Built to keep charts clean with a timeframe visibility filter and lookback pruning
- What This Is (In Plain English)
- When a session starts (New York time), the script captures that candle’s open price
- A horizontal line is drawn from the session start and extended bar-by-bar to the current bar
- Optional vertical lines mark session start and end boundaries
- Optional bottom labels show ASIA, LONDON, NY.AM, and NY.PM near the midpoint of each session
-----------------------------------------------------------------------------------------------
Sessions Tracked (New York Time)
-----------------------------------------------------------------------------------------------
- ASIA - 20:00 to 00:00
- LONDON - 02:00 to 05:00
- NY.AM - 09:00 to 11:30
- NY.PM - 13:00 to 16:00
- IMPORTANT
- Session detection is anchored to America/New_York
- Adjust session windows in Session Definitions if your instrument requires different killzones
-----------------------------------------------------------------------------------------------
How To Use
-----------------------------------------------------------------------------------------------
- Add this indicator to intraday charts for clean session reference levels
- Use session opens as reaction levels, anchors, or confluence with your model
- Enable verticals for timing context, disable them for a minimal chart
- Recommended Workflow
- Keep ASIA and LONDON enabled during London / NY overlap
- Keep NY.AM and NY.PM enabled for New York session context
- Lower timeframes (1m–15m) are recommended for best clarity
-----------------------------------------------------------------------------------------------
Settings Guide
-----------------------------------------------------------------------------------------------
- General
- Lookback
- Controls how far back session verticals remain visible
- Options: 1 Day, 3 Days, 5 Days, 1 Week, 1 Month
- Older session markers are pruned automatically for performance and cleanliness
- Highest Timeframe Visibility
- Prevents session visuals from displaying on higher timeframes
- Example: if set to 15m, sessions will not appear on 30m, 1H, or higher
- When exceeded, existing visuals are removed to keep the chart clean
- Session Definitions
- Defines session time windows (New York time)
- Modify these inputs if you want custom session ranges
- Session Opens
- Individual toggles for ASIA, LONDON, NY.AM, and NY.PM
- Custom color per session
- Adjustable line style and line width
- Configurable open label size
- Session Verticals
- Toggle vertical lines at session start and end
- Customize vertical line color and style
- Toggle bottom session name labels
-----------------------------------------------------------------------------------------------
Visual Output
-----------------------------------------------------------------------------------------------
- Horizontal Open Lines
- Plotted at the opening price of each session
- Right-pinned labels using short codes
- asia.open
- lo.open
- nyam.open
- nypm.open
- Vertical Session Lines (Optional)
- Vertical markers at session start and end
- Managed by lookback pruning
- Bottom Session Labels (Optional)
- Session names printed at the bottom of the chart
- Positioned near the midpoint of each session window
-----------------------------------------------------------------------------------------------
Best Practices
-----------------------------------------------------------------------------------------------
- Use 1m–15m for clean intraday session structure
- Disable verticals if you only want

SETUP HMTR ZONESETUP HMTR ZONE
This indicator highlights high-probability market extremes by detecting a rare alignment between independent heatmap engines.
Captures volatility squeeze, trend exhaustion, and pressure asymmetry.
🎯 What the indicator does
🔵 Cold Match (Blue)
Appears when all engines detect cooling, fear, and liquidity contraction.
Often forms near accumulation phases, oversold washes, structural resets, discount zones.
🔴 Hot Match (Red)
Appears when all components show overheating, exhaustion, and aggressive pressure.
Often precedes distribution phases, liquidity grabs, blow-off tops, or trend fatigue.
✨ Why this matters
This tool does not give buy/sell entries.
It provides contextual confirmation of:
emerging accumulation or distribution
cooling or overheating phases
liquidity-driven stress points
behavioral extremes
regime shifts in trend structure
Use it as a market overlay layer, not as a standalone entry trigger.
🔔 Alerts Included
Cold zone
Hot zone
Signals fire only on confirmed candle close.
✔️ Best for traders who value:
risk-aware positioning
cycle and regime analysis
structural confirmation
heatmap-based market context
smart-money aligned behavior
