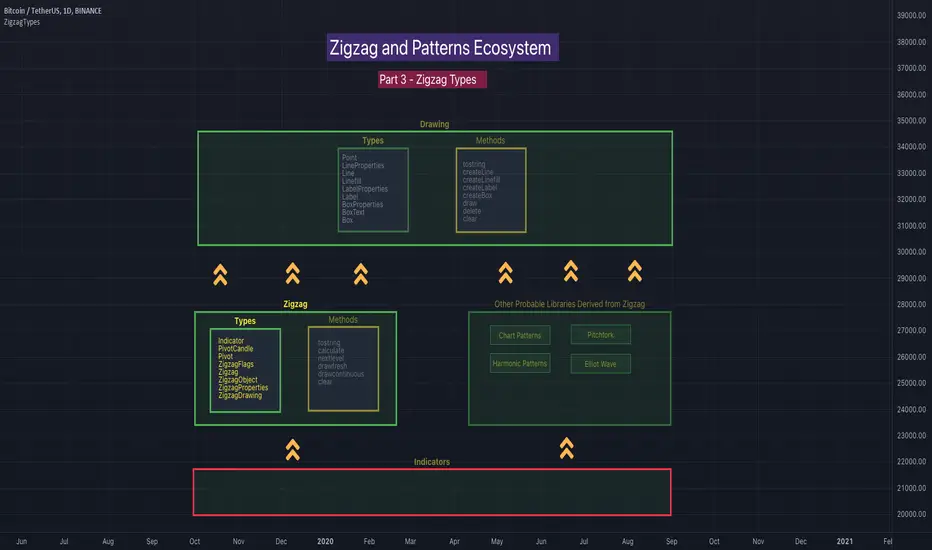
ZigzagMethodsLibrary "ZigzagMethods"
Object oriented implementation of Zigzag methods. Please refer to ZigzagTypes library for User defined types used in this library
tostring(this, sortKeys, sortOrder, includeKeys)
Converts ZigzagTypes/Pivot object to string representation
Parameters:
this : ZigzagTypes/Pivot
sortKeys : If set to true, string output is sorted by keys.
sortOrder : Applicable only if sortKeys is set to true. Positive number will sort them in ascending order whreas negative numer will sort them in descending order. Passing 0 will not sort the keys
includeKeys : Array of string containing selective keys. Optional parmaeter. If not provided, all the keys are considered
Returns: string representation of ZigzagTypes/Pivot
tostring(this, sortKeys, sortOrder, includeKeys)
Converts Array of Pivot objects to string representation
Parameters:
this : Pivot object array
sortKeys : If set to true, string output is sorted by keys.
sortOrder : Applicable only if sortKeys is set to true. Positive number will sort them in ascending order whreas negative numer will sort them in descending order. Passing 0 will not sort the keys
includeKeys : Array of string containing selective keys. Optional parmaeter. If not provided, all the keys are considered
Returns: string representation of Pivot object array
tostring(this)
Converts ZigzagFlags object to string representation
Parameters:
this : ZigzagFlags object
Returns: string representation of ZigzagFlags
tostring(this, sortKeys, sortOrder, includeKeys)
Converts ZigzagTypes/Zigzag object to string representation
Parameters:
this : ZigzagTypes/Zigzagobject
sortKeys : If set to true, string output is sorted by keys.
sortOrder : Applicable only if sortKeys is set to true. Positive number will sort them in ascending order whreas negative numer will sort them in descending order. Passing 0 will not sort the keys
includeKeys : Array of string containing selective keys. Optional parmaeter. If not provided, all the keys are considered
Returns: string representation of ZigzagTypes/Zigzag
calculate(this, ohlc, indicators, indicatorNames)
Calculate zigzag based on input values and indicator values
Parameters:
this : Zigzag object
ohlc : Array containing OHLC values. Can also have custom values for which zigzag to be calculated
indicators : Array of indicator values
indicatorNames : Array of indicator names for which values are present. Size of indicators array should be equal to that of indicatorNames
Returns: current Zigzag object
calculate(this)
Calculate zigzag based on properties embedded within Zigzag object
Parameters:
this : Zigzag object
Returns: current Zigzag object
nextlevel(this)
Calculate Next Level Zigzag based on the current calculated zigzag object
Parameters:
this : Zigzag object
Returns: Next Level Zigzag object
clear(this)
Clears zigzag drawings array
Parameters:
this : array
Returns: void
drawfresh(this)
draws fresh zigzag based on properties embedded in ZigzagDrawing object
Parameters:
this : ZigzagDrawing object
Returns: ZigzagDrawing object
drawcontinuous(this)
draws zigzag based on the zigzagmatrix input
Parameters:
this : ZigzagDrawing object
Returns:
Vagues d'Elliott

ZigzagTypesLibrary "ZigzagTypes"
Zigzag related user defined types. Depends on DrawingTypes library for basic types
Indicator
Indicator is collection of indicator values applied on high, low and close
Fields:
indicatorHigh : Indicator Value applied on High
indicatorLow : Indicator Value applied on Low
PivotCandle
PivotCandle represents data of the candle which forms either pivot High or pivot low or both
Fields:
_high : High price of candle forming the pivot
_low : Low price of candle forming the pivot
length : Pivot length
pHighBar : represents number of bar back the pivot High occurred.
pLowBar : represents number of bar back the pivot Low occurred.
pHigh : Pivot High Price
pLow : Pivot Low Price
indicators : Array of Indicators - allows to add multiple
Pivot
Pivot refers to zigzag pivot. Each pivot can contain various data
Fields:
point : pivot point coordinates
dir : direction of the pivot. Valid values are 1, -1, 2, -2
level : is used for multi level zigzags. For single level, it will always be 0
ratio : Price Ratio based on previous two pivots
indicatorNames : Names of the indicators applied on zigzag
indicatorValues : Values of the indicators applied on zigzag
indicatorRatios : Ratios of the indicators applied on zigzag based on previous 2 pivots
ZigzagFlags
Flags required for drawing zigzag. Only used internally in zigzag calculation. Should not set the values explicitly
Fields:
newPivot : true if the calculation resulted in new pivot
doublePivot : true if the calculation resulted in two pivots on same bar
updateLastPivot : true if new pivot calculated replaces the old one.
Zigzag
Zigzag object which contains whole zigzag calculation parameters and pivots
Fields:
length : Zigzag length. Default value is 5
numberOfPivots : max number of pivots to hold in the calculation. Default value is 20
offset : Bar offset to be considered for calculation of zigzag. Default is 0 - which means calculation is done based on the latest bar.
level : Zigzag calculation level - used in multi level recursive zigzags
zigzagPivots : array which holds the last n pivots calculated.
flags : ZigzagFlags object which is required for continuous drawing of zigzag lines.
ZigzagObject
Zigzag Drawing Object
Fields:
zigzagLine : Line joining two pivots
zigzagLabel : Label which can be used for drawing the values, ratios, directions etc.
ZigzagProperties
Object which holds properties of zigzag drawing. To be used along with ZigzagDrawing
Fields:
lineColor : Zigzag line color. Default is color.blue
lineWidth : Zigzag line width. Default is 1
lineStyle : Zigzag line style. Default is line.style_solid.
showLabel : If set, the drawing will show labels on each pivot. Default is false
textColor : Text color of the labels. Only applicable if showLabel is set to true.
maxObjects : Max number of zigzag lines to display. Default is 300
xloc : Time/Bar reference to be used for zigzag drawing. Default is Time - xloc.bar_time.
ZigzagDrawing
Object which holds complete zigzag drawing objects and properties.
Fields:
properties : ZigzagProperties object which is used for setting the display styles of zigzag
drawings : array which contains lines and labels of zigzag drawing.
zigzag : Zigzag object which holds the calculations.
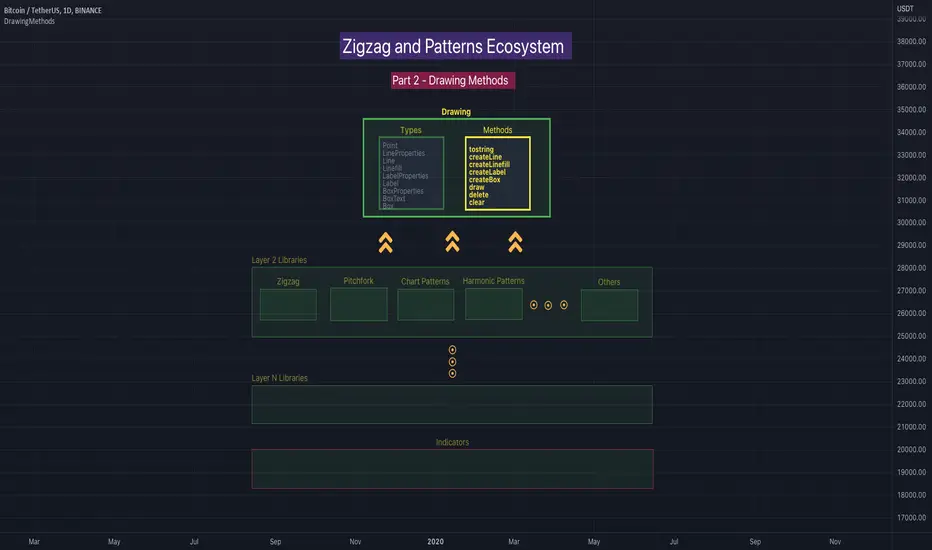
DrawingMethodsLibrary "DrawingMethods"
tostring(this, sortKeys, sortOrder, includeKeys)
Converts DrawingTypes/Point object to string representation
Parameters:
this : DrawingTypes/Point object
sortKeys : If set to true, string output is sorted by keys.
sortOrder : Applicable only if sortKeys is set to true. Positive number will sort them in ascending order whreas negative numer will sort them in descending order. Passing 0 will not sort the keys
includeKeys : Array of string containing selective keys. Optional parmaeter. If not provided, all the keys are considered
Returns: string representation of DrawingTypes/Point
tostring(this, sortKeys, sortOrder, includeKeys)
Converts DrawingTypes/LineProperties object to string representation
Parameters:
this : DrawingTypes/LineProperties object
sortKeys : If set to true, string output is sorted by keys.
sortOrder : Applicable only if sortKeys is set to true. Positive number will sort them in ascending order whreas negative numer will sort them in descending order. Passing 0 will not sort the keys
includeKeys : Array of string containing selective keys. Optional parmaeter. If not provided, all the keys are considered
Returns: string representation of DrawingTypes/LineProperties
tostring(this, sortKeys, sortOrder, includeKeys)
Converts DrawingTypes/Line object to string representation
Parameters:
this : DrawingTypes/Line object
sortKeys : If set to true, string output is sorted by keys.
sortOrder : Applicable only if sortKeys is set to true. Positive number will sort them in ascending order whreas negative numer will sort them in descending order. Passing 0 will not sort the keys
includeKeys : Array of string containing selective keys. Optional parmaeter. If not provided, all the keys are considered
Returns: string representation of DrawingTypes/Line
tostring(this, sortKeys, sortOrder, includeKeys)
Converts DrawingTypes/LabelProperties object to string representation
Parameters:
this : DrawingTypes/LabelProperties object
sortKeys : If set to true, string output is sorted by keys.
sortOrder : Applicable only if sortKeys is set to true. Positive number will sort them in ascending order whreas negative numer will sort them in descending order. Passing 0 will not sort the keys
includeKeys : Array of string containing selective keys. Optional parmaeter. If not provided, all the keys are considered
Returns: string representation of DrawingTypes/LabelProperties
tostring(this, sortKeys, sortOrder, includeKeys)
Converts DrawingTypes/Label object to string representation
Parameters:
this : DrawingTypes/Label object
sortKeys : If set to true, string output is sorted by keys.
sortOrder : Applicable only if sortKeys is set to true. Positive number will sort them in ascending order whreas negative numer will sort them in descending order. Passing 0 will not sort the keys
includeKeys : Array of string containing selective keys. Optional parmaeter. If not provided, all the keys are considered
Returns: string representation of DrawingTypes/Label
tostring(this, sortKeys, sortOrder, includeKeys)
Converts DrawingTypes/Linefill object to string representation
Parameters:
this : DrawingTypes/Linefill object
sortKeys : If set to true, string output is sorted by keys.
sortOrder : Applicable only if sortKeys is set to true. Positive number will sort them in ascending order whreas negative numer will sort them in descending order. Passing 0 will not sort the keys
includeKeys : Array of string containing selective keys. Optional parmaeter. If not provided, all the keys are considered
Returns: string representation of DrawingTypes/Linefill
tostring(this, sortKeys, sortOrder, includeKeys)
Converts DrawingTypes/BoxProperties object to string representation
Parameters:
this : DrawingTypes/BoxProperties object
sortKeys : If set to true, string output is sorted by keys.
sortOrder : Applicable only if sortKeys is set to true. Positive number will sort them in ascending order whreas negative numer will sort them in descending order. Passing 0 will not sort the keys
includeKeys : Array of string containing selective keys. Optional parmaeter. If not provided, all the keys are considered
Returns: string representation of DrawingTypes/BoxProperties
tostring(this, sortKeys, sortOrder, includeKeys)
Converts DrawingTypes/BoxText object to string representation
Parameters:
this : DrawingTypes/BoxText object
sortKeys : If set to true, string output is sorted by keys.
sortOrder : Applicable only if sortKeys is set to true. Positive number will sort them in ascending order whreas negative numer will sort them in descending order. Passing 0 will not sort the keys
includeKeys : Array of string containing selective keys. Optional parmaeter. If not provided, all the keys are considered
Returns: string representation of DrawingTypes/BoxText
tostring(this, sortKeys, sortOrder, includeKeys)
Converts DrawingTypes/Box object to string representation
Parameters:
this : DrawingTypes/Box object
sortKeys : If set to true, string output is sorted by keys.
sortOrder : Applicable only if sortKeys is set to true. Positive number will sort them in ascending order whreas negative numer will sort them in descending order. Passing 0 will not sort the keys
includeKeys : Array of string containing selective keys. Optional parmaeter. If not provided, all the keys are considered
Returns: string representation of DrawingTypes/Box
delete(this)
Deletes line from DrawingTypes/Line object
Parameters:
this : DrawingTypes/Line object
Returns: Line object deleted
delete(this)
Deletes label from DrawingTypes/Label object
Parameters:
this : DrawingTypes/Label object
Returns: Label object deleted
delete(this)
Deletes Linefill from DrawingTypes/Linefill object
Parameters:
this : DrawingTypes/Linefill object
Returns: Linefill object deleted
delete(this)
Deletes box from DrawingTypes/Box object
Parameters:
this : DrawingTypes/Box object
Returns: DrawingTypes/Box object deleted
delete(this)
Deletes lines from array of DrawingTypes/Line objects
Parameters:
this : Array of DrawingTypes/Line objects
Returns: Array of DrawingTypes/Line objects
delete(this)
Deletes labels from array of DrawingTypes/Label objects
Parameters:
this : Array of DrawingTypes/Label objects
Returns: Array of DrawingTypes/Label objects
delete(this)
Deletes linefill from array of DrawingTypes/Linefill objects
Parameters:
this : Array of DrawingTypes/Linefill objects
Returns: Array of DrawingTypes/Linefill objects
delete(this)
Deletes boxes from array of DrawingTypes/Box objects
Parameters:
this : Array of DrawingTypes/Box objects
Returns: Array of DrawingTypes/Box objects
clear(this)
clear items from array of DrawingTypes/Line while deleting underlying objects
Parameters:
this : array
Returns: void
clear(this)
clear items from array of DrawingTypes/Label while deleting underlying objects
Parameters:
this : array
Returns: void
clear(this)
clear items from array of DrawingTypes/Linefill while deleting underlying objects
Parameters:
this : array
Returns: void
clear(this)
clear items from array of DrawingTypes/Box while deleting underlying objects
Parameters:
this : array
Returns: void
draw(this)
Creates line from DrawingTypes/Line object
Parameters:
this : DrawingTypes/Line object
Returns: line created from DrawingTypes/Line object
draw(this)
Creates lines from array of DrawingTypes/Line objects
Parameters:
this : Array of DrawingTypes/Line objects
Returns: Array of DrawingTypes/Line objects
draw(this)
Creates label from DrawingTypes/Label object
Parameters:
this : DrawingTypes/Label object
Returns: label created from DrawingTypes/Label object
draw(this)
Creates labels from array of DrawingTypes/Label objects
Parameters:
this : Array of DrawingTypes/Label objects
Returns: Array of DrawingTypes/Label objects
draw(this)
Creates linefill object from DrawingTypes/Linefill
Parameters:
this : DrawingTypes/Linefill objects
Returns: linefill object created
draw(this)
Creates linefill objects from array of DrawingTypes/Linefill objects
Parameters:
this : Array of DrawingTypes/Linefill objects
Returns: Array of DrawingTypes/Linefill used for creating linefills
draw(this)
Creates box from DrawingTypes/Box object
Parameters:
this : DrawingTypes/Box object
Returns: box created from DrawingTypes/Box object
draw(this)
Creates labels from array of DrawingTypes/Label objects
Parameters:
this : Array of DrawingTypes/Label objects
Returns: Array of DrawingTypes/Label objects
createLabel(this, lblText, tooltip, properties)
Creates DrawingTypes/Label object from DrawingTypes/Point
Parameters:
this : DrawingTypes/Point object
lblText : Label text
tooltip : Tooltip text. Default is na
properties : DrawingTypes/LabelProperties object. Default is na - meaning default values are used.
Returns: DrawingTypes/Label object
createLine(this, other, properties)
Creates DrawingTypes/Line object from one DrawingTypes/Point to other
Parameters:
this : First DrawingTypes/Point object
other : Second DrawingTypes/Point object
properties : DrawingTypes/LineProperties object. Default set to na - meaning default values are used.
Returns: DrawingTypes/Line object
createLinefill(this, other, fillColor, transparency)
Creates DrawingTypes/Linefill object from DrawingTypes/Line object to other DrawingTypes/Line object
Parameters:
this : First DrawingTypes/Line object
other : Other DrawingTypes/Line object
fillColor : fill color of linefill. Default is color.blue
transparency : fill transparency for linefill. Default is 80
Returns: Array of DrawingTypes/Linefill object
createBox(this, other, properties, textProperties)
Creates DrawingTypes/Box object from one DrawingTypes/Point to other
Parameters:
this : First DrawingTypes/Point object
other : Second DrawingTypes/Point object
properties : DrawingTypes/BoxProperties object. Default set to na - meaning default values are used.
textProperties : DrawingTypes/BoxText object. Default is na - meaning no text will be drawn
Returns: DrawingTypes/Box object
createBox(this, properties, textProperties)
Creates DrawingTypes/Box object from DrawingTypes/Line as diagonal line
Parameters:
this : Diagonal DrawingTypes/PoLineint object
properties : DrawingTypes/BoxProperties object. Default set to na - meaning default values are used.
textProperties : DrawingTypes/BoxText object. Default is na - meaning no text will be drawn
Returns: DrawingTypes/Box object
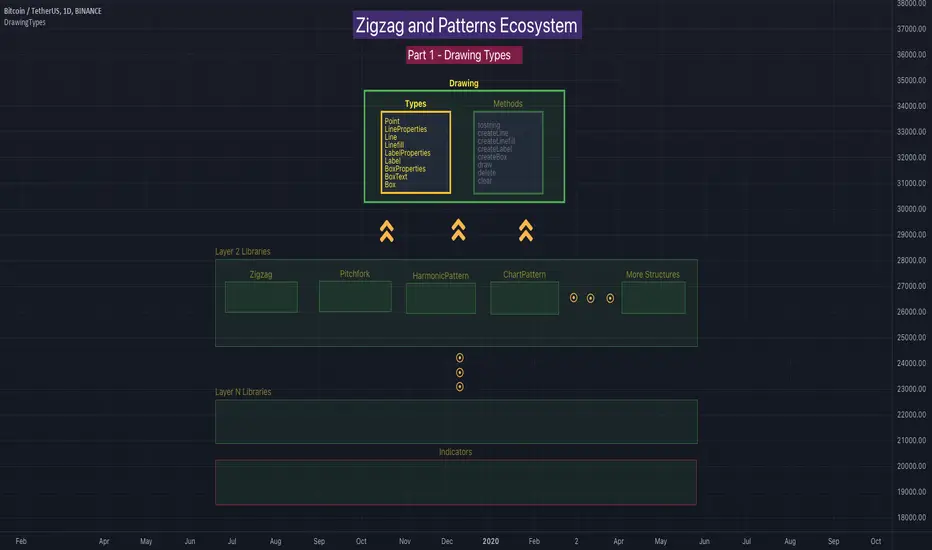
DrawingTypesLibrary "DrawingTypes"
User Defined Types for basic drawing structure. Other types and methods will be built on these.
Point
Point refers to point on chart
Fields:
price : pivot price
bar : pivot bar
bartime : pivot bar time
LineProperties
Properties of line object
Fields:
xloc : X Reference - can be either xloc.bar_index or xloc.bar_time. Default is xloc.bar_index
extend : Property which sets line to extend towards either right or left or both. Valid values are extend.right, extend.left, extend.both, extend.none. Default is extend.none
color : Line color
style : Line style, valid values are line.style_solid, line.style_dashed, line.style_dotted, line.style_arrow_left, line.style_arrow_right, line.style_arrow_both. Default is line.style_solid
width : Line width. Default is 1
Line
Line object created from points
Fields:
start : Starting point of the line
end : Ending point of the line
properties : LineProperties object which defines the style of line
object : Derived line object
LabelProperties
Properties of label object
Fields:
xloc : X Reference - can be either xloc.bar_index or xloc.bar_time. Default is xloc.bar_index
yloc : Y reference - can be yloc.price, yloc.abovebar, yloc.belowbar. Default is yloc.price
color : Label fill color
style : Label style as defined in www.tradingview.com Default is label.style_none
textcolor : text color. Default is color.black
size : Label text size. Default is size.normal. Other values are size.auto, size.tiny, size.small, size.normal, size.large, size.huge
textalign : Label text alignment. Default if text.align_center. Other allowed values - text.align_right, text.align_left, text.align_top, text.align_bottom
text_font_family : The font family of the text. Default value is font.family_default. Other available option is font.family_monospace
Label
Label object
Fields:
point : Point where label is drawn
lblText : label text
tooltip : Tooltip text. Default is na
properties : LabelProperties object
object : Pine label object
Linefill
Linefill object
Fields:
line1 : First line to create linefill
line2 : Second line to create linefill
fillColor : Fill color
transparency : Fill transparency range from 0 to 100
object : linefill object created from wrapper
BoxProperties
BoxProperties object
Fields:
border_color : Box border color. Default is color.blue
bgcolor : box background color
border_width : Box border width. Default is 1
border_style : Box border style. Default is line.style_solid
extend : Extend property of box. default is extend.none
xloc : defines if drawing needs to be done based on bar index or time. default is xloc.bar_index
BoxText
Box Text properties.
Fields:
boxText : Text to be printed on the box
text_size : Text size. Default is size.auto
text_color : Box text color. Default is color.yellow.
text_halign : horizontal align style - default is text.align_center
text_valign : vertical align style - default is text.align_center
text_wrap : text wrap style - default is text.wrap_auto
text_font_family : Text font. Default is
Box
Box object
Fields:
p1 : Diagonal point one
p2 : Diagonal point two
properties : Box properties
textProperties : Box text properties
object : Box object created
Elliott Wave - HAP [PRO] █ OVERVIEW
Meet HAP WAVE's real-time automated wave drawing tool on the chart. HAP WAVES Indicator is a technical analysis tool that uses Elliott Wave Theory and various technical indicators to analyze price and volume data in financial markets, such as crypto, stocks, and forex. It automatically draws Elliott Waves on the chart in real-time and provides features to identify potential buy and sell signals. The indicator can be used to identify target areas for waves 3, 5, and C, and shows both downward and upward waves. Additionally, the tool displays the real-time ratio of each wave and allows users to adjust wave rules flexibly. The tool also provides pre-sign analysis to help users predict future waves and includes alerts for various events, such as the start of a wave or the failure of a wave pattern. The indicator includes a trend channel and has several pairs of scan-wave tools. including real-time wave counting
════════════════════════
🎯 Feature
• Can draw wave lines in real time, indicating at that moment what wave the market is in.
• Automatically identify the target area of waves 3, 5, and C.
• Keep drawing waves automatically. All waves
• Shows both a downward wave (Bear) and an upward wave (Bull).
• Displays the real time ratio of each wave. (when hovering over the wave number)
• Each wave rule can be adjusted flexibly.
• Pre-show signs analyze waves that may occur in the future.
• Alert yourself when you encounter waves that are likely to occur in advance.
• Notify when meeting the start of a given wave.
• Alert when wave 2,4,A,B fail
• Notify when the wave is expanding again
• Multiple alert formats (save your alert, set it up just once, and receive all alerts according to 9–12)
• Hit Trend Channel from Automatic Coupled Price Swing
*There are also several pairs of scan wave tools.
════════════════════════
🔻Components
🎯 Unlocking the Power of the Elliott Wave Theory
feature that can set the starting point of the wave. by yourself
Trend Following Of course, adding this could be an element to help you make your decision easier.
Support and resistance
🎲 Scan version
This :
================================
🎯 Explanation of the wave counter setting section
════════════════════════
⬜ Understanding its basic principles and rules
Elliott Wave Prediction
Elliott Wave Theory is a technical analysis tool that seeks to identify patterns in financial market data and to make predictions about future price movements. The theory was developed by Ralph Nelson Elliott in the 1930s and is based on the idea that financial markets move in repetitive patterns, or waves, that can be analyzed and traded.
The Elliott Wave Theory has specific rules and guidelines for counting waves and determining their characteristics, including direction, size, and duration. The theory divides waves into two categories: motive waves (1, 2, 3, 4, and 5) and corrective waves (A, B, C). Motive waves are those that move in the direction of the overall trend and are subdivided into five smaller waves. Corrective waves are those that move against the trend and are subdivided into three smaller waves.
The theory also includes guidelines for determining the end of a wave and the start of a new wave, as well as rules for determining the characteristics of each wave, such as its size and duration. By analyzing the characteristics of waves and applying the rules and guidelines of the Elliott Wave Theory, traders and investors can make informed decisions about buying and selling in financial markets.
In summary, the Elliott Wave Theory is a technical analysis tool that seeks to identify patterns in financial market data and to make predictions about future price movements. The theory is based on the idea that financial markets move in repetitive patterns, or waves, and has specific rules and guidelines for counting and analyzing these waves.
>> The Elliott Wave Theory divides financial market movements into two categories: motive waves and corrective waves. Each wave has its own cycle and purpose, and understanding these cycles is important for making informed decisions about buying and selling in financial markets.
Motive Waves: Motive waves move in the direction of the overall trend and are subdivided into five smaller waves. The five waves of a motive wave cycle are:
•Wave 1: The first wave of a motive wave cycle is often referred to as the "impulse wave." This wave represents the beginning of a new trend and is characterized by strong price movements in the direction of the trend.
•Wave 2: The second wave is a corrective wave that retraces a portion of the gains made in Wave 1. This wave is usually smaller and less intense than Wave 1.
•Wave 3: The third wave is usually the longest and strongest wave of the motive wave cycle, and it represents the continuation of the trend. This wave is characterized by strong price movements in the direction of the trend and is usually much larger than Waves 1 and 2.
•Wave 4: The fourth wave is a corrective wave that retraces a portion of the gains made in Wave 3. This wave is usually smaller and less intense than Waves 1 and 3, and it provides a temporary pause in the trend.
•Wave 5: The fifth wave is the final wave of the motive wave cycle and is usually the shortest and weakest wave. This wave represents the end of the trend and is characterized by a final push in the direction of the trend.
Corrective Waves: Corrective waves move against the trend and are subdivided into three smaller waves. The three waves of a corrective wave cycle are:
•A. Wave A: The first wave of a corrective wave cycle is often referred to as the "A wave." This wave is characterized by a downward move against the trend and represents the start of a correction.
•B. Wave B: The second wave of a corrective wave cycle is the "B wave." This wave is characterized by an upward move against the trend, and it represents the counter-trend rally.
•C. Wave C: The final wave of a corrective wave cycle is the "C wave." This wave is characterized by a downward move in the direction of the trend, and it represents the completion of the correction.
In summary, the Elliott Wave Theory divides financial market movements into two categories: motive waves, which move in the direction of the trend, and corrective waves, which move against the trend. Understanding the cycle of each wave is important for making informed decisions about buying and selling in financial markets.
════════════════════════
🎯 CONCEPTS (Disclaimer)
Elliott Wave Count
The HAP WAVES indicator is designed for experienced traders who are familiar with advanced trading techniques. This tool is intended for day traders and long-term investors who have a solid understanding of the market and are looking to improve their trading strategy. The indicator was created by a well-known market analyst and is based on the principles and techniques documented in several books, including those by `Jason Perl`.
It is recommended that users of the HAP WAVES indicator have a good understanding of the concepts and techniques discussed in the books that cover this indicator. Before using the tool, it is important to have a good understanding of the underlying principles and techniques in order to make the most of the indicator and potentially improve your trading performance.
════════════════════════
🎯 Rules and Principles of this Indicator
* This description only addresses bullish (uptrend) markets, while bearish (downtrend) gives let you look a vice versa.
• ▶ HAP WAVES Requirements for Wave 1
The Wave 1 HAP WAVES requirements for a bullish (rising) market require that the market has closed a minimum of 21 bars below all 20 previous closes, then closes a maximum of 13 bars above all 12 previous closes, and finally reaches an 8 bar close below all 7 previous closes, to confirm that Wave 2 has formed.
• ▶ HAP WAVES Requirements for Wave 2
The first requirement for Wave 2 is the last requirement for Wave 1, which is a close of at least 8 bars with a close less than the previous 7 bars. Wave 2 continues until the market records a 21-bar close above all 20 previous closes, indicating the start of Wave 3.
• ▶ HAP WAVES Requirements for Wave 3
Wave 3 is confirmed after Wave 2 closes at 21 bars high, and it continues until there is a 13 bar close, indicating the end of Wave 3 and the start of Wave 4.
• ▶ HAP WAVES Requirements for Wave 4
The first requirement for Wave 4 is that there is a close at 13 bars after the end of Wave 3. Wave 4 is complete when the market records a 34 bar close (above all previous 33 closes), indicating the start of Wave 5.
• ▶ HAP WAVES Requirements for Wave 5
The first requirement for Wave 5 is a 34 bar close, signaling the end of Wave 4. The wave is considered complete when a 13 bar close is published, resulting in Wave A.
• ▶ HAP WAVES Requirements for Wave A
The HAP WAVES Requirements for Wave A state that the first call for Wave A is a 13 bar close (close below all previous 12 closes), signaling the end of Wave 5. Wave A is considered complete with an 8 bar high close (close above previous 7 closes), leading to the start of Wave B.
• ▶ HAP WAVES Requirements for Wave B
The first requirement for Wave B is a 8 bar high close (close above the previous 7 closes) after Wave A. Wave B is complete when there is a 21 bar low close (close below all 20 previous closes).
• ▶ HAP WAVES Requirements for Wave C
Wave C starts with a close of 21 bars low for Wave C, meaning the market close is below all 20 previous closes. Wave C is considered closed when the market closes below the close low of Wave A.
* Additional rules to apply the HAP WAVES indicator to the bullish trend
• The peak of Wave 3 must be higher than the close of Wave 1, and the peak of Wave 5 must be higher than the peak of Wave 3.
• If the pullback from Wave 1 is shallow, and the market later retraces above the high close of Wave 1, Wave 1 will slide to the right to align with the new high close.
• If the pullback from Wave 3 is shallow, and the market later retraces above the high close of Wave 3, Wave 3 will slide to the right to align with the new high close.
• Wave 5 will only be confirmed if Wave C crosses the low close of Wave A. If Wave B closes above the high close of Wave 5, Waves A, B and C will be erased and Wave 5 will slide to the right.
• If Wave 2 closes below the low close of Wave 1, the countdown will start over, and if Wave 4 closes below the low close of Wave 2, Wave 2 will move to the location of Wave 4.
• After Wave C crosses the low close of Wave A, Wave 5 will be locked in and cannot move. If the market later retraces above the high close of Wave 5, it will be marked as a new advance in Wave 1 rather than a blur of the previous Wave 5.
════════════════════════

Simple Zigzag UDT█ OVERVIEW
This indicator displays zigzag based on high and low, which is using user-defined types (UDT) or objects .
█ CREDITS
LonesomeTheBlue
█ FEATURES
1. Label can be resized.
2. Label can be display either short (Eg : HH, LL, H, L, etc) and long (Eg : Higher Low, etc)
3. Color can be customized either contrast color of chart background, trend color or customized color.
█ EXAMPLES / USAGES

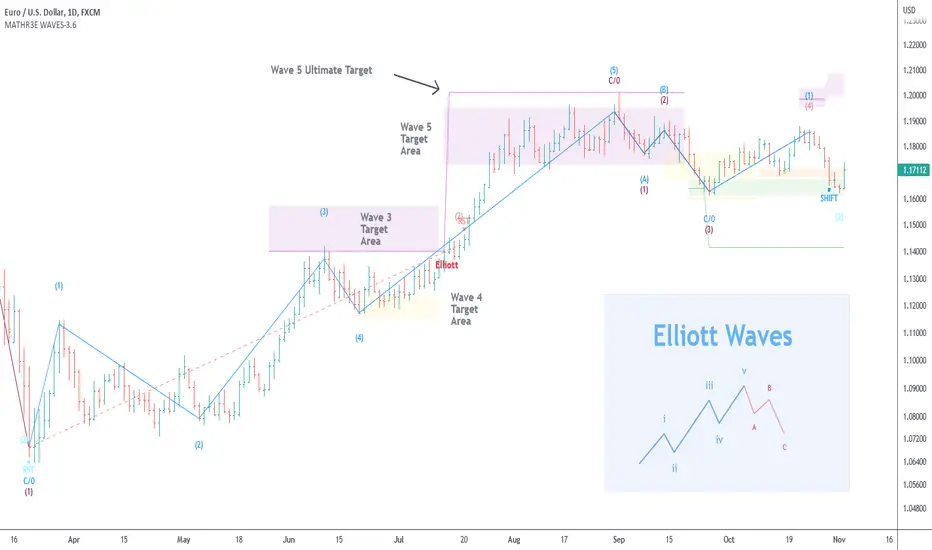
MATHR3E WAVES█ OVERVIEW
MATHR3E WAVES automatically draws Elliott Waves on your charts with their potential associated targets.
█ CONCEPTS
Disclaimer
MATHR3E RETRACEMENTS indicator is intended for advanced traders and may fit your profile, whether you are a day trader or a long-term investor.
It was originally developed by a renowned market analyst and documented in numerous books. Among them is the author Jason Perl.
It is recommended to have read the trading techniques mentioned in the books covering this indicator beforehand.
How to use:
MATHR3E WAVES indicator can provide a roadmap of market direction that you can use to determine price targets and isolate exhaustion points from potential trends in conjunction with other indicators by the same author.
Be aware the indicator's approach is derived from the Elliott wave theory and may slightly diverge from the cardinal rules of Elliott waves.
Principle of the Elliott Wave Theory
Movement in the direction of the trend is unfolding in 5 waves (called motive wave) while any correction against the trend is in three waves (called corrective wave). The movement in the direction of the trend is labeled as 1, 2, 3, 4, and 5. The three-wave correction is labeled as a, b, and c. These patterns can be seen in the long term as well as short term charts.
Wave 1:
Wave one is rarely obvious at its inception. When the first wave of a new bull market begins, the fundamental news is almost universally negative. The previous trend is considered still strongly in force. Fundamental analysts continue to revise their earnings estimates lower; the economy probably does not look strong. Sentiment surveys are decidedly bearish, put options are in vogue, and implied volatility in the options market is high. Volume might increase a bit as prices rise, but not by enough to alert many technical analysts.
Wave 2:
Wave two corrects wave one, but can never extend beyond the starting point of wave one. Typically, the news is still bad. As prices retest the prior low, bearish sentiment quickly builds, and "the crowd" haughtily reminds all that the bear market is still deeply ensconced. Still, some positive signs appear for those who are looking: volume should be lower during wave two than during wave one, prices usually do not retrace more than 61.8% of the wave one gains, and prices should fall in a three-wave pattern.
Wave 3:
Wave three is usually the largest and most powerful wave in a trend. The news is now positive and fundamental analysts start to raise earnings estimates. Prices rise quickly, corrections are short-lived and shallow. Anyone looking to "get in on a pullback" will likely miss the boat. As wave three starts, the news is probably still bearish, and most market players remain negative; but by wave three's midpoint, "the crowd" will often join the new bullish trend. Wave three often extends wave one by a ratio of 1.618:1.
Wave 4:
Wave four is typically clearly corrective. Prices may meander sideways for an extended period, and wave four typically retraces less than 38.2% of wave three. Volume is well below that of wave three. This is a good place to buy a pullback if you understand the potential ahead for wave 5. Still, fourth waves are often frustrating because of their lack of progress in the larger trend.
Wave 5:
Wave five is the final leg in the direction of the dominant trend. The news is almost universally positive and everyone is bullish. Unfortunately, this is when many average investors finally buy-in, right before the top. Volume is often lower in wave five than in wave three, and many momentum indicators start to show divergences (prices reach a new high but the indicators do not reach a new peak).
Wave A:
Corrections are typically harder to identify than impulse moves. In wave A of a bear market, the fundamental news is usually still positive. Most analysts see the drop as a correction in a still-active bull market. Some technical indicators that accompany wave A include increased volume, rising implied volatility in the options markets, and possibly a turn higher in open interest in related futures markets.
Wave B:
Prices reverse higher, which many see as a resumption of the now long-gone bull market. Those familiar with classical technical analysis may see the peak as the right shoulder of a head and shoulders reversal pattern. The volume during wave B should be lower than in wave A. By this point, fundamentals are probably no longer improving, but they most likely have not yet turned negative.
Wave C:
Prices move impulsively lower in five waves. Volume picks up, and by the third leg of wave C, almost everyone realizes that a bear market is firmly entrenched. Wave C is typically at least as large as wave A and often extends to 1.618 times wave A or beyond.
█ FEATURES & BENEFITS
Versatile
The indicator works on relative price action, so you can apply it without having to change any of the default settings.
Targets:
Customize the high and low wave targets to identify possible price target areas.
Adjustable Rules:
• Shift Wave 2: if Wave 4 closes below the low close of Wave 2.
• Shift Wave 4: if Wave A closes below the low close of Wave 4.
• Allow Wave 4 to overlap Wave 1
• Allow truncated Wave 5
• Allow truncated Wave C
Price ratio:
Force waves 2/4 to retrace to a specific Fibonacci level.
Force Waves 3/5 size to a specific Fibonacci level.
Time Ratio:
Force selected waves to last a required number of bars.
Alerts:
Set up your alerts and receive notifications on wave completion.
Alerts format can be adapted to be received on Discord servers.
3 Zigzag for MTF Fib Alert [MsF]Japanese below / 日本語説明は英文の後にあります。
-------------------------
This indicator that automatically displays Fibonacci from each High & Low based on 3 Zigzags. It's useful for multi-timeframe analysis.
For example, Fibonacci calculated from the high and low prices (Zigzag 3 Period=100) of the upper timeframe can be displayed on the lower timeframe.
Also, you can set alerts for each Fibonacci point. It is useful when you are waiting for the price to return to the discount (50% or less) or the premium (50% or more) of the upper timeframe.
"Fib 1 - Crossing 0.00" … Trigger an alert when crossing the 0% line in Fibonacci of Zigzag1
"Fib 1 - Crossing 100.0" … Trigger an alert when crossing the 100% line in Fibonacci of Zigzag1
"Fib 1 - Crossing 23.6" … Trigger an alert when crossing the 23.6% line in Fibonacci of Zigzag1
"Fib 1 - Crossing 38.2" … Trigger an alert when crossing the 38.2% line in Fibonacci of Zigzag1
"Fib 1 - Crossing 50.0" … Trigger an alert when crossing the 50.0% line in Fibonacci of Zigzag1
"Fib 1 - Crossing 61.8" … Trigger an alert when crossing the 61.8% line in Fibonacci of Zigzag1
"Fib 1 - Crossing 76.4" … Trigger an alert when crossing the 76.4% line in Fibonacci of Zigzag1
*Same as Zigzag 1 and Zigzag 2 too.
"Choose Zig Zag Leg for fib" parameter means...
Latest : Calculate Fibonacci based on "the most recent Zigzag line".
Previous : Calculate Fibonacci based on "the previous Zigzag line".
-------------------------
3つのZigzagを元に各High&Lowからフィボナッチを自動で表示するインジケーターです。
Zigzagの期間を工夫することで、マルチタイムフレーム分析に役立ちます。
例えば、以下の設定とした場合:
Zigzag 1 Period … 8
Zigzag 2 Period … 25
Zigzag 3 Period … 100
上位時間足Zigzag(Period=100)の高値安値から形成されるフィボナッチを下位時間足に表示することができるのです。
また、このインジケーターではフィボナッチのポイント毎にアラートの設定が可能です。
上位時間足の割安価格(50%以下)や割高価格(50%以上)に価格が戻ってくるのを待っている時などに力を発揮してくれます。
"Fib 1 - Crossing 0.00" … Zigzag1のフィボナッチにおいて、0%ラインとクロスした場合にアラートを発報します
"Fib 1 - Crossing 100.0" … Zigzag1のフィボナッチにおいて、100%ラインとクロスした場合にアラートを発報します
"Fib 1 - Crossing 23.6" … Zigzag1のフィボナッチにおいて、23.6%ラインとクロスした場合にアラートを発報します
"Fib 1 - Crossing 38.2" … Zigzag1のフィボナッチにおいて、38.2%ラインとクロスした場合にアラートを発報します
"Fib 1 - Crossing 50.0" … Zigzag1のフィボナッチにおいて、50.0%ラインとクロスした場合にアラートを発報します
"Fib 1 - Crossing 61.8" … Zigzag1のフィボナッチにおいて、61.8%ラインとクロスした場合にアラートを発報します
"Fib 1 - Crossing 76.4" … Zigzag1のフィボナッチにおいて、76.4%ラインとクロスした場合にアラートを発報します
※Zigzag1およびZigzag2のフィボナッチも同様
"Choose Zig Zag Leg for fib"パラメータについて:
Latest … 一番新しいZigzagのライン(UpまたはDown)を元にフィボナッチを計算します。
Previous … ひとつ前のZigzagのライン(UpまたはDown)を元にフィボナッチを計算します。

The Zig Zag Leveler IndicatorThis indicator is designed to identify potential trade setups in the market using the ZigZag indicator. It uses a combination of the ZigZag indicator and the background fill color to help identify areas of support and resistance. It also uses a pip offset to help with entries and exits. Additionally, it can generate alert conditions when the market direction changes and when a buy or sell signal is generated. This indicator can be used to help identify potential trade setups and can be customized to fit the user's trading strategy.
This indicator takes the guesswork out of trading by providing traders with an array of signals that can help identify entry and exit points. The indicator uses two sets of signals to identify price levels that indicate potential entry and exit points - one set of signals that indicate potential entry points and another set of signals that indicate potential exit points. The indicator also provides traders with a visual representation of the signals that can help them better understand the signals and make informed trading decisions. With this indicator, traders can have a better understanding of the market and have a better chance of making profitable trades.

The Zig Zag Leveler Strategy 1This indicator is designed to identify potential trade setups in the market using the ZigZag indicator. It uses a combination of the ZigZag indicator and the background fill color to help identify areas of support and resistance. It also uses a pip offset to help with entries and exits. Additionally, it can generate alert conditions when the market direction changes and when a buy or sell signal is generated. This indicator can be used to help identify potential trade setups and can be customized to fit the user's trading strategy.
This indicator takes the guesswork out of trading by providing traders with an array of signals that can help identify entry and exit points. The indicator uses two sets of signals to identify price levels that indicate potential entry and exit points - one set of signals that indicate potential entry points and another set of signals that indicate potential exit points. The indicator also provides traders with a visual representation of the signals that can help them better understand the signals and make informed trading decisions. With this indicator, traders can have a better understanding of the market and have a better chance of making profitable trades.

Multi-Timeframe MA Based Zigzag[liwei666]🎲 Overview
🎯 This Zigzag indicator build based on different MA such as EMA/HMA/RMA/SMA, support multi-timeframe setting .
you can get customer zigzag indicator by change short/long ma length and high-timeframe config(5m/15m/30m/1h/2h) in any symbol.
🎲 Indicator design logic
🎯 entired logic is simple and code looks complex, I‘ll explain core logic here, code already equipped with detailed comments.
1. use close-in EMA's highest/lowest value mark as SWING High/Low when EMA crossover/under, not use func ta.pivothigh()/ta.pivotlow()
2. when EMA crossover/under plot a char as signal like ●/❄/▲, crossover get blue char crossunder get red char
3. latest zigzag line is not drawn until EMA is turned (crossover/under), but signal is realtime
4. you can see diff zigzag structure when you open high-timeframe config, then find regular pattern benefit your trading.
🎲 Settings
🎯 there are 3 group properties in script, just focus on 5 properties in 'GRP1' ,
'GRP2' and 'GRP3' are display config.
'GRP1':
MA_Type: MA type you can choose(EMA/RMA/SMA/HMA/WMA), default is EMA
short_ma_len: short MA length of your current timeframe on chart
long_ma_len: long MA length of your current timeframe on chart
htf_ma_len: MA length of high timeframe, MA type same as 'MA_Type' config
htf_ma_tf: high timeframe ma length, 15/30/60/120 minute
'GRP2':
• show_short_zz • show_long_zz • show_htf_zz:
'GRP3':
• show_short_ma_line • show_short_ma_signal
• show_long_ma_line • show_long_ma_signal
• show_htf_ma_line • show_htf_ma_signal
🎲 Usage
🎯 As we know, MA based signal usually worked fine in trend market , low volatility is unprofitable.
🎯 One of pattern as the chart show below.
1. success example : after a blue ▲ signal, entry long when blue ● signal appear, marked with green box.
2. failed example: after a blue ▲ signal, a red ▼ signal appear, marked with white box.
🎯 BoS(Break of Structure) based on ma zigzag is a good idea I'm implementing, it will be published in next script.
Additionally, I plan to publish 20 profitable strategies in 2023; this indicatior not one of them,
let‘s witness it together!
Hope this indicator will be useful for you :)
enjoy! 🚀🚀🚀

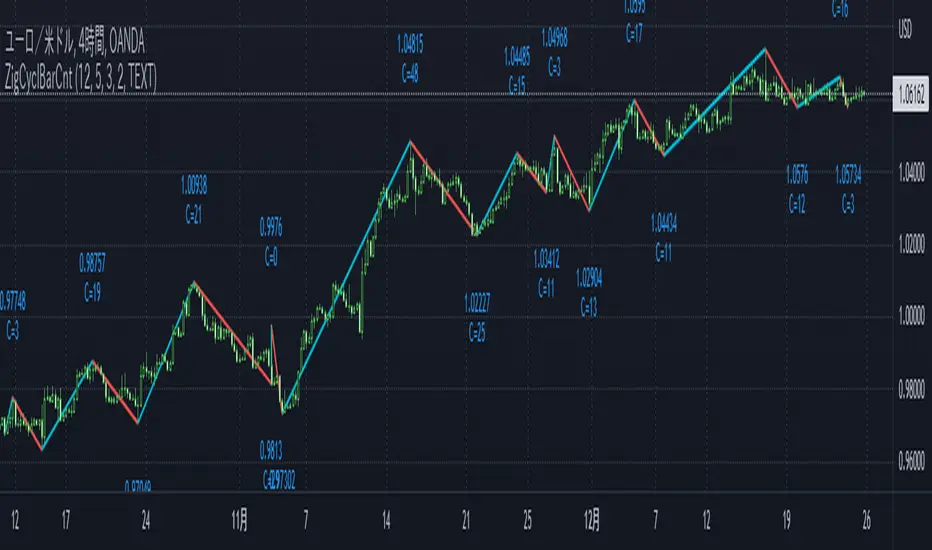
ZigCycleBarCount [MsF]Japanese below / 日本語説明は英文の後にあります。
Based on "ZigZag++" indicator by DevLucem. Thanks for the great indicator.
-------------------------
This indicator that displays the candle count (bar count) at the peaks of Zigzag .
It also displays the price of the peaks.
You can easily count candles (bars) from peak to peak. Helpful for candles (bars) in cycle theory.
This logic of the indicator is based from the mt4 zigzag indicator .
Parameter:
Depth = depth (price range)
Backstep = Period
Deviation = Percentage of how much the price has wrapped around the previous line.
Example:
Depth = 12
Backstep = 3
Deviation = 5
In this case, the price range is updated by 12 pips or more (Depth), and after 3 or more candlesticks line up (Backstep), if the price deviates from the previous line by 5% or more (Deviation), a peak is added.
-------------------------
Zigzagの頂点にローソクカウント(バーカウント)を表示するインジケータです。
頂点の価格も表示します。
頂点から頂点までのローソク(バー)を容易にカウントすることができます。
サイクル理論のローソク(バー)に役立ちます。
Zigzagロジック自体はMT4のzigzagインジケータを流用しています。
<パラメータ>
Depth=深さ(値幅)
Backstep=期間
Deviation=価格がどれだけ直前のラインの折り返したかの割合
例:
Depth=12
Backstep=3
Deviation=5
この場合、値幅を12pips以上更新し(Depth)、ローソク足が3本以上並んだ後(Backstep)、価格が直前のラインの5%以上折り返せば(Deviation)、頂点を付けます。
<表示オプション>
Label_Style = "TEXT"…テキスト表示、"BALLOON"…吹き出し表示
Channel Based Zigzag [HeWhoMustNotBeNamed]🎲 Concept
Zigzag is built based on the price and number of offset bars. But, in this experiment, we build zigzag based on different bands such as Bollinger Band, Keltner Channel and Donchian Channel. The process is simple:
🎯 Derive bands based on input parameters
🎯 High of a bar is considered as pivot high only if the high price is above or equal to upper band.
🎯 Similarly low of a bar is considered as pivot low only if low price is below or equal to lower band.
🎯 Adding the pivot high/low follows same logic as that of regular zigzag where pivot high is always followed by pivot low and vice versa.
🎯 If the new pivot added is of same direction as that of last pivot, then both pivots are compared with each other and only the extreme one is kept. (Highest in case of pivot high and lowest in case of pivot low)
🎯 If a bar has both pivot high and pivot low - pivot with same direction as previous pivot is added to the list first before adding the pivot with opposite direction.
🎲 Use Cases
Can be used for pattern recognition algorithms instead of standard zigzag. This will help derive patterns which are relative to bands and channels.
Example: John Bollinger explains how to manually scan double tap using Bollinger Bands in this video: www.youtube.com This modified zigzag base can be used to achieve the same using algorithmic means.
🎲 Settings
Few simple configurations which will let you select the band properties. Notice that there is no zigzag length here. All the calculations depend on the bands.
With bands display, indicator looks something like this
Note that pivots do not always represent highest/lowest prices. They represent highest/lowest price relative to bands.
As mentioned many times, application of zigzag is not for buying at lower price and selling at higher price. It is mainly used for pattern recognition either manually or via algorithms. Lets build new Harmonic, Chart patterns, Trend Lines using the new zigzag?

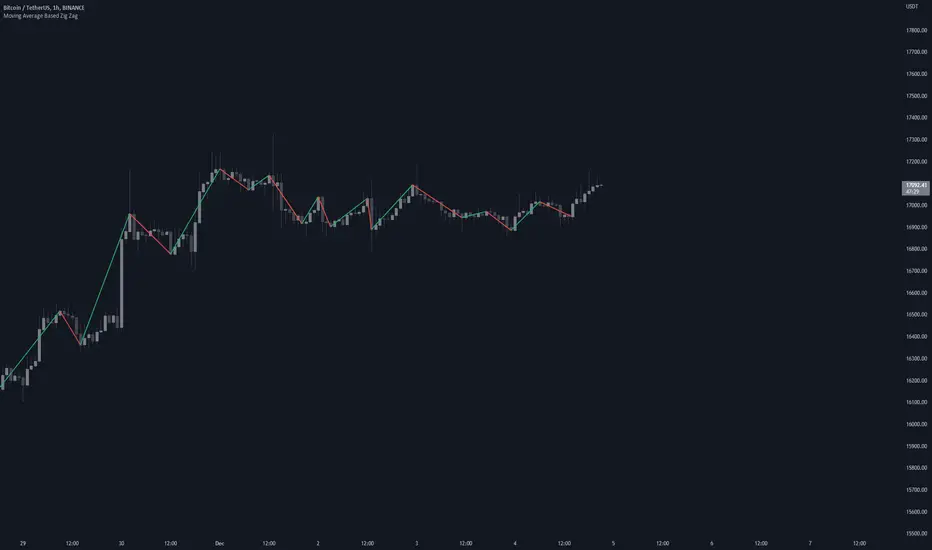
Moving Average Based Zig ZagMoving Average Based Zig Zag differs from the traditional Zig Zag indicator in that pivot points are determined by a moving average, Volume Weighted Hull Moving Average, rather than looking for the highest or lowest point in a left / right period.
Settings
Source: the source for the pivot points.
Moving Average Length: the length of the Volume Weighted Hull Moving Average, increase for longer zig zags, decrease for shorter zig zags.
Usage
Like all Zig Zag indicators, the Moving Average Based Zig Zag is not intended to be used as a live trading tool. This indicator is intended to be an alternative way of determining pivot points on your chart. Pivot points can be used for a multitude of different analytical techniques. One may use pivot points in order to draw potential support and resistance lines, trend lines or chart patterns. Additionally, pivot points can be used to determine variations of highs and lows important to market structure analysis such as break of structure or change of character.
Details
The moving average used is a Volume Weighted Hull Moving Average, this particular moving average was used due to it's relatively low-lag characteristics when compared to an Exponential Moving Average, additionally by considering volume in the moving average calculation, insignificant pivot points can be further filtered.
Rather than using built-in functions `ta.pivothigh()` and `ta.pivotlow()` to determine pivot points, this indicator waits for the moving average to pivot then searches for the highest or lowest value from the bar index of the moving average pivot to the bar index of the previous found price pivot. This method of determining pivots provides a more dynamic approach to determining pivot points.
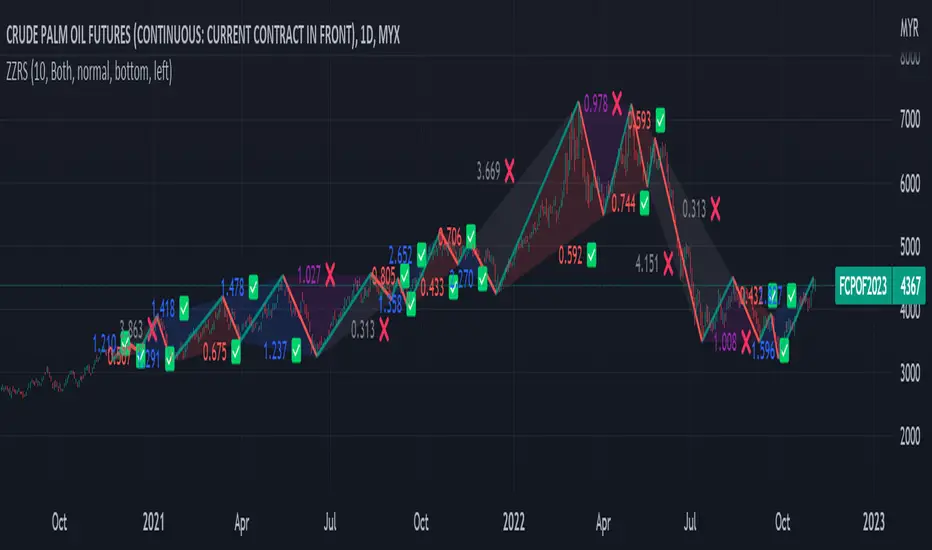
Zig Zag Ratio Simplified█ OVERVIEW
This indicator was to show ratio between zig zag. Ideally to find Fibonacci Retracement / Projection, Harmonic Patterns, ABCD, Elliot Wave and etc.
█ CREDITS
LonesomeTheBlue
█ FEATURES
Table can positioned by any position and font size can be resized.
█ USAGE / TIPS EXAMPLES (Description explained in each image)
Davin's 10/200MA Pullback on SPY Strategy v2.0Strategy:
Using 10 and 200 Simple moving averages, we capitalize on price pullbacks on a general uptrend to scalp 1 - 5% rebounds. 200 MA is used as a general indicator for bullish sentiment, 10 MA is used to identify pullbacks in the short term for buy entries.
An optional bonus: market crash of 20% from 52 days high is regarded as a buy the dip signal.
An optional bonus: can choose to exit on MA crossovers using 200 MA as reference MA (etc. Hard stop on 50 cross 200)
Recommended Ticker: SPY 1D (I have so far tested on SPY and other big indexes only, other stocks appear to be too volatile to use the same short period SMA parameters effectively) + AAPL 4H
How it works:
Buy condition is when:
- Price closes above 200 SMA
- Price closes below 10 SMA
- Price dumps at least 20% (additional bonus contrarian buy the dip option)
Entry is on the next opening market day the day after the buy condition candle was fulfilled.
Sell Condition is when:
- Prices closes below 10 SMA
- Hard stop at 15% drawdown from entry price (adjustable parameter)
- Hard stop at medium term and long term MA crossovers (adjustable parameters)
So far this strategy has been pretty effective for me, feel free to try it out and let me know in the comments how you found :)
Feel free to suggest new strategy ideas for discussion and indicator building

Trend/Retracement - ZigZag - New wayZigZag for Trend and Retracements - New way
It's another way to plot ZigZag based on lookback period for trend and % of trend lookback period to plot retracements.
█ OVERVIEW
Plot ZigZag, Trend lines, Retracements, Support levels, Resistance levels
█ Objective:
Draw ZigZag lines along with unbroken support and resistance levels. ZigZag lines are drawn for main trend and the retracements.
Main Trend – This is calculated based on lookback period.
Retracements – Retracements are calculated as 25% of main trend.
Support and Resistance line: The indicator draws 2 types of support and resistance lines
1. Un-broken – Once formed (plotted), these are the support and resistance which are not yet broken
2. Tested – One can also choose to see support and resistance lines which are tested but not broken. Tested support/resistance are those levels which are touched by high/low price but close price has not crossed the level.
█ How main trend point is calculated:
E.g.
Chart timeframe = 15m
Lookback period = 250
Retracement = 25% of main trend ( 25% of 250 = 62 )
A price point on a chart is considered as trend point if distance between current price and previous highest price is 250 candles
A price point is considered as a retracement if distance between current price and previous highest price is 62 candles. Please note retracements are calculated only after finding a main trend point.
█ Input parameters:
Zigzag Parameters
Use predefined Lookback – If checked pre-defined timeframe-based lookback parameters are used.
Trend lookback candles – If ‘Use predefined Lookback’ is unchecked then this value is used as lookback period.
Retracement % of look back candles– If ‘Use predefined Lookback’ is unchecked then this value is used for calculating retracement lookback period
Mark retracements – If unchecked only main trend lines are plotted
Plot support/resistance – To plot support/resistance levels
Show support/resistance tested lines – If checked tested support/resistance liens are shown on the chart
█ TF based Lookback period config (Defaults are set as specified below, One can change these defaults to use different lookback periods)
The defaults set here are used based on the chart timeframe. e.g. if chart timeframe is changed from say 15m to 60m then 60m chart defaults (i.e. trend lookback = 90) are used to plot the trend and the retracements. At the bottom-right of the chart, parameters used for plotting are displayed all the time.
Timeframe in minute – Default = 5m
Trend lookback candles – Default = 375 (~ 5 days of data)
Timeframe in minute – Default = 15m
Trend lookback candles – Default = 250 (~10 days of data)
Timeframe in minute – Default = 60m
Trend lookback candles = Default = 90 (~ 15 days of data)
Trend lookback candles for timeframe 'D' – Default = 30 (~1 month data)
Trend lookback candles for timeframe 'W' – Default = 21 (~6 months data)
Trend lookback candles for timeframe 'M' – Default = 12 (~1year data)
Retracement % of look back candles – Default = 25%
█ When and where one can use this indicator (Refer to chart examples)
To view support and resistance based on lookback period
To view ZigZag lines
One can use it to find chart patterns easily
Trend and retracement lines can help in drawing Elliott waves.
█ Chart examples:
1. Chart patterns can be easily identified - One can disable the candle charts which will help to identify and draw chart patterns easily
2. Trend and retracement lines can also help is analyzing charts (e.g. Elliott Waves can be marked based on trend lines)
3. Tested but not broken support and resistance lines can be viewed
4. You can select 'NOT' to plot tested support and resistance lines
5. Uncheck the Mark retracements to plot main trend lines (Retracements are not marked)

RSI + MA, LinReg, ZZ (HH HL LH LL), Div, Ichi, MACD and TSI HistRelative Strength Index with Moving Average, Linear Regression, Zig Zag (Highs and Lows), Divergence, Ichimoku Cloud, Moving Average Convergence Divergence and True Strength Index Histogram
This script is based on zdmre's RSI script, I revamped a lot of things and added a few indicators from ParkF's RSI script.
Disable Labels in the Style tab and the histogram if you don't enlarge the indicator and it seems too small.
Look to buy in the oversold area and bounce of the support of the linear regression.
Look to sell in the overbought area and bounce of the resistance of the linear regression.
Look for retracement to the moving average or horizontal lines, and divergences for potential reversal.
RSI
The Relative Strength Index (RSI) is a well versed momentum based oscillator which is used to measure the speed (velocity) as well as the change (magnitude) of directional price movements.
Moving Average
Moving Average (MA) is a good way to gauge momentum as well as to confirm trends, and define areas of support and resistance.
Linear Regression
The Linear Regression indicator visualizes the general price trend of a specific part of the chart based on the Linear Regression calculation.
Zig Zag (Highs and Lows)
The Zig Zag indicator is used to identify price trends, and in doing so plots points on the chart to mark whenever prices reverse by a larger percentage point than a predetermined variable or marker.
Divergence
The divergence indicator warns traders and technical analysts of changes in a price trend, oftentimes that it is weakening or changing direction.
Ichimoku Cloud
The Ichimoku Cloud is a package of multiple technical indicators that signal support, resistance, market trend, and market momentum.
MACD and TSI Histogram
MACD can be used to identify aspects of a security's overall trend.
The True Strength Index indicator is a momentum oscillator designed to detect, confirm or visualize the strength of a trend.

RSI TrendRSI Hull Trend is a hybrid indicator with RSI of HULL Signal. The Hull MA is combined with RSI to see if the Hull MA Buy/Sell Signal is in overbought or oversold condition. Buy Sell Signals are plotted based on settings of OB/OS or RSI. This indicator is very useful to see if the Trend is in Exhaustion or Beginning of a Trend. Entry and Exit conditions can be more precise based on OB/OS condition of price action. In addition normal RSI trend is plotted with trend color from Hull MA. Best Performance with Heiken Ashi Candles.
OB/OS Settings provided
Hull Buy/Sell Signals plotted
Double RSI FAST and DEFAULT signal with crossover
Bar Color applied based on Hull RSI Trend
Hull Trend + RSI + Price Action

PharshK RSI and Zigzag with H/LIt is with RSI level
and Zigzag Pattern that Market goes on Maximum level and Lower Level
And it is also Showing High and Law Level of last Moving Candle so it is easy to entry and Hold

PharshK RSI and Zigzag with H/LIt is with RSI level
and Zigzag Pattern that Market goes on Maximum level and Lower Level
And it is also Showing High and Law Level of last Moving Candle so it is easy to entry and Hold

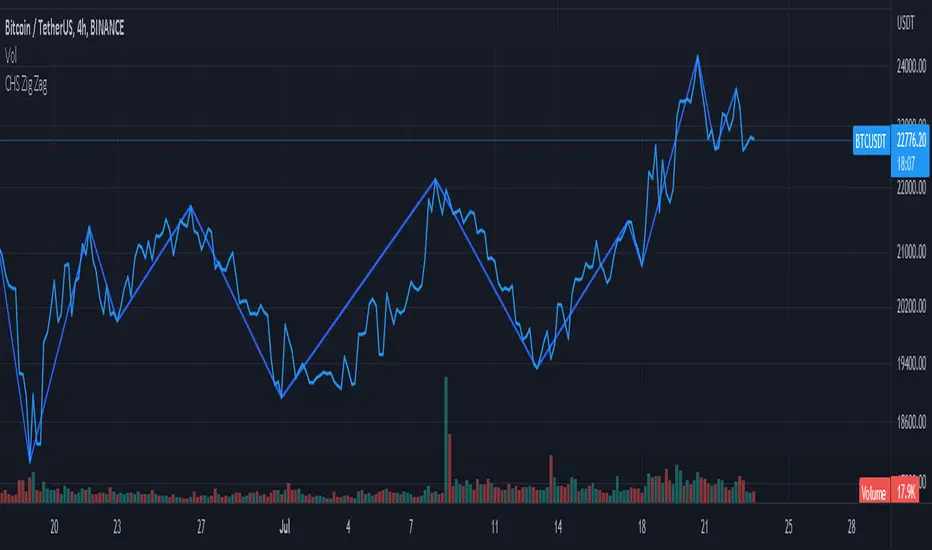
CHS Zig ZagCHS ZigZag stands for Changeable Source ZigZag
The original ZigZag indicator offered by TradingView doesn't have the ability to measure the tips and troughs based on closing prices (line chart), however, this indicator is capable of receiving an input from user that determines the price source used for further calculations.
The default inputs of the original ZigZag indicator have been also changed in order to make it adapt to pivots formed on line chart but users can change arbitrarily.
Structured zigzag support&resistance [LM]Hello Traders,
I would like to introduce you Structured zigzag support&resistance. It is based on the ZigZag semafor script made by DevLucem so shout out to him
The indicator is used to spot future multi-level Supports and Resistance zones. It is also useful to spot HL or LL or HH or LH zones
I's the same zigzag indicator as my other zigzag indicator with highlight on diagonal lines(highs and lows are automatically classified and also new types of diagonal lines that connects low or highs and extends to right are drawn )
It has two settings:
Fist is to control horizontal lines and zigzag setting
Second is to control diagonal lines
I hope you will enjoy it as I enjoyed to write it.
Lukas
