Session Liquidity Sweep + Trend ConfirmationThis strategy aims to capture high-probability intraday trades by combining liquidity sweeps with a trend confirmation filter. It is designed for traders who want a systematic approach to trade breakouts during specific market sessions while controlling risk with ATR-based stops.
How it Works:
Session Filter: Trades are only considered during a defined session (default 9:30 - 11:00). This helps avoid low-volume periods that can lead to false signals.
Trend Confirmation: The strategy uses a 50-period EMA to identify the market trend. Long trades are only taken in an uptrend, and short trades in a downtrend.
Liquidity Sweep Detection:
A long entry occurs when price dips below the prior N-bar low but closes back above it, indicating a potential liquidity sweep that stops being triggered before the trend continues upward.
A short entry occurs when price spikes above the prior N-bar high but closes below it, signaling a potential sweep of stops before the downward trend resumes.
ATR-Based Risk Management:
Stop loss is calculated using the Average True Range (ATR) multiplied by a configurable factor (default 1.5).
Take profit is set based on a risk-reward ratio (default 2.5x).
Position Sizing: Default position size is 5% of equity per trade, making it suitable for risk-conscious trading.
Inputs:
Session Start/End (HHMM)
Liquidity Lookback Period (number of bars to define prior high/low)
ATR Length for stop calculation
ATR Stop Multiplier
Risk-Reward Ratio
EMA Trend Filter Length
Visuals:
Prior Liquidity High (red)
Prior Liquidity Low (green)
EMA Trend (blue)
Why Use This Strategy:
Captures stop-hunt moves often triggered by larger market participants.
Only trades with trend confirmation, reducing false signals.
Provides automatic ATR-based stop loss and take profit for consistent risk management.
Easy to adjust session time, ATR, EMA length, and risk-reward to suit your trading style.
Important Notes:
Assumes 0.05% commission and 1-pip slippage. Adjust according to your broker.
Not financial advice; intended for educational, backtesting, or paper trading purposes.
Always test strategies thoroughly before applying to live accounts.
Ema-trend

9/21 EMA Trend TOP rIGHT CORNER INDICATORCrossover indicator for the 9 & 21 EMA. Buy Sell for cross up or down respectively. Daily, weekly and Monthly trend.

High-Probability IndicatorExplanation of the Code
Trend Filter (EMA):
A 50-period Exponential Moving Average (EMA) is used to determine the overall trend.
trendUp is true when the price is above the EMA.
trendDown is true when the price is below the EMA.
Momentum Filter (RSI):
A 14-period RSI is used to identify overbought and oversold conditions.
oversold is true when RSI ≤ 30.
overbought is true when RSI ≥ 70.
Volatility Filter (ATR):
A 14-period Average True Range (ATR) is used to measure volatility.
ATR is multiplied by a user-defined multiplier (default: 2.0) to set a volatility threshold.
Ensures trades are only taken during periods of sufficient volatility.
Entry Conditions:
Long Entry: Price is above the EMA (uptrend), RSI is oversold, and the candle range exceeds the ATR threshold.
Short Entry: Price is below the EMA (downtrend), RSI is overbought, and the candle range exceeds the ATR threshold.
Exit Conditions:
Take Profit: A fixed percentage above/below the entry price.
Stop Loss: A fixed percentage below/above the entry price.
Visualization:
The EMA is plotted on the chart.
Background colors highlight uptrends and downtrends.
Buy and sell signals are displayed as labels on the chart.
Alerts:
Alerts are triggered for buy and sell signals.
How to Use the Indicator
Trend Filter:
Only take trades in the direction of the trend (e.g., long in an uptrend, short in a downtrend).
Momentum Filter:
Look for oversold conditions in an uptrend for long entries.
Look for overbought conditions in a downtrend for short entries.
Volatility Filter:
Ensure the candle range exceeds the ATR threshold to avoid low-volatility trades.
Risk Management:
Use the built-in take profit and stop loss levels to manage risk.
Optimization Tips
Backtesting:
Test the indicator on multiple timeframes and assets to evaluate its performance.
Adjust the input parameters (e.g., EMA length, RSI length, ATR multiplier) to optimize for specific markets.
Combination with Other Strategies:
Add additional filters, such as volume analysis or support/resistance levels, to improve accuracy.
Risk Management:
Use proper position sizing and risk-reward ratios to maximize profitability.
Disclaimer
No indicator can guarantee an 85% win ratio due to the inherent unpredictability of financial markets. This script is provided for educational purposes only. Always conduct thorough backtesting and paper trading before using any strategy in live trading.
Let me know if you need further assistance or enhancements!

Munich's Momentum Wave V2MUNICH'S MOMENTUM WAVE VERSION 2 IS LIVE!!!
There are a few big things to note with this one.
I decided to upload this as an entirely new script due to the number of changes differing from the first version, but as the last one, this will still work on ANY TIMEFRAME, ANY ASSET CLASS, ANY PRICE! .
This momentum wave indicator now will give you data for when trend could turn, and two momentum indicators to help you decide when to take an entry.
First off,
*I have added an alma ma (alma) that will track momentum alongside price action and further lead the indicator consisting of the Munich waves.
* The background feature will track the price using a method derived from the Bollinger bands, after calculations, it will color the background based on the average of the momentum's ema's, the alma ma, and also the alma in comparison to the alma's value pre offset ( the offset is 3, following the basis).
*There are now 5 basis values given from the increase in ema samples.
If anyone has any questions feel free to pm me or comment below. Thank you guys for the support! :)
INDEX:BTCUSD TVC:NDQ AMEX:SPY BITSTAMP:ETHUSD BINANCE:BTCUSDT FX:USDJPY NASDAQ:AAPL

Refracted EMARefracted EMA is a price based indicator with bands that is built on moving average.
The price range between the bands directly depends on relationship of Average True Range to Moving Average. This gives us very valuable variable constant that changes with the market moves.
So the bands expand and contract due to changes in volatility of the market, which makes this tool very flexible exposing psychological levels.

Directional BiasA Directional Bias to stop me trading against the trend
Utilising EMA'S - I personally view on the 15M TF but it can be set on any
40/50/60 15Minute STF
and 13/35/50 - 30M 1H and 4H HTF
Mixing them together in direction and location to each other Gives a 6 colour system for keeping away from trading against trend
Dark Red Both Align - Sells Only do not take Buy Trades
Medium Red HTF and Dark Red Mix - Sells Only do not take Buy Trades
Light Red STF - if in a mix with Blanks and greens - Trade Both Directions - if 8 hours of solid Light Red ? Darker Red - do not take Buy Trades - Sells Only
Orange - Trading Both ways - No Directional Bias
Dark Green Both Align - Buys Only do not take Sell Trades
Medium Green HTF and Dark Green Mix - Buys Only do not take Sell Trades
Light Red STF - if in a mix with Blanks and greens - Trade Both Directions - if 8 hours of solid Light Green ? Darker Green - do not take Sell Trades - Buys Only
Alert Setting for Change of Direction included
I find this useful - to at least give me a pause for thought when I am about to trade against the trend - I hope you do to

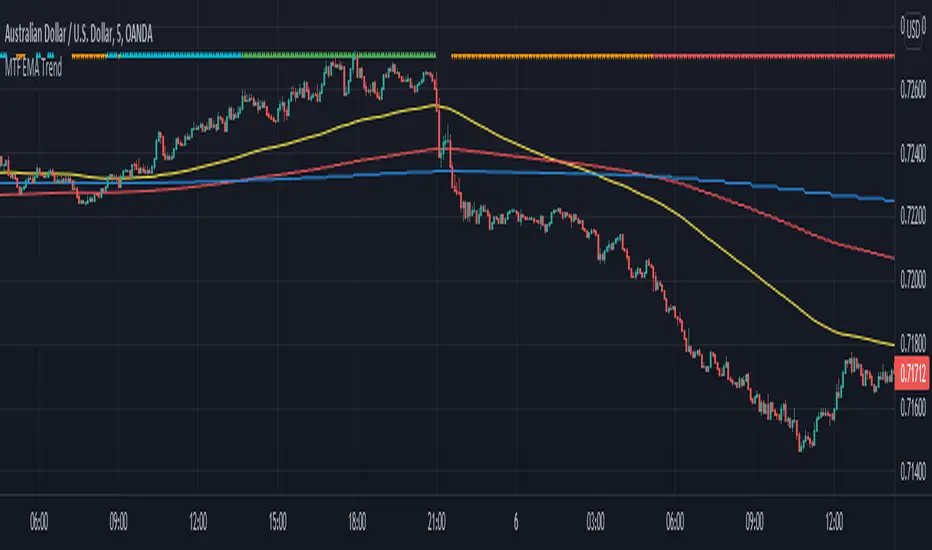
MTF EMA TrendThe indicator plots directional arrows on top of the chart to visualize the market's price trend. The plots are based on candle closing below all three multitimeframe EMAs, downtrend, when the EMAs are also in order (1 below 2 and 2 below 3). Opposite situation is uptrend.
It also marks a breakdown when the price closes under the third (supposedly always the slowest) EMA outside of aforementioned downtrend situation. Opposite is true for breakup to be marked.
Please always make sure, that the three EMAs are in order of EMA 1 being the fastest and 3rd the slowest. Default settings are used on the 5 minute timeframe.
Indicator can be used to quickly check the overall trend of the market as told by three MTF EMAs without needing to clutter the chart with the actual EMA plots. This is useful, for example, if you mainly base your scalping trades on other types of indicators, but you want a quick peek of the market direction or indecision.
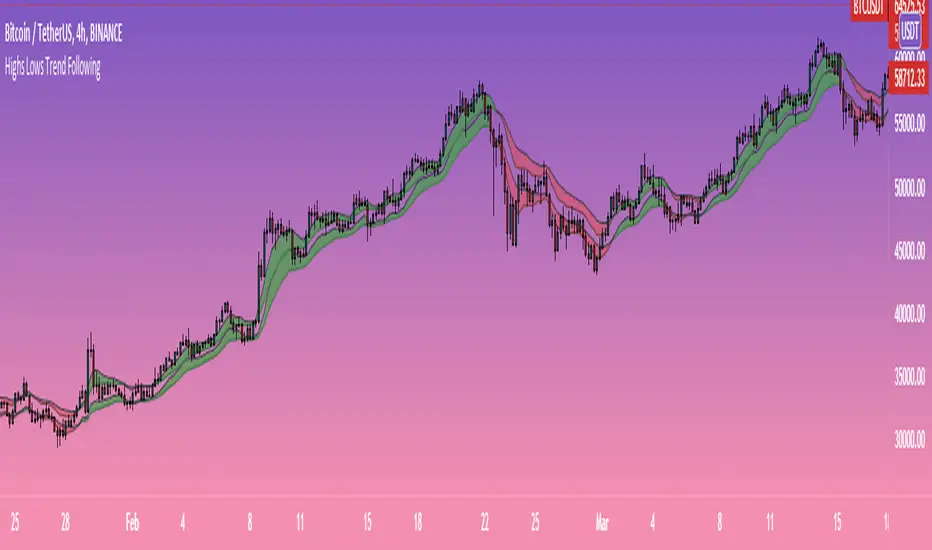
Highs-Lows Bands Trend FollowingTwo bands formed by moving averages of highs and lows.
The lower band should provide zone of support in uptrends while the upper band should provide zone of resistance during downtrends.
Bands that turn green in bullish trends should provide buy signals while bands that turn red in bearish trends should provide sell signals.
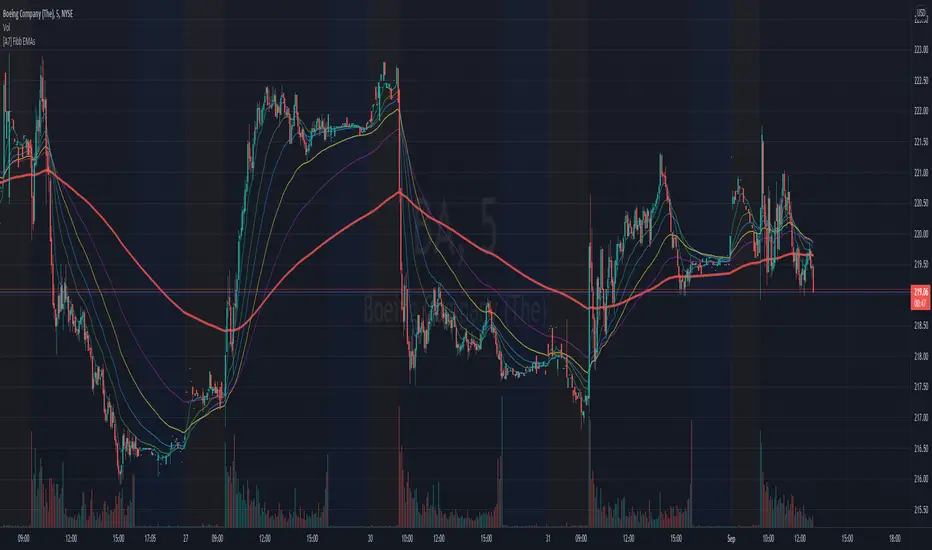
[A7] Fibonacci EMAs (8,21,34,55,89,233) Fibonacci EMAs (8,21,34,55,89,233)
Fibonacci Exponential Moving Averages
8 - aqua
21 - green
34 - blue
55 - yellow
89 - purple
233 - red
Baus BandsThe Baus Bands are a simplified version of another one of my trend following indicators, the Neapolitan Bands. This version only shows the trend trading zones in green and red. An additional 21 EMA with an ATR band was added as part of my own trend trading rules using these bands.
How do I read this indicator?
Is the blue band between and not touching the green or red clouds? The condition is ranging.
Is the blue band touching the green cloud? The condition is a bullish trend.
Is the blue band touching the red cloud? The condition is a bearish trend.
The trend trading rules are exactly the same as the default Neapolitans, but include an extra condition.
A trend has started once 2 conditions are met:
Price has entered either trending cloud.
The 21 EMA ATR band in blue is within the same cloud.
With those conditions met, if you expect the trend to continue, trade pull-backs to the blue band in the direction of the trending cloud.
Isn't this just a 21 EMA trading pull-backs strategy?
No. The 21 EMA alone is not sufficient in my opinion to define a range or trend technically. Always buying the 21 EMA pull-back, especially in a range, is not a great strategy by itself unless you've already identified price as trending. Baus Bands adds that trend identification.
Why make this?
Baus Bands show the conditions I personally use for catching trends and identifying ranges with these indicators, and shows only the information I use.
What's the purpose of the ATR band around the 21 EMA?
Sometimes price will open and close below the 21 EMA and cause some technical analysts will say the trend is over. I added the ATR specifically to get a volatility based, upper and lower bound range around the 21 EMA. that way I have an acceptable price range where price could move past the 21 EMA and still keep a trend valid using similar rules. I then saw that so long this ATR band (not the 21 EMA itself) was touching those trending clouds, then the trend has a good chance of continuing as long as that was true.

EMA CrossoversUseful for identifying and receiving alerts about uptrends and downtrends.
This script uses two Exponential Moving Averages (EMAs) to find price uptrends and downtrends. An Exponential Moving Average (EMA) is a type of moving average that places a greater weight and significance on the most recent data points. The script produces uptrend and downtrend signals based on crossovers and divergences between the two EMAs, the user will be able to spot a trend change (when the EMAs crossover) and to determine the strength of the current trend (when the EMAs diverge). It is also posible to get alerts for uptrends and downtrends on the web and mobile app with sound and pop-ups as well as via email. The optimal time to enter and exit the market can be concluded from this trend changes.
The user can set their own EMAs, by default they are set to 21 and 55 periods for medium and long term respectively. When the medium term EMA crosses below the long term EMA the asset is in a downtrend and the price will decline, and when the medium term EMA crosses above the long term EMA the asset is in an uptrend and price will increase.
This scripts plots the following indicators and signals on the chart to help the user to identify trends:
1.- Medium and long term EMAs as lines overlaid on the price chart.
2.- Up green triangles above bars when the price is on an uptrend and down red triangles below bars when the price is on a downtrend.
3.- Arrows with text to indicate the start of an uptrend or downtrend.
The user can enable and disable the indicators and signals as well as set colors and shapes to their liking.
This script also lets the user create alerts for uptrends and downtrends. To create a new alert using this script follow this instructions:
1.- Once you added this script to your chart, go to the alerts panel (right on web or bottom tool bar on the mobile app) and add a new alert (alarm clock icon with a plus sign).
2.- A modal window will open. On the “Condition” dropdown menu select “EMA Crossovers”.
3.- On the next dropdown menu (right below the “Condition” one) you can select from two types of alerts “Uptrend started” and “Downtrend started”.
4.- Lastly you can set all the normal alert options and create the alert.

Momentum Adjusted EMA TrendThe script draws a moving average which responds to trend changes extraordinary fast!
It's calculated using Momentum, Acceleration and Probability (Psychological Effect) by interfering the Golden Ratio!
I got the idea thanks to Tradingview user DGT (dgtrd) and his/her excellent descriptions.
The indicator is simplified for users and the default settings work great, so use it as you like specially as a trend indicator.

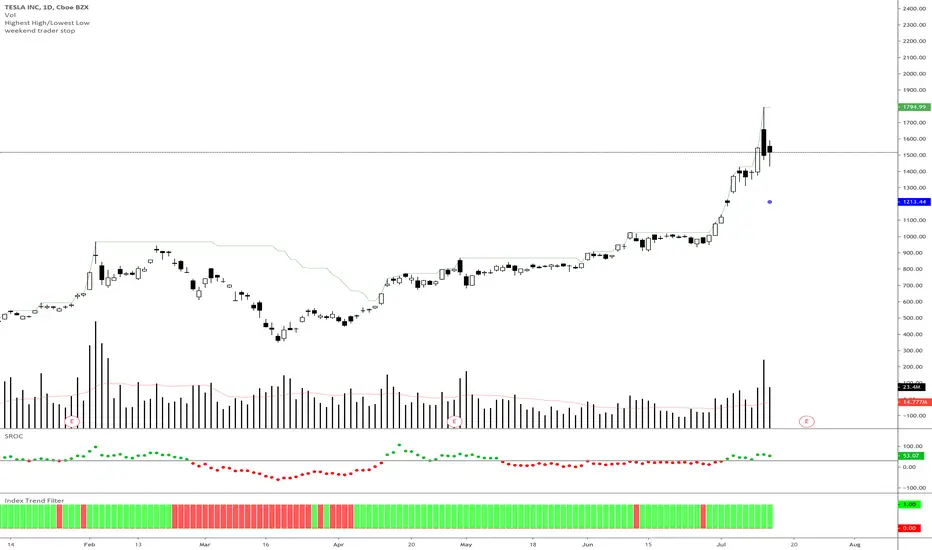
Index Trend Filter - Weekend Trend TraderThis little script simply gives you a quick visual cue of where price is compared to a particular EMA of another security or underlying index.
It is based on Nick Radge's broader market filter weekend trend trader system, but can be applied to other timeframes if you want to confirm if the index is in an up trend or down trend.
• Green means the underlying index price is above the EMA
• Red means the underlying index price is below the EMA
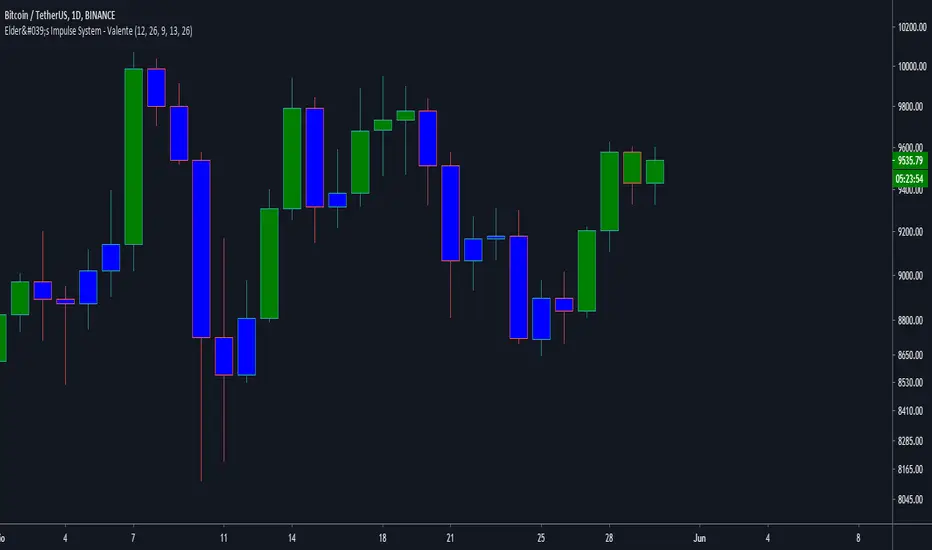
Elder's Impulse System with weekly EMA Filter - ValenteThis indicator was based on the Elders Impulse System by astraloverflow.
The only difference is that I included the weekly EMA26 as a filter and you can plot it on the graph if you want (unchecking the Weekly EMA26 won't turn the filter off, will only stop plotting it).
The indicator works this way:
When the MACD Histogram is growing UP, the EMA13 is pointing UP AND the Weekly EMA26 is pointing UP, the bar is Green
When the opposite is true, the bar is Red.
When any condition from both green and red is not true, the bar is blue.
In my opinion, this particular indicator works better on the D1 time frame. I recommended using the original one, by astraloverflow for other time frames.
I hope it is useful!
Trend Trade ( in W, D, H, 15M )Condition:
Uptrend, EMA5 > EMA8 > EMA13
Downtrend, EMA5 < EMA8 < EMA13
EMA# input can be changed by user.
Trading Plan:
1. Long in Uptrend when Price croseover EMA5;
Buy EMA5 + 0.03 (Do not wait for close), initial stop EMA13-0.03
If it is a big Gap up, do not chase. Let it go;
2. Short in Downtrend when Price croseunder EMA5;
Short EMA5 - 0.03 (Do not wait for close), initial stop EMA13+0.03
If it is a big Gap Down, do not chase. Let it go;
3. No target strategy in this study;
Back test Weekly, daily, hourly, 15M chart for ES1!, CL1!, GC1!, SPY, QQQ, TLT, IWM, XLF, XLK, XOP, GS, IBM, APPL, AMD, MMM, WBA
When side way move, Entry could be stopped quickly with small loss;
When entry in trending move, the position could be hold for a good range, and keep adding to winner.
Using this study, Futures and ETFs are better than single stock. Big Gap can break the trend, and trigger big stop loss;
This study is designed to join an existing trend. Try not use this in the time frame below 15 min.
To catch the turning point of a swing, Price action (Demand/Supply Confirmation) and trendlineBreak could be more accurate than EMA/SMA lines.

Trend Exhaustion IndicatorThe Trend Exhaustion Indicator is a custom indicator of mine that is loosely based on the Trend Exhaustion Index created by Clifford L. Creel Ph.D. (Stocks & Commodities V. 9:1 (9-11))
This indicator will let you know the trend reversal points and when it falls below the signal line then the trend is ending vice versa. Buy when the indicator crosses above the signal line and sell when it falls below the signal line.
Let me know if you would like to see me write any other scripts!

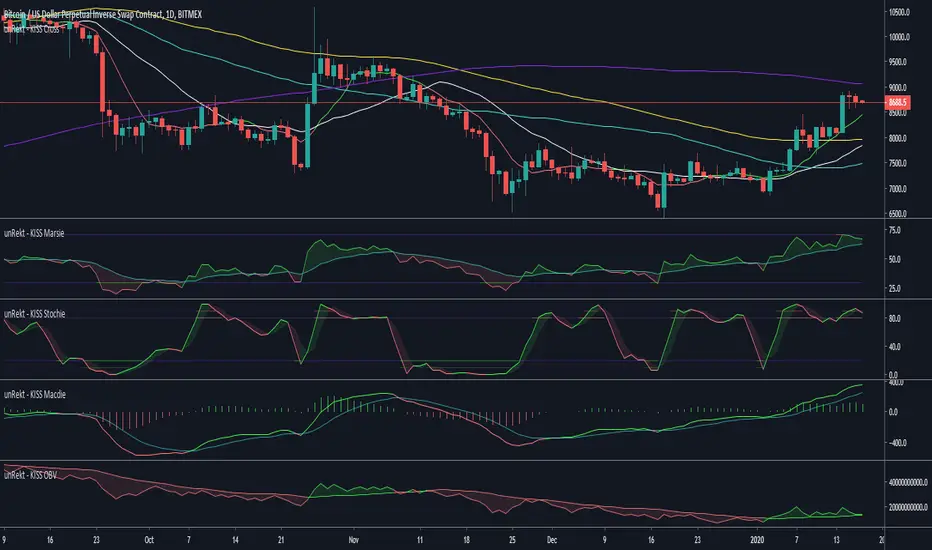
unRekt - KISS MarsieMarsie is an EMA-RSI indicator and part of the 'keeping it simple' series that have a similar color scheme. The RSI 'Relative Strength Index' is a momentum oscillator, measuring the velocity and magnitude of directional price movements. it is measured from 0 - 100 with 30 and 70 being low "oversold" and high "overbought" conditions. It is also commonly used to determine bullish or bearish divergences.
The EMA aspect is the 'Exponential Moving Average' which has had the RSI calculation added to it and acts a signal line when the RSI crosses it for buy and sell opportunities.
3riple Moving AverageBITFINEX:ETHUSD
Description:
Mixing three Simple Moving Averages (7 - 20 - 65) to determine "uptrends" and "downtrends".
Uptrend: When the 7 Line is upper than 20, And 20 Line is upper than 65 that usually means the price is trending up.
Downtrend: When the 7 Line is lower than 20, And 20 Line is lower than 65 that usually means the price is trending down.

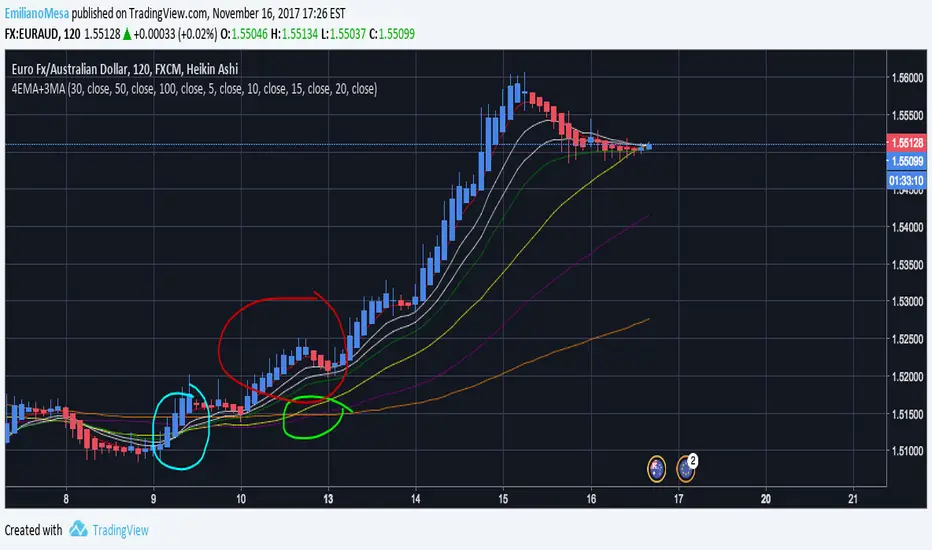
4EMA+3MABased on LazyBear 8MA I decided to do something similar for my personal use. I created an "Alligator" which works with 4 EMA lines and without "future" prediction, it will show you the most recent trend only, creating a later call than the original alligator yet a more precise one. Then there are the 3 MA with huge periods, including 30,50,100. This allows the trader to have a more general idea of the trend compared to that of the 4EMA's which in fact give more value to the current trend. You can change all colors and values.
Details:
As you can see in the graph both EMA & MA work great together. For instance look the blue circle, EMA "Alligator" was crossed giving entry for an early call (which was right), and later on the MA's crossed too! Giving the indication a huge trend was about to appear.
NOTE: Follow my predictions under your own risk. I apreciate all constructive feedback and support on how to improve. Thank you.
Triple Guppy CrossGUPPY MULTIPLE ESTIMATED MOVING AVERAGE (EMA) is for Trend Trading. This script uses three sets of crosses to give us an indicator of possible trend reversal. Red cross is the first alert, followed by blue and black. Black cross being the strongest, red cross weakest.
More information about Guppy Trading can be found in the link below
