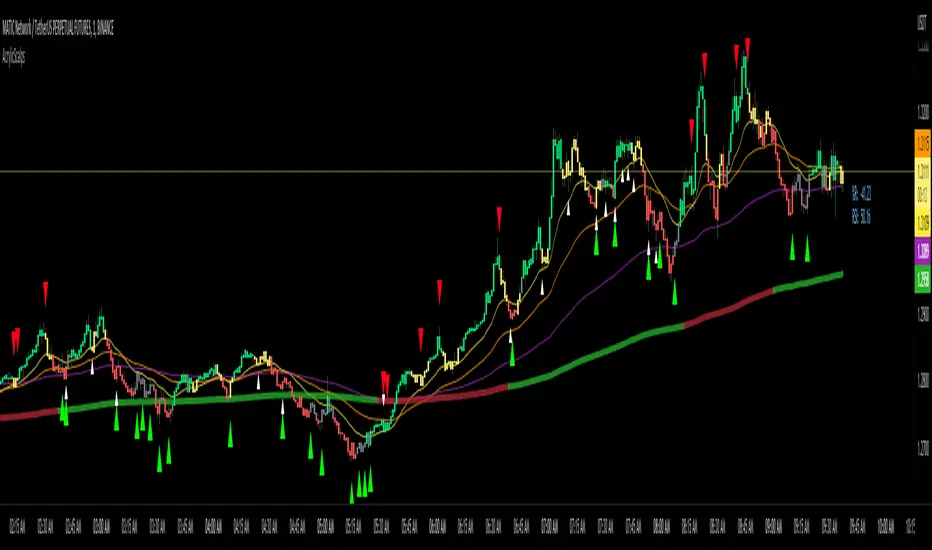
Acrylic's 1m/3m Scalper Buy/Sell SignalsAcrylic's Scalper Signals uses a combination of RSI / Stochastic / Williams %R to calculate the perfect entry signals. The script(with it's default settings) has been optimized and thoroughly tested on BTC & ETH 1 and 3 minute time frames. It's intended for quick in and out trades that should only last a few minutes unless a strong trend is caught. Basic knowledge of market structure is needed, as you will not be taking every signal generated by the script.
You also have the option to display all signals regardless of the short term trend that has been confirmed by RSI. This can be good if you're looking for reversal entries at resistance/support levels.
-Large triangle signal: Strongest signal that was confirmed with RSI & Williams %R optimized calculations. (prints at current candle close)
-Small triangle signal: Fractal signal can be used as a late entry signal/continuation. (prints after 2 candle closes)
-Candle colors are matched to stochastic strength for added confluence to enter trades. (Must hide default trading view candles to see these)
-233SMMA color is matched to the extreme short term trend based off of RSI calculations.
Perfect Long Entry Setup Image :
1) EMA21 > EMA55 > EMA100 > SMMA233(Colored green for added confluence) - All pointing up indicating strong trend
2) Enter on pullback to short term EMA after signal candle closes. (Do not take entry if candles closed below 100EMA)
Perfect Short Entry Setup Image :
1) EMA21 < EMA55 < EMA100 < SMMA233(Colored red for added confluence) - All pointing down indicating strong trend
2) Enter on pullback to short term EMA after signal candle closes. (Do not take entry if candles closed above 100EMA)
Feel free to ask questions or leave feedback in the comments, I'm always looking to improve! Thanks!
Entry
The Zig Zag Leveler IndicatorThis indicator is designed to identify potential trade setups in the market using the ZigZag indicator. It uses a combination of the ZigZag indicator and the background fill color to help identify areas of support and resistance. It also uses a pip offset to help with entries and exits. Additionally, it can generate alert conditions when the market direction changes and when a buy or sell signal is generated. This indicator can be used to help identify potential trade setups and can be customized to fit the user's trading strategy.
This indicator takes the guesswork out of trading by providing traders with an array of signals that can help identify entry and exit points. The indicator uses two sets of signals to identify price levels that indicate potential entry and exit points - one set of signals that indicate potential entry points and another set of signals that indicate potential exit points. The indicator also provides traders with a visual representation of the signals that can help them better understand the signals and make informed trading decisions. With this indicator, traders can have a better understanding of the market and have a better chance of making profitable trades.

[Old] TL with K/K and CustomizationThe old version of Trap Light before the most recent update. In order to facilitate the table functionality that is currently available for Trap Light, I had to make some values that are used in calculations hard-coded. By request, I'm quickly making this version available.
Trap Light
Description
Trap Light is an indicator that uses the K value of the Stochastic RSI to indicate potential long or short entries. It was designed to operate like a traffic stop light that is displayed near the current candle so that you don't have to look away from the candlesticks while trading.
Kriss/Kross is simply a cross over/under strategy that utilizes the 10 EMA and the 50 EMA .
Signals and Available Alerts:
1. Max Sell (Red Sell Label)
When K is equal to 100.00.
This is the strongest sell signal, remember that you only need to make sure that the trend is reversing before you make an entry, because several of these signals can appear in a row if a strong trend hasn't yet reversed.
2. Sell (Red Sell Label)
When K is equal to or greater than 99.50.
A sell signal.
3. Close to Sell (Red Down Arrow)
When K is equal to or greater than 95.00.
A sell signal may be produced soon.
4. Not Ready (Yellow Circle)
When K is less than 95 and greater than 5.00.
This indicates that neither a sell nor buy signal are close to being produced.
5. Close to Buy (Green Up Arrow)
When K is equal to or less than 5.00.
A buy signal may be produced soon.
6. Buy (Green Buy Label)
When K is equal to or less than 0.50 and greater than 0.00.
A buy signal.
7. Max Buy (Green Buy Label)
When K is equal to 0.00.
Strongest buy signal, remember to make sure that the trend is reversing before making an entry.
8. Kriss (Buy)
A buy signal when the 10 EMA (Blue) crosses above the 50 EMA (Yellow). This is also illustrated by the triggering candle being colored blue.
9. Kross (Sell)
A sell signal when the 10 EMA (Blue) crosses below the 50 EMA (Yellow). This is also illustrated by the triggering candle being colored yellow.
Customization of many different options is available, and the code is open-source for your reference, etc.
Remember to do you own due diligence and feel free to leave a comment with questions, etc.

Smooth OscillatorThis is a an Oscillator based on RSI .
As you can see, entry signal for long is when the indicator and bar color is green and exit when red.
Entry signal for short is when the bar turns red and exit when green.
You should always trade with the trend, this oscillator helps to know where the trend is going, because as the trend is exhausting the plot waves moves to the oversold or overbought area, which can help to know when a reversal is coming.
This is a test version, use under your own discretion and do the proper backtesting.
Please comment your experience.

TrapLightTrap Light is built off the stochastic RSI to provide convenience and make your entries while scalping either long/short more straightforward.
Notes/Disclaimer:
This indicator is not guaranteed to work every time. Use it at your own discretion and perform your own due diligence. None of this is financial advice.
The main idea behind this is that when the stochastic RSI reaches such extremes that it often moves in a favorable direction.
K = momentum or the blue line of the stochastic RSI indicator.
Perks:
Don't have to look away from candlesticks and measure stochastic RSI's K level.
Simple visual indication of what to do.
Don't have to stare at your chart all day waiting for things to get exciting.
How to Use:
(Above the current candlestick on any timeframe)
1. When K is greater than or equal to 99.5, it shows a sell signal. This is to indicate a short entry.
2. When K is less than or equal to 0.5, it shows a buy signal. This is to indicate a long entry.
3. If neither the conditions for a short/long entry are present, it shows a circle that is like a traffic light.
Red Light: When K is between 99.5 and 95, a red circle is shown to indicate that a short entry may be available soon.
Yellow Light: When K is between 95 and 5, a yellow circle is shown to indicate that neither a long nor short entry may be available soon.
Green Light: When K is between 5 and 0.5, a green circle is shown to indicate that a long entry may be available soon.
Alerts:
Set an alert on the ticker you trade to notify you when either the green or red light is present so that you have time to prepare to make an entry either long/short.
The Code:
The PineScript is open-source and annotated to explain different parts of the script for ease of understanding.
@Credit to Kingson1 for this strategy and his feedback on its creation/implementation.

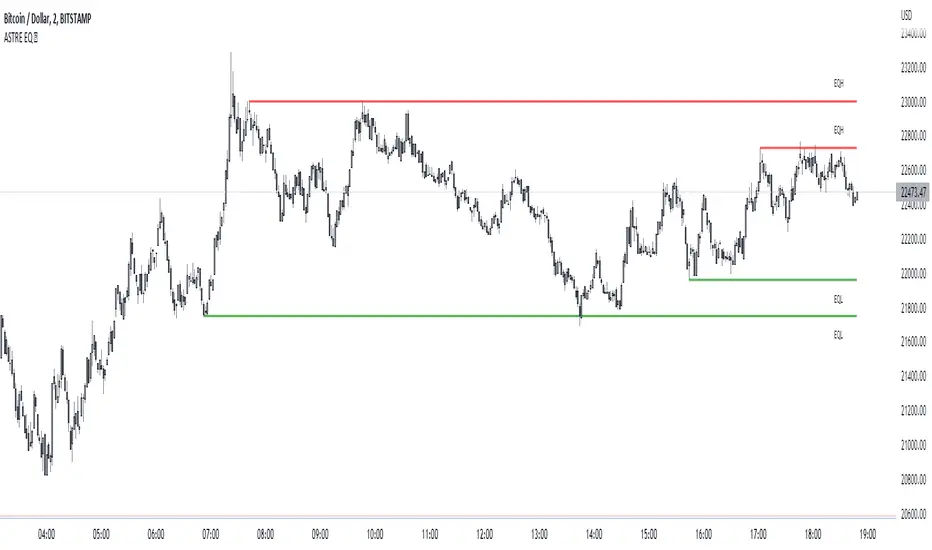
EqwhaleDisplay Equal high/ low, alert when liquidity is taken.. or created !
An innovation that flows a bit if you are an SMC trader and which was actually missing on TradingView: identification of equal high/low, alerts when liquidity is taken... or created!
Its choice in the design means that it gives more importance to the last identified pivots: that is to say that it will display more recently created liquidity than old one! Perfect for identifying market inducement mechanisms (SMC) under an area of interest. This is a typical pattern of induction and false breakout: 2 hits, the break, reintegration, and real move :
Quick exemple on BTC, you are alerted by liquidity created:
Then we grab, and deep. :)
You can display "old broken lines" for backtesting. Careful, it actually display lines when pivot is detected and broken at the same time : it's false. checks that the line has been touched twice :) So, some false lines in the backtest but it does not affect the indicator at all.
You can set number min of pivot at 1 to plot current high/low untested !
Custom GridIt's a simple little tool that enhances Tradingview's horizontal level grid. Set the range of up to 12 assets, you save your model, and the levels will show up automatically when you switch between graphs.
it is obvious to note that the market reacts on the round levels if it discovers its levels for a long time.
Where using notions of supports / resistances gives you level information once the level has been created, again you can correlate this indicator with other SMC and price action tools to identify areas of rejections or dips. institutional interventions.

Liquidity mapLocate institutional daily, weekly, and monthly liquidity intervention zones in an innovative format that allows you to fractalize the degree of trend reversal opportunity across multiple lengths!
Far from the traditional formats to tell you "where's the high/low", we display with this map the grab levels relating to the amplitudes of the measured period.
You can check "show old levels" to backtest these potential fractal reversal areas.
Use the levels that interest you according to your working UT (scalping, intraweek, swing, etc.), or take all the elements into consideration for your trading management :
Confluence the information to optimize your entry and shelter your stop loss under strong levels rejections !
Default parameters are: display high/low weekly & monthly, display liquidities levels in daily.

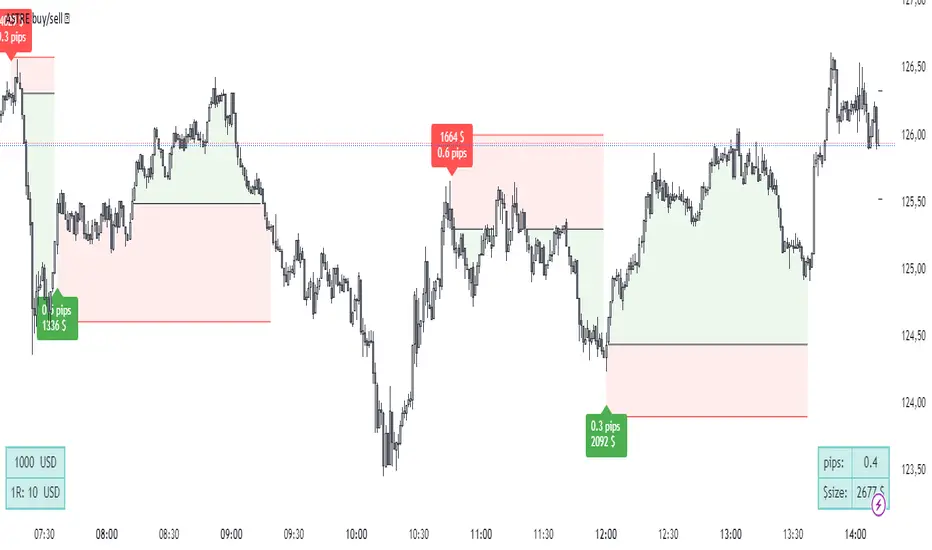
ASTRE Buy/SellWe have designed one of the best buy /sell indicators ! based on our "Reversal score" indicator, a set of strict conditions based on dynamic divergences and fisher's transformation allows to trigger buy signals. The idea is that at a certain level of technical pressure from the indicator, the market has a high probability of changing direction !
(always with the objective of capturing the best top/bottom :) )
Did you miss your trade entry? No problem! The "Barcolor retest" feature allows you to identify a perfect entry on a retest once the structure has been confirmed after a signal:
Exemple on 30s chart :
Using advice :
Use an ATR-type stop loss, or shelter behind bollinger, a short, fixed distance in pips at a minimum below the last local high/low. Your stop loss must be tight and relevant!
For take profit, I recommend that you trail stop part of your position, exit on a contrary signal, or exit part of the position at 5:1 for example.
it is recommended to lower your risk for each identical consecutive signal: 3 buy signals in a row, take a risk for example of $100 on the first, $70 on the second, $40 on the third. The idea is not to be suffocated by the multiple bad signals within the framework of a bad time frame compared to the amplitude of the trend that we seek to take against the trend!
SOON: Easier configuration for 3 commas, backtests. Stay tuned !
astre_ts can in no way be held responsible if your trading account is liquidated after having followed a buy/sell signal and used a large leverage. The signals are reversals: so many are false before having a (very) good trade. Be sure to have strict risk management, or to use a complete strategy so that your results are faithful to the backtests.
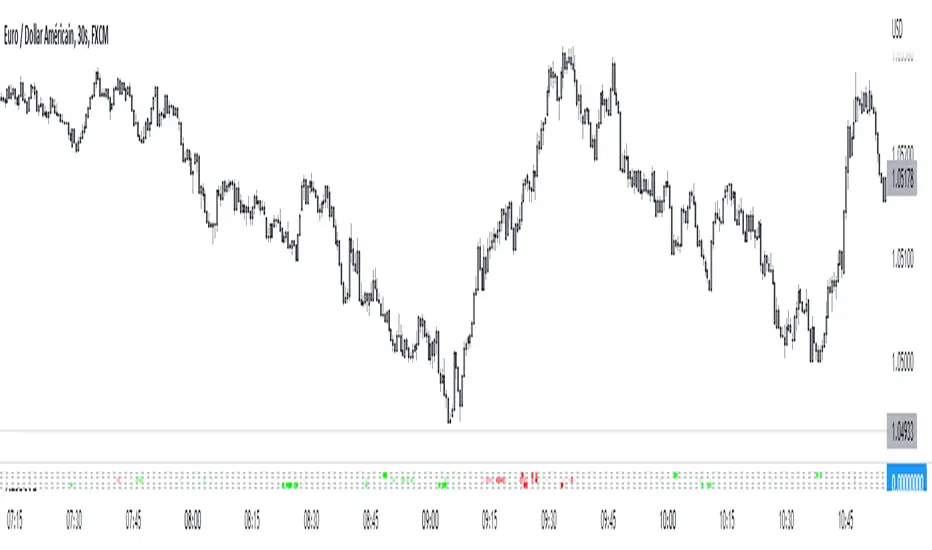
Reversal scoreDynamic divergence indicator on 3 indicators, without delays or repaints
Technological choices have been made so as not to lie to you about the signals, and so that the backtesting is perfectly faithful to reality. The market is analyzed and looks for a dynamic status of divergence on the Fisher transformation, the Money Flow Index and the MACD: if the status is "divergence", it is quantified by a divergence score to assess its potential and whose parameters are multiple (including market structure during divergence status).
At the top Reversal score, at the bottom the divergence indicator integrated in Tradingview. On this last candle, there will indeed be an RSI divergence but which will only be displayed 5 candles later, where ASTRE displays it to you in real time:
You will notice how certain spikes trigger sharp divergence – an anomaly between the movement of the price and that of the indicators is a good sign of an instant reversal, and in m2, a way to take a 2:1 TP in seconds:
Usage tip: Follow the signals in the direction of the main trend! They are much less numerous but very effective! :
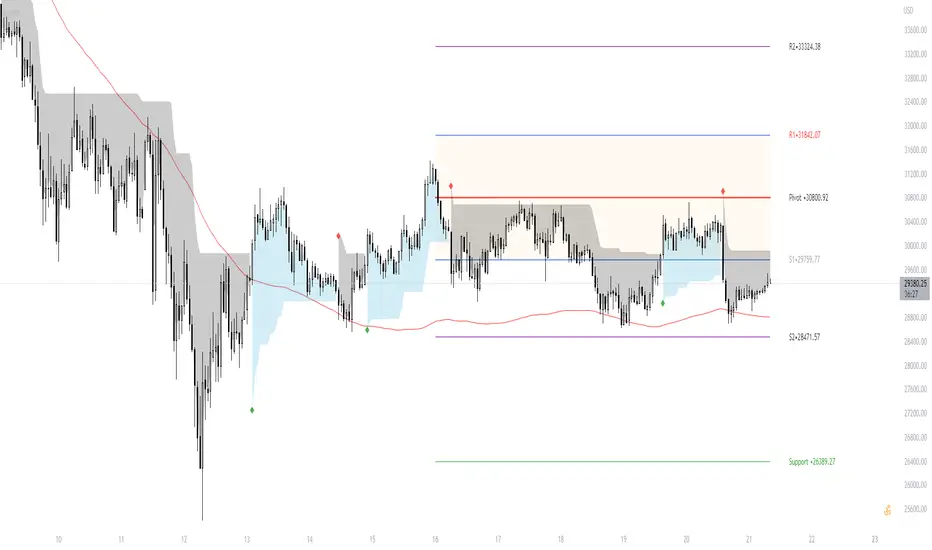
[TT] Daily Levels
These pivots are based on calculations that i have been using for quite some time. I'm sure There is no need to explain on how to use pivots.
Labels are given to understand and you can Msg me here or comment if u need any explanation.
I have given few examples below.. check i t out
XAUUSD
BTCUSD
Nifty
Banknifty
Gain/StopLoss Percentage LinesGain/StopLoss Percentage Lines is a quick way to enter your Entry Price in to a stock and track the percentage of gain or loss at the 5% and 10% markers.
Click on the gear settings icon and type in your entry price. The percentage is defaulted to 5%. You can change this to a different percentage at this screen. Note that whatever number you enter will be doubled for the upper and lower lines. For instance, if you want to set your first red line stop loss and green gain line at 2.5%, your two other upper and lower green and red lines will be at 5%.
However, this will not change the text on the tab marker.
To change the tab text, go in to the Pine Editor and change the green text that says "5% Gain" and "5% Loss" to your new percentages.

Bjorgum MTF MAScope:
Up to 3 MA's can be applied at the users discretion
Choose between 10 different average types including favorites from the Bjorgum series from HEMA to Reversal T3's
Each MA can be independently set
Go Multi-timeframe! Any MA can be set to any timeframe of reference you choose (ex. using 3 different timeframes of higher resolution to your chart reference to establish a multi-time frame trend)
RSI HEATMAP. Use the bar color or the MA color selection toggle to set your color to reference RSI on a gradient. This helps to establish clear visual reference to momentum on top of trend analysis
Assigning RSI bar color to an MA of a higher time frame can allow you to see visual reference of momentum of the greater trend that may be at play.
Example: trying to get short on a 15min while your 1hr and 4hr RSI Heatmap burns deep in oversold.
RSI color can be assigned to the bar color, the MA (1,2 or 3), or both. Alternatively, bar color can be assigned to a more simple rising/ falling MA color and price above/ below the MA for bar color.
ALL MTF FUNCTIONS ARE NON_REPAINTING.
The Idea
The original inspiration behind the script came from an observation of a constant struggle of Pinecoders of both youth or experience to find accurate multi-timeframe indicators that do not repaint, and appear as should on historical bars, while performing reliably in real time. I encourage you to scroll the Pinecoders FAQ on a recent piece explaining the difficulties and caveats of different approaches, but I would like to reference the elimination of the historical bar offset for THIS purpose. MA's are based on closing prices, that is to say they are confirmed and will not change once the bar has closed. There is no need to offset these for historical reference. The purpose of the historical offset is best exemplified, for example, with an intraday strategy involving daily breakouts. Let's entertain going long on a break to a new daily high. We would not know that in real time so we need to reference the previous bars close for BACKTESTING purposes, otherwise we get "lookahead bias". There is no shortage of strategies unintentionally employing this bias out there (I'm sure you have come across them with their unrealistic results).
There is no worry of repainting with the MTF security function included within this script, nor will it offset for something involving lookahead bias. I encourage those that are playing with the code or perhaps writing strategies of their own to borrow the functions within. There is also a function that will return the 10 MA variable selection - yours to keep.
With all that in mind, I wanted a practical script that is easily deployable in everyday trading for the average trader that gives the user a firm grip on their trading steering wheel equipped with the feel of the road. Incorporating several MA's of differing times with the RSI heatmap gives a good visual reference and feel to your trading environment, while offering a level of customization that will fit an individuals personal trading style. The RSI heatmap gradient is per percentage between 30 and 70 and your 2 colors - anything outside of those levels gives you the vibrant bias color
Below I walk through 2 examples of live trades scenarios I made using the mindset the script offers.
The Trade
LONG IZEA
Timeframe: 4hr chart
- 3 Tilson MA's of varying length are deployed at varying intraday time frames
- A bullish pattern in an uptrend offers a possible trade allowing entry from a low risk point from the pattern low
- See the chart for notes and observations using the script
- Notice how the heatmap brightens up as price extends far away from the averages - your risk has elevated for a new position
- Notice the heatmap cool off while price action consolidates sideways
The Trade
SHORT BTCUSDT
Timeframe: 4hr chart
- 3 EMAs are employed - same length (50), with 3 successive timeframe resolutions
- A downtrend is formed with a sharp move to stack the EMAs into layers
- A pull back opportunity presents itself in bearish consolidation
- Notice a Doji star at resistance establishing a swing high as RSI cools off into the EMA dynamic resistance for entry
- An '"equal legs" measured move can be used for a trade target with a stop out above the swing high.
- Again, take note of distance from EMA's, the heatmap in combination with trend development surrounding the MA's
These were just two ideas to show you an example of how to implement some strategy into your trading and to get some interesting use from the indicator. Hope you enjoyed the read and happy trading.

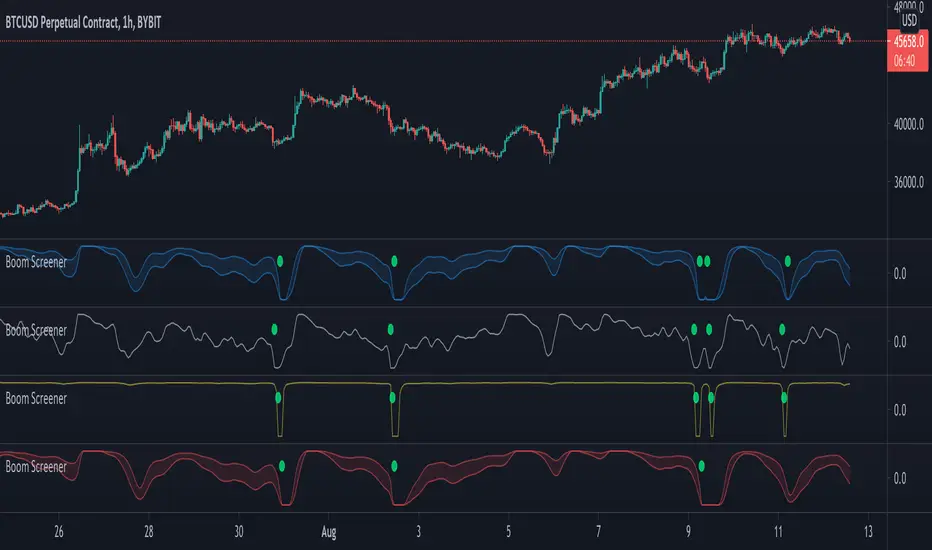
Boom Hunter - Entry Point Screener AlertsStock screener for Boom Hunter and Boom Hunter Pro entry zones. This script will screen 18 different stocks for entry zones.
1. Enter in any ticker ID's from charts you wish to scan in the settings.
2. Go to desired timeframe.
3. Click add alert button at top toolbar.
4. Select Boom Screener indicator, input alert notification settings and/or change alert name and click create.
The script will then scan the stocks and alert you of any entry zones from the timeframe you set the alerts.
A new alert needs to be created for each timeframe you wish to screen.
Boom Hunter ProBoom Hunter Pro is the ultimate indicator for targeting perfect long entries and epic shorts. Boom Hunter comes with a super fast oscillator that uses Ehlers Early Onset Trend (EOT). This is the Center Of Gravity Oscillator (COG) with a super smoothing filter and a roofing filter. This indicator is tuned for 1 hour charts but can be used on any time frame.
Colored bars can be turned on to assist in finding an entry. Purple signifies a drag and potential dump.
Fibonacci lines can be turned on to track price action and find entries/exit.
This indicator follows the same rules as COG. For more information please see my COG HOWTO here:

Relative Volume Screener AlertsThis script will screen 12 different stocks and current chart (13 in total) for entry points from my relative volume indicator.
1. Enter in any ticker ID's from charts you wish to scan in the settings.
2. Go to desired timeframe.
3. Click add alert button at top toolbar.
4. Select RVOL Screener Alerts indicator, input alert notification settings and/or change alert name and click create.
The script will then scan the stocks and alert you of any entry points from the timeframe you set the alerts.
A new alert needs to be created for each timeframe you wish to screen.
You can find my relative volume indicator here:

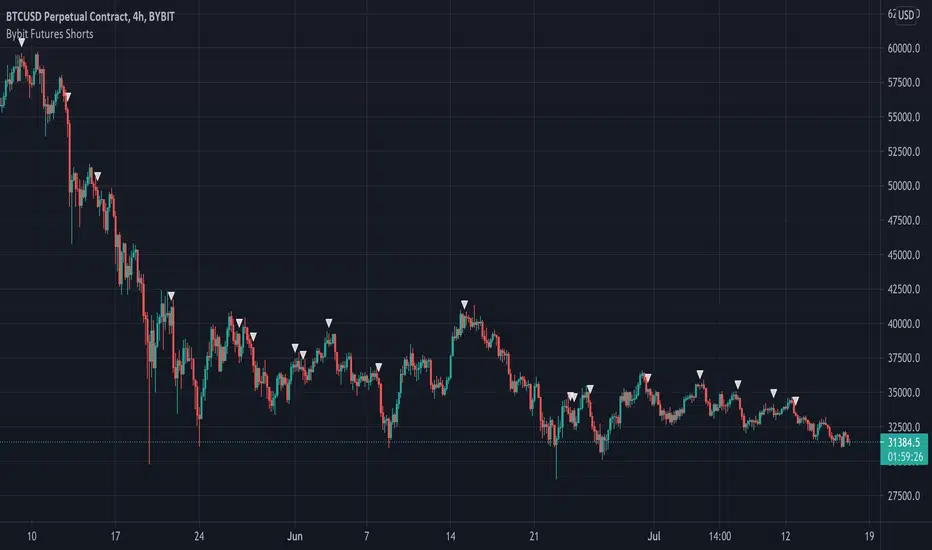
Bybit Futures ShortsThe whales love to short! This indicator emulates a strategy used by institutions to find short entries. It is designed for use on the Bybit exchange 4hr futures contracts but can be used on any timeframe on any Bybit contract. This is a great way to short with the whales. Please note this only works with Bybit.
Below is an example on 4hr chart:
Below is an example on 1hr chart:
Below is an example on Daily chart:
Good Luck!
MM Scalper A scalpers Dream just like my other algorithms you have your SL, 2TPs, and entry points to scalp the market based on these two MoneyMoves Moving averages.
can use
Entry
2 TP
ATR x1.5 or x2 Stop Loss auto generated per signal.
BB Bands, TMA Bands, Donchain channels, or volatility cloud
MTF support and resistance
pivot high/low
works on all timeframes for scalpers, intraday, or even swing.
effective on binary as well.
Directions are simple
when one Ma crosses the other you will receive a signal with all your inputs
the signals change based on the length you set on the Baseline and Slop
use market structure and its it a sure winner
Link below or PM us for access to this indicator Happy Trading

Boom HunterEvery "boom" begins with a pullback... This indicator will help traders find bottoms and perfect entries into a pump. It combines two indicators, Dr. John Ehlers Early Onset Trend (EOT) and the infamous Stochastic RSI. The indicator features a built in dump and dip detector which usually picks up signals a few candles before it happens. The blue wave (EOT) shows trend, when waves travel up so does the price. Likewise for the opposite. Low points are revealed when EOT bottoms out and flat lines. Traders can then use the Stochastic RSI crossover to enter a trade. As the EOT lines get closer together there is more movement in price action, so as they get wider traders can expect sideways action. This indicator works on all timeframes but has had excellent results on hourly chart.
Entry zones are marked with a green dot at top of indicator. This signals a bottom is being formed and traders should look for an entry.
Exit points are marked with a red dot at top of indicator. This signals a peak and great time to exit.
Dips and dumps are indicated in red at bottom of indicator.

LSMA Wave RiderThe LSMA Wave Rider uses Least Squares Moving Average to make a fast oscillator ideal for scalping lower timeframe charts. Upper and lower bands contract during pullback and expand as it "booms". The perfect entry is the first crossover after bands expand. This is a great tool for entering trades.
The above image shows two examples of perfect entries:
1. The upper and lower bands contract getting tighter as it pulls back.
2. The upper and lower bands then begin to expand as it gets ready to fly.
3. The oscillator crosses over showing entry point.
* Please note that this strategy may not work during major downtrends. *
Oscillator 2 is used to detect diversions. Reduce the number to pick up shorter diversions and increase to 200 to pickup larger diversions.

Easy Entry/Exit Trend Colors (With Alerts)This is an updated version of user Algokid's script called 'AK MACD BB INDICATOR V 1.00'. You can find that original script here:
I added many alerts along with the Bullish and Bearish alerts when the MACD crosses over the Upperband or crosses down on the Lowerband.
I personally use this indicator with Crypto charts (Bitcoin on a 15min, 1hour, and 4 hour timeframe) as one of many confirmations that it's a good time to enter a trade. This script was made to be easy to follow with the colors of GREEN triangles being a good uptrend or entry confirmation, and RED being a confirmation to sell/short or exit your trade.
It's important to use this indicator in combination with other indicators that can give you more confirmations to enter or exit a trade, and make sure you are on normal candles and not HA or any other candles as you can get wildly inaccurate results.
This script also has the Death & Golden crosses, which is the slow and fast moving averages crossing over each other. I don't use this as an additional confirmation, it's just nice to know where the cross happens.

Stochastic RVIBased on the Stochastic RSI but uses RVI (Relative Volatility Index) as source. Another great tool for finding market lows and entry points. This oscillator is also good for finding accurate diversions.

