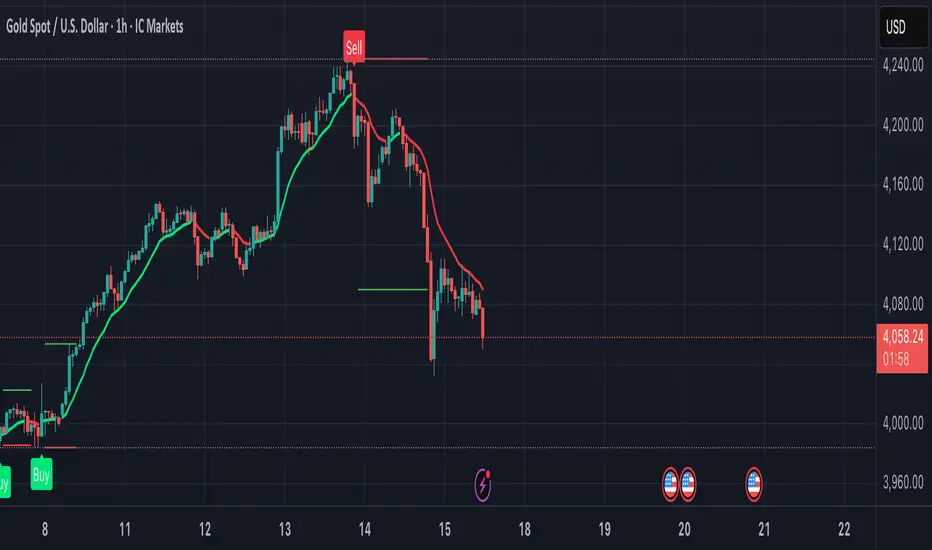
Axis-Pro System | Trend Structure + Fibonacci Pullbacks Axis-Pro System is a comprehensive Trend Following strategy designed to trade high-probability pullbacks. Unlike indicators that merely chase price, this system patiently waits for market structure alignment before seeking an entry.
The system is built on the premise of "Quality over Quantity", utilizing volatility and structure filters to avoid choppy markets (ranges) and false breakouts.
🧠 Strategy Logic
The system makes decisions based on a strict 4-step hierarchy:
Higher Timeframe (HTF) Bias:
Analyzes the trend on a higher timeframe to ensure we are trading in the direction of the dominant flow.
Structure & BOS (Break of Structure):
Identifies clear impulses that break previous highs or lows. Once a BOS is confirmed, the system "arms" the trade and waits.
Fibonacci Zone Pullback:
It does not chase the breakout. Instead, it waits for a pullback into the "Discount Zone" (Golden Zone, configurable between 0.382 and 0.618) to improve the Risk/Reward ratio.
Validation & Trigger:
Uses an ATR expansion check to filter out low-volatility periods.
Requires candle confirmation and alignment with fast EMAs before pulling the trigger.
🛡️ Risk Management
The system incorporates advanced position management using a split execution model (50/50):
Dynamic Stop Loss: Automatically calculated using an ATR multiplier or the recent Swing High/Low (whichever offers better protection).
TP1 (Take Profit 1): Closes 50% of the position at a fixed R-multiple (e.g., 1.5R) to lock in profit and moves the Stop Loss to Break-Even.
TP2 (Runner): The remaining 50% is left to run for higher targets (e.g., 3.0R) or until the trend bends, maximizing gains during strong moves.
Trailing Stop: Optional feature to trail price with a fast EMA once the first target is hit.
⚙️ Settings & Features
The script is highly customizable for different assets (Crypto, Forex, Indices):
Date Range Filter: Includes a date selector to perform precise Backtesting on specific periods (e.g., testing specifically during a Bear Market vs. Bull Market).
Auto Trendlines: Automatically draws relevant trendlines for visual support.
Quality Filters: Options to toggle the EMA 200 filter and breakout buffers.
⚠️ Disclaimer
This strategy is a tool for analysis and backtesting purposes. Past performance does not guarantee future results. It is highly recommended to test the strategy on a Demo account first and adjust parameters according to the volatility of the specific asset being traded. Always use responsible risk management.
Fibonacci

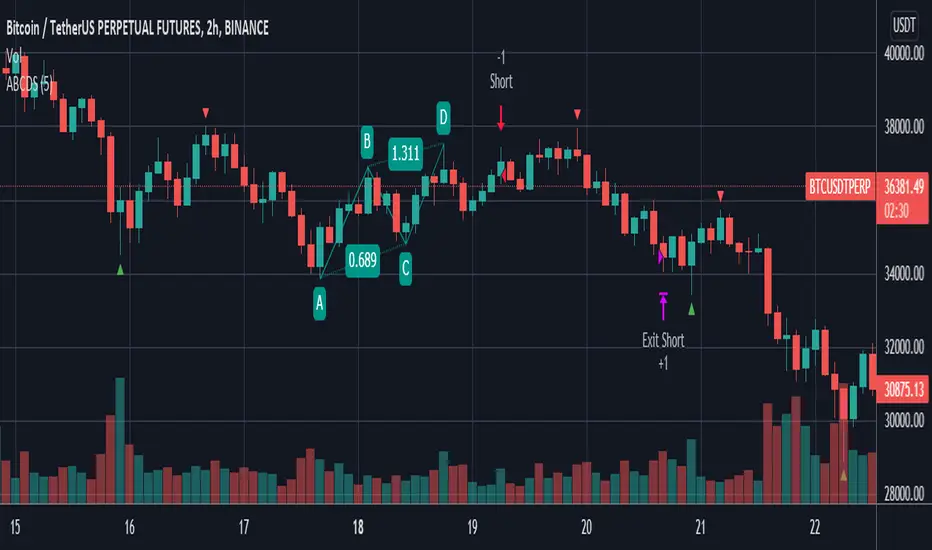
Fibonacci 5 Candles Retracement
================================================================================
FIBONACCI 5 CANDLES RETRACEMENT - STRATEGY GUIDE
================================================================================
WHAT DOES THIS STRATEGY DO?
---------------------------
This strategy automatically identifies market trends and uses Fibonacci
retracements to find the best entry points. The idea is simple: when price
makes a strong movement (trend), it often pulls back before continuing in
the same direction. The strategy captures these "pullbacks" to enter at the
right moment.
HOW IT WORKS?
-------------
1. TREND DETECTION
The strategy looks for 5 consecutive candles of the same color:
- 5 red candles = BEARISH trend (price falls)
- 5 green candles = BULLISH trend (price rises)
2. CALCULATION OF START AND END POINTS
For a BEARISH trend (5 red candles):
- START: The highest point between the first red candle and the previous one
- END: The lowest point reached during the 5 candles (and beyond, if the
trend continues)
For a BULLISH trend (5 green candles):
- START: The lowest point between the first green candle and the previous one
- END: The highest point reached during the 5 candles (and beyond, if the
trend continues)
3. DYNAMIC UPDATE
The END point updates automatically if price continues to move in the
direction of the trend, creating new highs (for bullish trends) or new
lows (for bearish trends).
4. TREND END
Normal Mode:
- BEARISH trend ends when a candle closes above the previous candle's open
- BULLISH trend ends when a candle closes below the previous candle's open
"Extended Trend" mode (optional):
- The trend remains active until a candle closes beyond the dynamic 50%
retracement level
- When this happens, the END point "freezes" (stops updating), but the
trend can continue
5. FIBONACCI RETRACEMENT CALCULATION
Once START and END are identified, the strategy automatically calculates
Fibonacci levels. IMPORTANT: for retracements and pending orders, we
consider START as 100% and END as 0%, because we work on the part of the
trend that is recovered (the pullback).
The retracement levels are:
- 70% = level closest to START (smallest retracement)
- 60% = second level
- 50% = central level (often used for entry)
- 25% = level closest to END (largest retracement)
6. PENDING ORDER PLACEMENT
When a trend is identified and completed, the strategy automatically places
a pending order (limit order) at one of the selectable Fibonacci levels.
Available levels:
- 25%: closest to END
- 50%: central level (balanced)
- 60%: closest to START
- 70%: very close to START
The order direction depends on the trend:
- BEARISH trend → SHORT order (bet that price falls)
- BULLISH trend → LONG order (bet that price rises)
Stop Loss and Take Profit (for retracements):
- Stop Loss: always at START level
- Take Profit: always at END level
EXTENDED TAKE PROFIT:
If the order is executed (filled), the strategy can apply an "Extended
Take Profit" if configured. IMPORTANT: for the extended TP calculation,
we consider START as 0% and END as 100% (the original trend movement).
For example, if you set 3%, the Take Profit will be at 103% of the
original trend movement instead of 100%.
AVAILABLE FILTERS
-----------------
1. MINIMUM TREND (pips)
Filters trends that are too small. If a trend is below the set value:
- START and END labels become gray (instead of red/green)
- No pending order is placed
- The trend is still displayed on the chart
Useful for avoiding trading movements that are too small.
2. EMA FILTER
Uses two moving averages (EMA 50 and EMA 200) to filter direction:
- If active: places LONG orders only when EMA50 > EMA200 (uptrend)
- If active: places SHORT orders only when EMA50 < EMA200 (downtrend)
Useful for trading only in the direction of the main trend.
3. EXTENDED TREND
Modifies how the trend is considered "completed":
- If disabled: uses normal logic (opposite candle)
- If active: the trend remains in formation until a candle closes beyond
the dynamic 50%. When this happens, END freezes but the trend can continue.
Useful for capturing longer trends and extended movements.
VISUALIZATION
-------------
The strategy displays on the chart:
1. START AND END LABELS
- Red color for bearish trends
- Green color for bullish trends
- Gray color if the trend is not valid (too small)
- Remain visible even when new trends form
2. START AND END LINES
- Horizontal lines indicating the start (START) and end (END) points of the trend
- White color by default, customizable from the settings panel
- Update dynamically when the END point changes
- Can be shown or hidden via the "Show Start/End Lines" option
3. FIBONACCI LINES
The strategy shows horizontal lines at retracement levels:
- Line at 50% (yellow by default)
- Line at 25% (green by default)
- Line at 60% (azure by default)
- Line at 70% (red by default)
COLOR CUSTOMIZATION:
All line colors can be customized from the settings panel in the
"LINE COLORS" section:
- Start/End Line Color: customize the color of START and END lines
- 50% Line Color: customize the color of the 50% line
- 25% Line Color: customize the color of the 25% line
- 60% Line Color: customize the color of the 60% line
- 70% Line Color: customize the color of the 70% line
Lines update dynamically when the END point changes and can be shown or
hidden individually via options in the "VISUALIZATION" section.
4. PENDING ORDER LABELS
Show pending order information:
- Direction (LONG or SHORT)
- Entry price
- Stop Loss
- Take Profit
Positioned far from the chart to avoid cluttering the visualization.
ALERTS
------
If enabled, alerts send notifications when:
1. PENDING ORDER CREATED
When a new pending order is placed, with all information.
2. PENDING ORDER UPDATED
When the pending order is updated (for example, if the level changes or
if the END point moves).
3. ORDER OPENED
When the pending order is executed (filled) and the position is opened.
Alerts can be configured in TradingView to send notifications via email,
SMS, or other platforms.
RECOMMENDED SETTINGS
--------------------
To get started, you can use these settings:
VISUALIZATION:
- Show all lines and labels to see how it works
- Show Start/End Lines: true (to display lines at START and END points)
- Customize line colors in the "LINE COLORS" section according to your preferences
STRATEGY:
- Pending Order Level: 50% (balanced)
- Extended TP: 0% (use standard TP at 100%)
FILTERS:
- Minimum Trend: 0 pips (disabled initially)
- Use EMA Filter: false (disabled initially)
- Extended Trend: false (use normal logic)
ALERTS:
- Enable Alerts: true (if you want to receive notifications)
PRACTICAL EXAMPLE
-----------------
Scenario: Bearish Trend
1. Price forms 5 consecutive red candles
2. The strategy identifies:
- START = 1.2000 (highest point)
- END = 1.1900 (lowest point)
- Range = 100 pips
3. Calculates Fibonacci levels (for retracements: START = 100%, END = 0%):
- 100% = 1.2000 (START)
- 70% = 1.1930
- 60% = 1.1940
- 50% = 1.1950
- 25% = 1.1975
- 0% = 1.1900 (END)
4. If you set "Pending Order Level" to 50%:
- Places a SHORT pending order at 1.1950 (50% retracement)
- Stop Loss at 1.2000 (START = 100%)
- Take Profit at 1.1900 (END = 0%)
5. If price rises and touches 1.1950:
- The order is executed
- Opens a SHORT position
- If price falls to 1.1900 → Take Profit (profit)
- If price rises to 1.2000 → Stop Loss (loss)
IMPORTANT NOTE
--------------
This strategy is a technical analysis tool. Like all trading strategies,
it does not guarantee profits. Trading involves risks and you can lose money.
Always use appropriate risk management and test the strategy on historical
data before using it with real money.
LICENSE
-------
This code is open source and available for modification. You are free to
use, modify, and distribute this strategy. If you republish or share a
modified version, please kindly mention the original author.
================================================================================

Fibonacci Swing Trading BotStrategy Overview for "Fibonacci Swing Trading Bot"
Strategy Name: Fibonacci Swing Trading Bot
Version: Pine Script v5
Purpose: This strategy is designed for swing traders who want to leverage Fibonacci retracement levels and candlestick patterns to enter and exit trades on higher time frames.
Key Components:
1. Multiple Timeframe Analysis:
The strategy uses a customizable timeframe for analysis. You can choose between 4hour, daily, weekly, or monthly time frames to fit your preferred trading horizon. The high and low-price data is retrieved from the selected timeframe to identify swing points.
2. Fibonacci Retracement Levels:
The script calculates two key Fibonacci retracement levels:
0.618: A common level where price often retraces before resuming its trend.
0.786: A deeper retracement level, often used to identify stronger support/resistance areas.
These levels are dynamically plotted on the chart based on the highest high and lowest low over the last 50 bars of the selected timeframe.
3. Candlestick Based Entry Signals:
The strategy uses candlestick patterns as the only indicator for trade entries:
Bullish Candle: A green candle (close > open) that forms between the 0.618 retracement level and the swing high.
Bearish Candle: A red candle (close < open) that forms between the 0.786 retracement level and the swing low.
When these candlestick patterns align with the Fibonacci levels, the script triggers buy or sell signals.
4. Risk Management:
Stop Loss: The stop loss is set at 1% below the entry price for long trades and 1% above the entry price for short trades. This tight risk management ensures controlled losses.
Take Profit: The strategy uses a 2:1 risk-to-reward ratio. The take profit is automatically calculated based on this ratio relative to the stop loss.
5. Buy/Sell Logic:
Buy Signal: Triggered when a bullish candle forms above the 0.618 retracement level and below the swing high. The bot then places a long position.
Sell Signal: Triggered when a bearish candle forms below the 0.786 retracement level and above the swing low. The bot then places a short position.
The stop loss and take profit levels are automatically managed once the trade is placed.
Strengths of This Strategy:
Swing Trading Focus: The strategy is ideal for swing traders, targeting longer-term price moves that can take days or weeks to play out.
Simple Yet Effective Indicators: By only relying on Fibonacci retracement levels and basic candlestick patterns, the strategy avoids complexity while capitalizing on well-known support and resistance zones.
Automated Risk Management: The built-in stop loss and take profit mechanism ensures trades are protected, adhering to a strict 2:1 risk/reward ratio.
Multiple Timeframe Analysis: The script adapts to various market conditions by allowing users to switch between different timeframes (4hour, daily, weekly, monthly), giving traders flexibility.
Strategy Use Cases:
Retracement Traders: Traders who focus on entering the market at key retracement levels (0.618 and 0.786) will find this strategy especially useful.
Trend Reversal Traders: The strategy’s reliance on candlestick formations at Fibonacci levels helps traders spot potential reversals in price trends.
Risk Conscious Traders: With its 1% risk per trade and 2:1 risk/reward ratio, the strategy is ideal for traders who prioritize risk management in their trades.

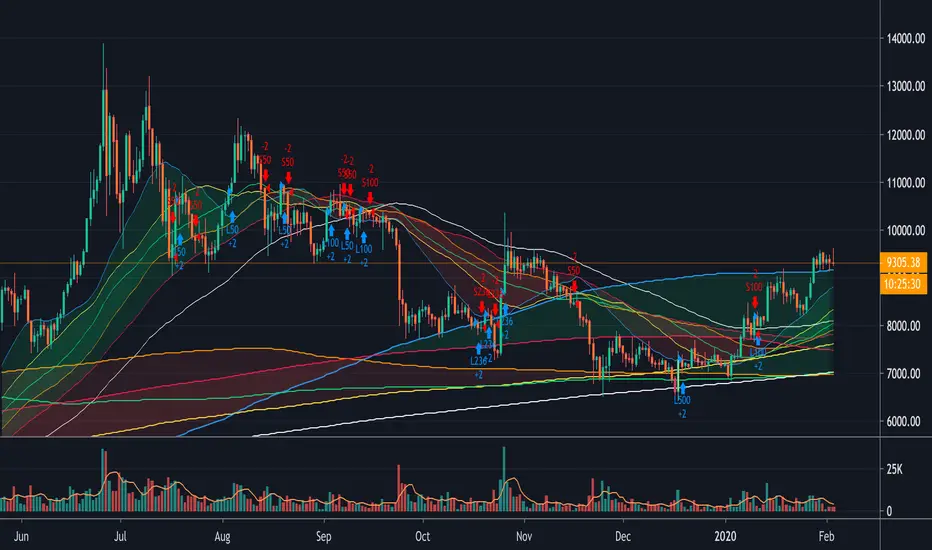
CC Trend strategy 2- Downtrend ShortTrend Strategy #2
Indicators:
1. EMA(s)
2. Fibonacci retracement with a mutable lookback period
Strategy:
1. Short Only
2. No preset Stop Loss/Take Profit
3. 0.01% commission
4. When in a profit and a closure above the 200ema, the position takes a profit.
5. The position is stopped When a closure over the (0.764) Fibonacci ratio occurs.
* NO IMMEDIATE RE-ENTRIES EVER!*
How to use it and what makes it unique:
This strategy will enter often and stop quickly. The goal with this strategy is to take losses often but catch the big move to the downside when it occurs through the Silvercross/Fibonacci combination. This is a unique strategy because it uses a programmed Fibonacci ratio that can be used within the strategy and on any program. You can manipulate the stats by changing the lookback period of the Fibonacci retracement and looking at different assets/timeframes.
This description tells the indicators combined to create a new strategy, with commissions and take profit/stop loss conditions included, and the process of strategy execution with a description of how to use it. If you have any questions feel free to PM me and boost if you found it helpful. Thank you, pineUSERS!
CHEATCODE1

DELAYED FIBOfibo delayed and real value wave design. Burada bandlar arası dalgalanmadan faydalanılmakta.

Solution Zigma - Fibonacci Impulse'Solution Zigma' is strategy for any securities because this strategy use EMA of Fibonacci Level and Plot Like candle easy for analysis trend impulse. This strategy used DMI(ADX) for filter sideway but not greatest indicator, Please use this strategy with Risk Management.
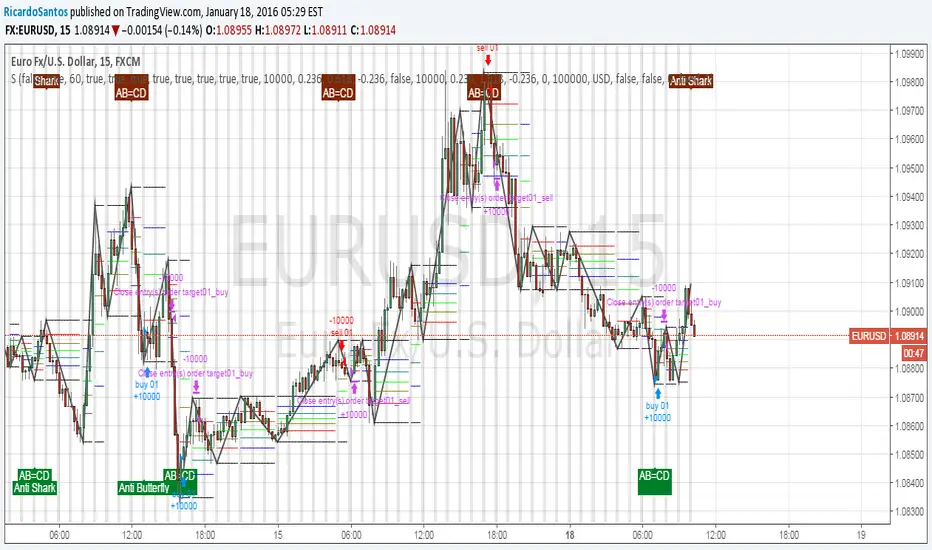
ABCD StrategyOne from many harmonic pattern that consists of two equivalent price legs. The ABCD pattern that helps traders predict when the price is about to change direction.
Tracing And Calculation
This code using pivot high and pivot low built-in method and calculate with Fibonacci Retracement.
Limitation
To find ABCD pattern is very difficult, just coming up a few from thousand candle. That why this code using little bit tolerance ratio to get more pattern.
Auto Fib Golden Pocket Band - Strategy with Buy Signalsthis strategy is based on the Indicator "Auto Fib Golden Pocket Band - "Autofib Moving Average"
it's the same as the indicator but with:
- the strategy tester included
- several entry Signal filter
- Dynamic SL

Fibonacci + RSI - StrategyStrategy: Fibonacci + RSI:
- Intraday trading strategy (Scalping).
Time Frames Tested with best Results:
30 Minutes.
5 Minutes.
15 Minutes.
1 Minute
Indicators Used:
RSI (30 / 70)
Fibonacci (1 - 0.784)
How it Works:
Once the Price Hits the 1 or -1 Fibonacci Level and bounces a little bit, It checks the RSI if Over Bought or Over Sold According to 30 - 70.
If both conditions are satisfied, it triggers a Long or Short Positions.
Further Notes:
- I have put a Stop-loss with a 2% just for further upgrades.
- Not advised to use in High Volatility Markets.
- No Repaint was observed during a 2-Weeks Tests.
If you have any suggestions or modifications please contact to add.
If you have observed any bad behavior please contact to fix.
Trade wisely.

[fikira] Fibma/Fibema StrategyMy strategy regarding the Fibma/Fibema lines (also see my Fibma/Fibema study)
You can enable/disable each strategy to see what
works best in what timeframe
Thanks!
[STRATEGY][RS]ZigZag PA Strategy V4.1EXPERIMENTAL:
WARNING: this strategy repaints after reloading and results are heavily curve fitted, use at your own discretion.
UPDATE: (AleksanderThor) add option for a 2nd target, to use you need to activate pyramiding with a setting of 1 manually (not possible to change programatically) .
[STRATEGY][RS]ZigZag PA Strategy V4EXPERIMENTAL:
WARNING: highly curve fitted results, if you dont know whats going on stay away.
