Asset Liquidity Meter by Funded RelayAsset Liquidity Meter by Funded Relay
This indicator estimates the liquidity of any asset by calculating the volume traded per unit of price movement (volume / (high - low)).
Higher values generally indicate better liquidity (more volume in a smaller price range → easier to enter/exit positions with less slippage).
Lower values suggest thinner liquidity (higher risk of price impact and volatility).
The indicator displays:
• Histogram: raw liquidity per bar (green = above SMA, red = below SMA)
• SMA line: smoothed liquidity trend
• Real-time info table in the top-right corner
• Built-in alert conditions
How to Use – Step by Step
1. Adding the Indicator
- Open any chart on TradingView
- Click the "Indicators" button at the top
- Search for "Asset Liquidity Meter v6" (or find it in Community Scripts / My Scripts)
- Click to add it to the chart
- It will appear in a separate pane below the price chart
2. Customizing Settings
Double-click the indicator name in the pane (or right-click → Settings):
• SMA Length (default: 14)
- Controls the smoothing period of the liquidity trend line
- Smaller values (5–10) → more responsive, good for intraday/scalping
- Larger values (20–50) → smoother trend, better for swing/position trading
• Epsilon (default: 0.00000001)
- Tiny value that prevents division-by-zero errors on flat bars (high = low)
- Almost never needs to be changed
• Colors
- High Liquidity Color: histogram bars when liquidity > SMA
- Low Liquidity Color: histogram bars when liquidity < SMA
- SMA Line Color: color of the smoothed trend line
• Show Alert Conditions in Menu
- Keep enabled (true) to see the built-in alert options when creating alerts
3. Reading & Interpreting the Indicator
• Histogram Bars (Raw Liquidity)
- Height = amount of volume per unit of price range
- Tall bars = high liquidity (market is "thick")
- Short bars = low liquidity (market is "thin")
- Green = current liquidity is stronger than the average (SMA)
- Red = current liquidity is weaker than the average
• Blue SMA Line
- Shows the average liquidity over the selected period
- Rising line → liquidity improving (more participants, easier trading)
- Falling line → liquidity decreasing (thinner market, caution advised)
• Info Table (top-right corner)
- Displays current raw liquidity, SMA value, and status ("High Liquidity" / "Low Liquidity")
- Updates in real-time on the last bar
• Zero Line (dotted gray)
- Visual reference — everything above zero is positive liquidity
4. Practical Trading Applications
• High Liquidity Zones (green bars + rising SMA)
- Favorable conditions for entering or scaling into positions
- Lower expected slippage
- Better for large orders
• Low Liquidity Zones (red bars + falling SMA)
- Higher risk of slippage and exaggerated price moves
- Consider smaller position sizes or waiting for better conditions
- Common during session opens/closes, holidays, or low-volume periods
• Crossovers
- Liquidity crossing above SMA → potential increase in market participation
- Liquidity crossing below SMA → potential drying up of interest
5. Setting Up Alerts
1. Right-click on the chart → "Add Alert"
2. In "Condition", select "Asset Liquidity Meter v6"
3. Choose one of the available alert conditions:
- Liquidity ↑ Crosses Above SMA
- Liquidity ↓ Crosses Below SMA
- Very High Liquidity (2× SMA)
- Very Low Liquidity (<30% SMA)
4. Set frequency (Once Per Bar Close is usually best)
5. Configure notification (email, popup, sound, webhook, etc.)
6. Create the alert
6. Tips for Best Results
• Works on all markets: stocks, forex, crypto, futures, indices
• Best on timeframes with meaningful volume data (5 min and higher usually give clearest signals)
• Compare liquidity across different assets or timeframes using multiple charts
• Combine with support/resistance, volume profile or order flow tools for confirmation
• Not a standalone signal — use in context with your overall strategy
Limitations & Notes
• This is an estimation based on OHLCV data — it does not show real order book depth
• Results vary significantly between centralized exchanges, brokers and instruments
• Zero-volume bars will show zero liquidity (expected behavior)
Enjoy safer and more informed trading!
Questions or suggestions? Feel free to comment below.
Forex-trading

Session AnchorsDescription
This indicator highlights the four main global trading sessions — London, New York AM, New York PM, and Asia — as color-coded boxes on the chart. Each session is defined by fixed start/end times (New York time) and dynamically updates with the evolving high and low during that interval. This provides a clear view of how volatility and structure shift as trading activity passes from one region to another.
How to use
• Works on any timeframe.
• Toggle sessions on/off based on your trading hours.
• Observe price behavior as one session closes and another opens.
• Use session boxes as context for liquidity, volatility, and structure analysis.
Originality
This script delivers a clean, customizable visualization of global market hours and session ranges, avoiding extra overlays so traders can isolate session-based behavior without distraction.
⚠️ Disclaimer
This indicator does not generate signals. It provides a structural mapping of global sessions for contextual analysis only.


Session P4L SNIPERSsession separator only for the operation of the academy. by its time margin. added the asian range for a power of three

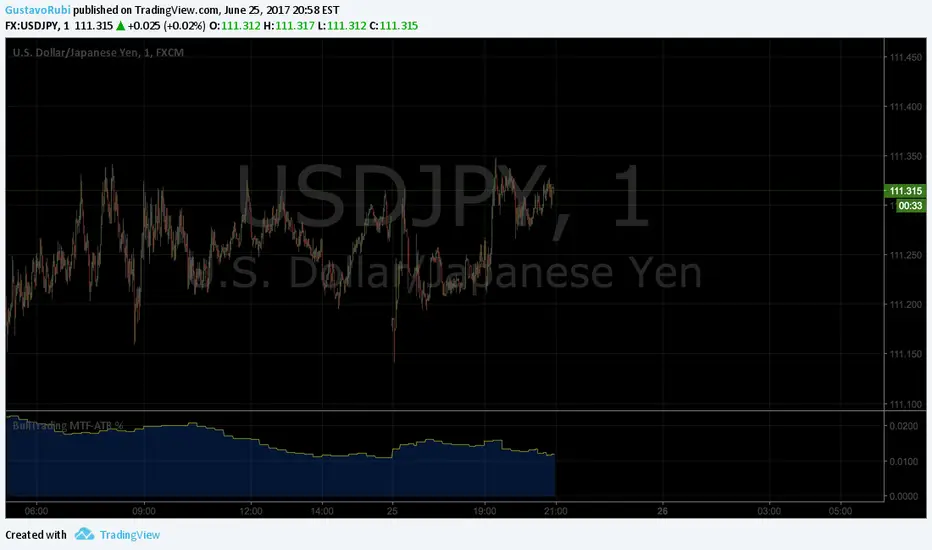
BullTrading MultiTimeFrame ATR %Good afternoon traders.
Have you ever got trapped on the middle of a consolidation? Well, it just happened to me trading the 1 minute chart last friday!
So, I coded this script to display a percentage of ATR for a given resolution.
Now, how can you benefit using this information?
For example:
Using the standard settings (resolution is calibrated 15 minutes in order to trade 1minute charts), just draw your prefered support and resistance. Then measure the number of pips between support and resistance. This number should be approximately the same the indicator is displaying. If the indicator is displaying a lower value, maybe it will be a good idea to tighten your support/resistance levels (if the price goes against you, you will have confidence and probability on your side to open an opposite position and reach your Take profit before a new reversal take place.
Change colors and resolution for your desired timeframe until you find your particular "sweet spot"
Have a nice trading week.