HOKO,PSPHOKO is a multifunctional chart-overlay designed to display clean market context and detect PSP (Price-Structure Projection) signals based on candle-body direction differences between the main symbol and two reference indices.
The indicator provides two core features:
1. Header Display (Symbol / Timeframe / Date / Mode System)
HOKO allows full customization of on-chart informational headers, including:
Symbol name
Timeframe (auto-formatted)
Indicator name (HOKO)
Date (Pretty or Numeric)
Multiple layout modes (6 total)
Adjustable text size, alignment, padding, row spacing, and screen position
Dynamic rendering using table objects
This creates a clean and professional display suitable for screenshots, analysis, and multi-chart layouts.
2. PSP Logic (Price Structure Projection)
The PSP engine compares the main chart’s candle direction to two reference symbols (default: ES1! and YM1!).
A violation occurs when the main candle is bullish while the reference candle is bearish, or vice-versa.
The script:
Calculates ATR-based dynamic marker offsets
Stores the last 3 bars
Detects Swing High PSP and Swing Low PSP based on a 3-candle swing structure
Confirms signals only if the middle candle contains a violation
Draws markers above/below the swing point with fully customizable shapes, colors, and sizes
Supports two symbols independently (Symbol 1 / Symbol 2)
Automatically deletes old labels based on a user-defined max-bar limit
This makes PSP easy to visualize and helps identify inflection points where internal weakness or strength appears before price shifts.
Key Features
Clean customizable chart header
Pretty or numeric date formats
Multiple layout modes (vertical or one-line display)
PSP detection from ES/YM divergence logic
Swing-based confirmation for higher-quality signals
Dynamic ATR offset for accurate visual spacing
Lightweight and optimized with automatic cleanup
Works on any market and any timeframe
Purpose
HOKO helps traders quickly understand market context while highlighting potential turning points caused by structural divergence between major indices. It is ideal for intraday traders using ICT-style logic, smart money concepts, or divergence-based confirmation models.
Fractales

Range Deviations PRO | Trade SymmetryRange Deviations PRO — Extended Session Levels
An enhanced version of the original Range Deviations by @joshuuu, retaining the full core logic while adding a key upgrade:
🔹 All session ranges, midlines, and deviation levels now extend into the next trading session, giving seamless multi-session context.
Supports Asia, CBDR, Flout, ONS, and Custom Sessions — with options for half/full standard deviations, equilibrium, and range boxes exactly as in the original.
Extending these levels helps identify:
• Liquidity sweeps
• Trap moves / false breaks
• Daily high/low projections
• Premium–discount behavior across sessions
Ideal for traders using ICT concepts who want clearer continuation of session structure into the next day.
Credit: Original logic by @joshuuu — enhancements by TradeSymmetry.
Disclaimer: Educational use only. Not financial advice.

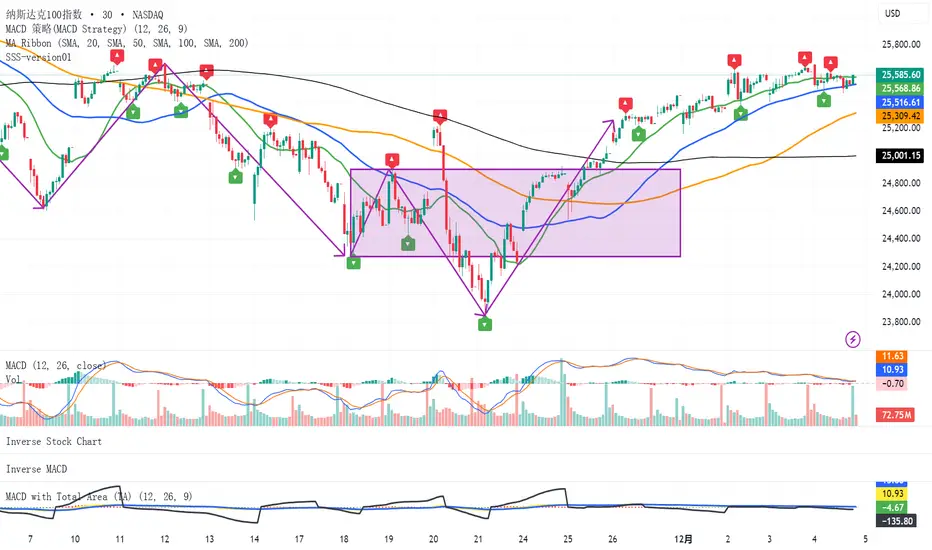
SSS-version01SSS(standard serialize system)
This indicator is designed to analyze market fluctuations and automatically mark the local highs and lows of each wave.
By tracking these key "twisting" points, the indicator provides a clear structural view of price movements, allowing users to visualize how each wave evolves within the broader trend.
Through overviewing the distribution of tops and bottoms, users can quickly recognize the underlying market direction and structure.
(While the signals may appear with a slight delay — as the formation of each wave requires confirmation — they provide a more reliable reflection of the completed market movement)
This is the initial release of the complete SSS indicator, focused on basic wave recognition and labeling.
Future updates will continuously refine the detection algorithm and introduce additional structural features, enabling a deeper and more detailed deconstruction of market behavior.
(QUANTLABS) Fractal God Mode: 25-Timeframe Scanner The indicator aggregates data into three distinct metric columns:
1. STRUCT (Market Structure) This analyzes price action relative to Fractal Pivots (Highs and Lows) to determine market direction.
HH (Breakout): Price has closed above the previous Pivot High. (Bullish Structure)
LL (Breakdown): Price has closed below the previous Pivot Low. (Bearish Structure)
TRAPPED: Price is trading between the last Pivot High and Low. This indicates a ranging market where trend trades should be avoided.
2. VELOCITY (Thrust) This measures the specific strength of the current candle on that timeframe.
The Math: It calculates the ratio of the body (Close - Open) relative to the total candle range (High - Low).
The Signal: High positive numbers (Green) indicate buyers are closing near highs. High negative numbers (Red) indicate sellers are dominating the range.
3. QUALITY (Efficiency Ratio) This acts as a "Noise Filter." It determines if the trend is moving in a straight line or whipping back and forth.
The Math: It divides the Net Price Movement (Distance from 5 bars ago) by the Total Path Traveled (Sum of the ranges of the last 5 bars).
PRISTINE (Values > 0.6): The market is moving efficiently in one direction.
CHOPPY (Values < 0.4): The market is volatile and non-directional (High Noise).
1. The Matrix (Dashboard) Located in the bottom right, this table gives you an instant read on Short-Term (3m-9m), Medium-Term (10m-45m), and Long-Term (1H-Daily) trends.
2. Coherence Flow At the bottom of the table, the script sums up the structural score of all 25 timeframes.
COHERENT BULL: When the Short, Medium, and Long terms align green.
COHERENT BEAR: When the Short, Medium, and Long terms align red.
3. God Mode (Global S/R) The indicator can plot Support and Resistance levels from higher timeframes onto your current chart. For example, while trading the 5m chart, you can see the 4H and Daily pivot levels plotted automatically as dotted lines, ensuring you never trade blindly into a higher-timeframe wall.
Trend Following: Wait for the "Coherent Bull/Bear" signal at the bottom of the dashboard. This confirms that momentum is aligned from the 3m chart up to the Daily.
Scalping: Focus on the Quality column. Only take trades when the Quality is "CLEAN" or "PRISTINE." Avoid entries when the dashboard warns of "High Noise" (Choppy).
Risk Management: If the dashboard shows "TRAPPED" on the Long Term (1H+), reduce position size or wait for a breakout.
Pivot Lookback: Adjusts the sensitivity of the Fractal Structure (Default: 5).
Show Fractal DNA Matrix: Toggles the dashboard table.
Show ALL Timeframe S/R: Enables "God Mode" to see supports/resistances from all 25 timeframes (Heavy visual processing, use carefully).

Macros+AMD [NW]Macros + AMD - Daily & Weekly Time-Based Analysis
Multi-timeframe AMD (Accumulation, Manipulation, Distribution) visualization with ICT Macro timing windows for time-based market analysis.
Overview
This indicator visualizes the AMD (Accumulation, Manipulation, Distribution) framework on both daily and weekly timeframes, combined with ICT Macro timing windows. It is designed as an educational tool to help traders study time-based market structure and algorithmic price delivery concepts.
The AMD model is based on the idea that markets move through distinct phases within each trading period:
Accumulation (A) - Initial range formation, liquidity building
Manipulation (M) - False moves to trap traders, liquidity sweeps
Distribution (D) - True directional move, price delivery to targets
What This Indicator Displays
Daily AMD Phases
Displays the intraday AMD cycle based on New York trading hours:
A Phase (Blue): 4:00 AM - 8:35 AM EST — Morning accumulation, Asian/London overlap
M Phase (Red): 8:35 AM - 11:25 AM EST — NY session manipulation, news events
D Phase (Green): 11:25 AM - 4:00 PM EST — Afternoon distribution and price delivery
Weekly AMD Phases
Displays the weekly AMD cycle from Monday to Monday:
A Phase: Monday 00:00 - Tuesday 21:56 EST — Weekly high/low formation begins
M Phase: Tuesday 21:56 - Thursday 02:04 EST — Mid-week reversal zone
D Phase: Thursday 02:04 - Monday 00:00 EST — Weekly price delivery
Inner M Phase Fibs
When enabled, subdivides the M (Manipulation) phase using Fibonacci levels:
0.382 level — Inner accumulation ends
0.500 level — Mid-point of manipulation
0.618 level — Inner distribution begins
This helps identify potential reversal points within the manipulation phase.
ICT Macro Windows
Horizontal lines marking the XX:42 to XX:15 macro periods (33-minute windows):
2:42 - 3:15 AM
3:42 - 4:15 AM (London)
7:42 - 8:15 AM
8:42 - 9:15 AM
9:42 - 10:15 AM (Prime AM session)
10:42 - 11:15 AM
11:42 - 12:15 PM
12:42 - 1:15 PM
1:42 - 2:15 PM
2:42 - 3:15 PM
These windows represent times when algorithmic price delivery is more likely to occur.
How To Use
Understanding the AMD Framework
During the A Phase:
Observe range formation and initial liquidity pools
Note the high and low established during this phase
Wait for manipulation before committing to direction
During the M Phase:
Watch for false breakouts and stop hunts
Look for reversal patterns after liquidity sweeps
The inner fibs (0.382, 0.5, 0.618) can help time entries within this phase
Mid-week (Wednesday) often sees key reversals on weekly AMD
During the D Phase:
This is typically when the true move occurs
Price tends to deliver toward draw on liquidity targets
The direction is often opposite to the manipulation move
Using the Macro Windows
The XX:42 to XX:15 windows are times to pay attention to price action:
These 33-minute periods often see increased algorithmic activity
Look for displacement, fair value gaps, or order blocks forming
The 9:42-10:15 AM window is considered particularly significant for NY session
Weekly Day Labels
Monday/Tuesday: "H/L of Week" — Watch for weekly high or low formation
Wednesday: "Reversal Day" — Mid-week reversal probability increases
Thursday/Friday: "Reversal Day" — Continuation or secondary reversal
Settings Guide
Main Settings
Timezone: Set to your broker's timezone or preferred timezone
Macros On Top: Toggle macro lines above or below AMD boxes
Show All Text Labels: Master toggle for all text (turn off for clean charts on HTF)
Daily/Weekly AMD
Show: Enable/disable the AMD visualization
Opacity: Adjust transparency of the phase boxes (higher = more transparent)
AMD Colors
Customize colors for each phase (A, M, D)
Default: Blue (A), Red (M), Green (D)
Inner M Style
Customize the inner M phase fib lines and text colors
Default: Black lines for clean visibility
Macro Settings
Adjust macro line color and thickness
Toggle individual macro windows on/off
Important Notes
This indicator is for educational purposes and time-based analysis
It does not provide buy/sell signals
Always use in conjunction with proper price action analysis
Past price behavior during these time windows does not guarantee future results
The AMD framework is one lens for viewing market structure — use it as part of a complete methodology
Credits
This indicator is based on concepts taught by ICT (Inner Circle Trader) and the broader Smart Money Concepts community. The AMD framework, macro timing windows, and weekly profile concepts are derived from this educational methodology.
Timeframe Recommendations
Best viewed on 1-minute to 15-minute charts
Text labels automatically hide on 9-minute and higher timeframes for cleaner visualization
Indicator hides completely on 1-hour and higher timeframes
Changelog
v1.0 - Initial release
Daily AMD phases (4am-4pm EST)
Weekly AMD phases (Monday-Monday)
Inner M phase Fibonacci subdivisions
10 ICT Macro timing windows
Full customization options
Automatic 9-day cleanup

CISD & Projections BossThis is a CISD (Change in State of Delivery) indicator with Fibonacci-style projections. Here's what it does:
Core Functionality
1. Pivot Detection
Uses Williams Fractal logic to identify swing highs and lows based on your specified pivot strength
Can use either candle bodies or wicks for calculations
2. CISD Detection
The indicator identifies "Change in State of Delivery" moments - institutional trading concept where:
For bullish CISD (CISD+): Finds a swing low, then looks backward to identify the preceding series of bearish candles. When price breaks above this bearish series, it marks a CISD+ (change from bearish to bullish delivery)
For bearish CISD (CISD-): Finds a swing high, then looks backward to identify the preceding series of bullish candles. When price breaks below this bullish series, it marks a CISD- (change from bullish to bearish delivery)
The CISD line is drawn from the start of the series to the breakout point at the series extreme (high for bullish, low for bearish).
3. Range Projections
Once a CISD is confirmed, the indicator:
Calculates the range of the broken series (high - low)
Projects multiples of that range as potential targets
Default levels are 1x, 1.5x, 2x, 2.5x, 3x, and 4x the series range
Bullish projections extend upward from the CISD+ line
Bearish projections extend downward from the CISD- line
Visual Elements
CISD lines (thick lines in blue for bullish, red for bearish)
Projection levels (thinner horizontal lines extending from the breakout point)
Labels showing the multiplier for each projection level
Optional pivot shapes to mark swing points
This is essentially tracking institutional "order flow changes" and projecting measured moves based on the size of the broken delivery pattern - very much in line with ICT (Inner Circle Trader) concepts.

Tomie Tèo EMA 9 / 21EMA 9 / 21 Crossover momentum Signal. If retest happens after Crossover show obvious correlation with crossover => Enter

Chandelier Exit + Pivots + MA + Swing High/LowIt combines four indicators.
For use in the Hero course.

KVS-Ultimate FVG & iFVG System [MTF + Distance Filter]Description: This indicator identifies Fair Value Gaps (FVG) and Inversion FVGs (iFVG) across multiple timeframes (MTF) with an advanced visualization system. Unlike standard FVG indicators, this script solves the "chart clutter" problem with a unique Distance Filter and offers a customizable Split Label System.
Key Features:
1. Unique Distance Filter (Clean Screen Mode):
When enabled, the script only shows the closest FVGs to the current price within a user-defined limit.
Keeps your chart clean while focusing on relevant price action levels.
2. Split Label System (Tabular Design):
Completely customizable label positioning, sizing, and coloring.
Separate controls for Normal FVGs and iFVGs.
Smart Label Logic: If you hide the FVG box, its label automatically hides. If an FVG breaks and becomes an iFVG (or fades), the label logic switches automatically to the iFVG settings.
3. Strict Mode Filtering:
Enabled: Checks if the candle closing price effectively breaks the previous structure (High/Low of the 1st candle), ensuring high-quality gaps.
Disabled: Detects all gaps between wicks (Standard calculation).
4. Multi-Timeframe (MTF) Support:
Monitor FVGs from up to 5 different timeframes simultaneously on a single chart.
5. Dynamic Interaction:
Choose how the script reacts when an FVG is broken: Turn it into an iFVG (Inversion) or simply fade the color (Ghost/Fade mode).
How to Use:
Use the "Distance Filter" checkbox in settings to clean up old/far blocks.
Adjust "TF1" to "TF5" to set up your multi-timeframe analysis.
Customize the Label Panel to align text perfectly with your chart style.
Disclaimer: This tool is for educational purposes and support for technical analysis.

All-in-One (PHT)All-in-One (PHT) — Modular Multi-Tool Market Analyzer (Pine Script v6)
All-in-One (PHT) is a complete, modular market-analysis toolkit designed for traders who want clean, reliable, and professional-grade charting - in a single indicator.
Built using Pine Script® v6 and structured with reusable PHT-Libraries (EMA Band, Bollinger Band, Fractal, Session), this indicator delivers clarity, precision, and consistent performance across all markets and timeframes.
Unlike traditional indicators that mix logic and visuals, AIO (PHT) uses a fully modular architecture. All calculations come from dedicated libraries, and this main script focuses purely on visual output and clean plotting.
This ensures:
Stable plot references
Zero repainting in all included modules
High performance even with complex overlays
Easy extensibility for future upgrades
🔥 Included Modules
1. EMA Band (PHT Library)
A triple-EMA band designed for trend clarity and structure.
Provides:
EMA of High
EMA of Close
EMA of Low
Band fill visualization
Ideal for identifying trend strength, momentum pockets, and mean-reversion zones.
2. Bollinger Band Suite
A complete Bollinger framework with:
SMA / EMA / WMA midline options
Dual standard-deviation envelopes
Multi-zone band fills (upper, middle, lower)
User-controlled visibility for each layer
Perfect for volatility detection, squeeze identification, and precision envelope trading.
3. Fractal Engine (High/Low Pivots)
Fast, reliable fractal detection using user-defined left/right periods.
Features:
Pivot Highs & Pivot Lows
Multiple marker sizes (Tiny → Large)
Zero-lag plotting with proper offset handling
Useful for swing structure, breakout confirmation, and automated level marking.
4. Market Session Tracker
A powerful session-mapping module that visually highlights market sessions with:
Dynamic session boxes
High & Low markers
Persistent historical sessions
Auto-managed labels, lines, and live updates
Timezone-aware session boundaries (supports IANA zones)
Designed for identifying daily ranges, session liquidity, volatility pockets, and market timing.
🧠 Why This Indicator Is Different
Most “all-in-one” tools mix plotting, logic, and calculations in a single heavy script, causing lag, reference instability, and repainting issues.
All-in-One (PHT) solves this by using a Pine v6 library architecture:
Each component is computed in its own library
The main script handles only visuals
No hidden code, no repainting tricks
Maximum clarity and maintainability
This design mirrors professional software architecture:
clear separation of logic, visuals, and user interface.
🎯 Ideal For
Trend traders
Scalpers & intraday traders
Swing and positional traders
Volatility analysts
Structure-based price action traders
Anyone who wants multiple high-quality tools in one clean indicator
Whether you analyze markets manually or build algorithmic systems, AIO (PHT) provides a solid foundation.
⚙️ Features at a Glance
Fully modular Pine v6 design
Complete EMA band engine
Advanced Bollinger band system (multi-deviation, multi-fill)
Configurable fractal high/low markers
Smart session boxing with history
Clean visuals and transparent settings
No repainting
Fully customizable colors & visibility
Optimized for performance
💡 How to Use
Choose the modules you want to display (EMA, BB, Fractals, Sessions).
Adjust lengths, deviations, or fractal periods as per your trading style.
Use session boxes to understand volatility timing.
Combine bands + fractals for advanced structure-based decisions.
The indicator is designed to overlay on price for maximum clarity.
🚀 Future Upgrades
The PHT framework supports smooth future expansion. Planned modules include:
ATR/volatility engines
Trend switches
Supertrend/Donchian plugins
Volume profile extensions
Updates will remain backward compatible across all modules.
⭐ Summary
All-in-One (PHT) is not just another overlay — it’s a complete multi-tool trading framework built using professional engineering practices in Pine Script v6.
If you want cleaner charts, smarter signals, and a high-performance modular system, this indicator gives you everything in one reliable package.

Aggressive VS Passive Orders Depletion @MaxMaserati 3.0Aggressive VS Passive Orders Depletion Indicator
Overview
This institutional-grade order flow analysis tool identifies and tracks limit order accumulation zones where significant buy and sell orders are placed in the market. It combines Highest Volume Candle Profile analysis with Market Structure detection to reveal where institutional traders have positioned their orders, and monitors in real-time whether these orders are being absorbed (depleted) or defended.
Core Concept: Order Block Detection & Depletion
This tool tracks the actual limit orders at key price levels and shows you:
Where institutional orders are placed (Buy Order Blocks vs Sell Order Blocks)
How strong these order zones are (original volume strength as %)
Real-time order flow activity (aggressive buyers vs aggressive sellers)
Depletion status (are the orders being consumed or defended?)
How It Works: Dual-Engine System
Engine 1: Volume Profile Analysis - Point of Control (POC) Detection
Divides price range into 25 horizontal levels (configurable)
Analyzes the last 120 bars (configurable lookback)
Distributes volume across price levels based on where each bar traded
Identifies the Point of Control (POC) - the price level with highest traded volume
Determines market bias: Bullish if price above POC, Bearish if below
Purpose: Shows where the majority of volume has been traded, indicating institutional accumulation zones and fair value areas.
Engine 2: Market Structure Analysis (PHL - Pivot High/Low)
Uses fractal pivot detection (configurable strength)
Identifies swing highs and lows that create market structure
Tracks Break of Structure (BOS) - price breaks recent swing in trend direction
Tracks Market Structure Shift (MSS) - price breaks swing points against trend
Maintains a trailing price at the most recent significant swing point
Purpose: Identifies where smart money is likely defending key structural levels with limit orders.
Key Innovation #1: Dynamic Confluence Zone Detection
When the Volume Profile POC and Market Structure trail price align within a configurable sensitivity threshold (default 1.0%), the indicator creates an Order Block Zone.
The Algorithm:
Monitors both engines continuously
Creates zones ONLY when POC is within X% of the structural swing point
Both engines must agree on the significance of the price level
Optional volume confirmation filter
This dual-confirmation approach filters out weak levels and highlights only the highest-probability zones where institutional orders are likely clustered.
Zone Types:
🟢 Buy Order Blocks (Support) - Created when confluence occurs with price above the zone. Represents accumulated buy limit orders waiting to support price.
🔴 Sell Order Blocks (Resistance) - Created when confluence occurs with price below the zone. Represents accumulated sell limit orders waiting to resist price.
Key Innovation #2: Real-Time Aggressive VS Passive Order Flow Analysis
The indicator performs sophisticated order flow decomposition on each candle that interacts with a zone, separating market activity into distinct categories:
Order Flow Categories:
1. Aggressive Orders - Market orders that consume liquidity
Aggressive Buy Volume: Market buys hitting sell limits (taking offers)
Aggressive Sell Volume: Market sells hitting buy limits (hitting bids)
Marked with (AGG) label when detected
Indicates urgent traders willing to pay the spread
2. Passive Orders - Limit orders adding liquidity
Passive Buy Volume: New buy limits being placed (making bids)
Passive Sell Volume: New sell limits being placed (making offers)
Shows patient traders providing liquidity
3. New Order Flow - Fresh buying/selling pressure
New Buyers: Total new buying activity (aggressive + passive)
New Sellers: Total new selling activity (aggressive + passive)
Net pressure indicator for zone health
Key Innovation #3: Advanced Order Flow Decomposition Algorithm
The indicator uses a proprietary candle analysis formula to separate aggressive from passive orders based on two key metrics:
Key Metrics:
Body Strength = |Close - Open| / (High - Low)
Close Position = (Close - Low) / (High - Low)
Bullish Candle Analysis:
Strong Aggressive Buying (Close Position ≥ 0.8 AND Body Strength ≥ 0.7):
90% aggressive buying, 10% passive selling, 90% new buyers
Moderate Aggressive Buying (Close Position ≥ 0.6 AND Body Strength ≥ 0.5):
70% aggressive buying, 20% passive selling, 80% new buyers, 20% new sellers
Weak Bullish (Close Position ≥ 0.5):
0-30% aggressive buying, 20-30% passive selling, 60% new buyers, 40% new sellers
Very Weak Bullish (Close Position < 0.5):
0% aggressive buying, 40% passive selling, 40% new buyers, 60% new sellers
Bearish Candle Analysis:
Strong Aggressive Selling (Close Position ≤ 0.2 AND Body Strength ≥ 0.7):
90% aggressive selling, 10% passive buying, 90% new sellers
Moderate Aggressive Selling (Close Position ≤ 0.4 AND Body Strength ≥ 0.5):
70% aggressive selling, 20% passive buying, 80% new sellers, 20% new buyers
Weak Bearish (Close Position ≤ 0.5):
0-30% aggressive selling, 20-30% passive buying, 60% new sellers, 40% new buyers
Very Weak Bearish (Close Position > 0.5):
0% aggressive selling, 40% passive buying, 40% new sellers, 60% new buyers
What This Reveals:
High close position + strong body = Aggressive buying overwhelming sellers
Low close position + strong body = Aggressive selling overwhelming buyers
Mid-range close = Battle between buyers and sellers
Small body = Passive orders dominating (limit orders being placed, not filled)
Key Innovation #4: Dynamic Depletion System with Intelligent Thresholds
The indicator adapts depletion thresholds based on zone strength:
High Liquidity Zones (>300% volume strength):
Depletion at 40% consumption - Massive clusters considered broken early because partial depletion indicates institutional withdrawal
Medium Liquidity Zones (150-300% volume strength):
Depletion at 60% consumption - Standard institutional behavior, majority must be consumed
Normal Liquidity Zones (75-150% volume strength):
Depletion at 80% consumption - Retail and smaller institutional zones need near-complete absorption
Low Liquidity Zones (<75% volume strength):
Depletion at 100% consumption - Weak zones must be fully absorbed before marked depleted
Why This Matters:
Strong zones failing early = powerful reversal signal (institutions gave up)
Weak zones holding = hidden strength (more orders being added)
Adaptive logic prevents false signals from fixed thresholds
Depletion Formula:
For Buy Order Zones:
Zone Liquidity % = (Original Buy Volume / Average Volume) × 100
Consumed % = (Sell Volume Absorbed / Average Volume) × 100
If Consumed Volume > Dynamic Threshold → Zone DEPLETED
For Sell Order Zones:
Zone Liquidity % = (Original Sell Volume / Average Volume) × 100
Consumed % = (Buy Volume Absorbed / Average Volume) × 100
If Consumed Volume > Dynamic Threshold → Zone DEPLETED
Key Innovation #5: Absorption Detection & Battle Analysis
The indicator identifies when one side is overwhelming the other using a configurable Absorption Threshold (default 1.5x = 50% more volume).
Battle States for Buy Order Blocks:
New Buyers Dominating (New Buyers > New Sellers × 1.5):
Label: ↑ New Buyers: +X% - Buy orders successfully defended
Sellers Attacking (New Sellers > New Buyers × 1.5):
Label: ↓ Sellers Attack: +X% (AGG) - Sell orders overwhelming the zone
Active Battle (Both active, <1.5x ratio):
Label: Battle: B+X% vs S+Y% - Active two-way order flow
Quiet Zone (Minimal activity):
Label: ↔ Quiet: X% - Zone untested or ignored
Battle States for Sell Order Blocks:
New Sellers Dominating (New Sellers > New Buyers × 1.5):
Label: ↓ New Sellers: +X% - Sell orders successfully defended
Buyers Absorbing (New Buyers > New Sellers × 1.5):
Label: ↑ Buyers Absorb: +X% (AGG) - Buy orders overwhelming the zone
Active Battle (Both active, <1.5x ratio):
Label: Battle: S+X% vs B+Y% - Active two-way order flow
Quiet Zone (Minimal activity):
Label: ↔ Quiet: X% - Zone untested or ignored
The (AGG) Marker:
Appears when aggressive market orders are detected (high body strength + extreme close position). Indicates institutional-sized urgency—someone is willing to pay market price NOW. Often precedes breakouts or strong continuations.
Label System Explained
No Label = Untested Zone
When a zone is first created, you see ONLY the colored box with NO label. This means:
Price has NOT yet reached this order block
The limit orders are still pending/resting
The zone is a future area of interest
Labels only appear after first price contact
Label Format (After First Touch):
Line 1: ● XX% Order Type
Line 2: Flow Analysis
Example Labels:
Buy Order Blocks:
● 150% Buy Orders + ↑ New Buyers: +85%
● 150% Buy Orders + ↑ New Buyers: +120% (AGG)
● 150% Buy Orders + Battle: B+45% vs S+38%
● 150% Buy Orders + ↓ Sellers Attack: +95% (AGG)
● 150% Buy Orders + ↓ Sellers Attack: +95% (AGG)
● 150% Buy Orders
Sell Order Blocks:
● 200% Sell Orders + ↓ New Sellers: +110%
● 200% Sell Orders + ↓ New Sellers: +140% (AGG)
● 200% Sell Orders + Battle: S+62% vs B+41%
● 200% Sell Orders + ↑ Buyers Absorb: +88% (AGG)
● 200% Sell Orders + ↑ Buyers Absorb: +88% (AGG)
● 200% Sell Orders
Status Indicators:
- Price penetrated through the zone
- Orders fully consumed, zone exhausted
Gray color - Zone no longer active
Directional Arrows:
↑ - Upward pressure (buyers stronger)
↓ - Downward pressure (sellers stronger)
↔ - Balanced/quiet (low activity)
↗ / ↘ - Mixed battle with bias
Point of Control (POC) Sub-Level Analysis
Each order block contains advanced volume distribution tracking:
Multi-Level Analysis (default 5 levels): Zones subdivided into horizontal price levels
Volume Distribution: Every candle's volume distributed across sub-levels based on price overlap
Buy/Sell Separation: Each level tracks buy vs sell volume independently
Dynamic POC Line: Marks the price level with highest traded volume within the zone
Real-Time Updates: POC adjusts as new volume enters, showing where "fairest price" is migrating
Style Options: Solid, Dashed, or Dotted lines (configurable width 1-5)
POC Trading Significance:
Represents the most accepted price within the order block
Often the best entry price for limit orders (highest liquidity)
POC migration shows whether zone is being "worked higher" or "worked lower"
Breaking through POC often signals zone failure
Key Settings
Volume Profile:
Lookback Period: 120 bars (historical period for POC)
Price Rows: 25 levels (granularity of volume distribution)
Volume Confirmation: Require structure breaks to align with volume bias
Market Structure:
Pivot Strength: 1 (swing detection sensitivity)
Show Trail: Optional trailing price visualization
Confluence Detection:
Sensitivity: 1.0% (distance threshold for POC/Structure alignment)
Lower = Stricter confluence, fewer zones
Higher = More zones detected
Order Flow Analysis:
Show Real-Time Order Flow: Live buyer/seller activity
Show Aggressive Markers: (AGG) labels for market orders
Show Directional Arrows: Price direction indicators (↑↓↔↗↘)
Absorption Threshold: 1.5x (when one side overwhelms the other)
1.5 = 50% more volume needed
2.0 = 100% more (stricter)
1.2 = 20% more (more sensitive)
Visual Options:
Hide Depleted Zones: Auto-remove exhausted blocks
Smart Bar Coloring: Color candles based on signal alignment
Zone Colors: Customize buy/sell colors
Label Text Size: Tiny, Small, Normal, Large
POC Settings:
Show POC Lines: Toggle Point of Control display
POC Analysis Levels: 3-10 levels
Line Width: 1-5 pixels
Line Style: Solid, Dashed, or Dotted
Trading Applications
1. Institutional Order Detection - Identify where large players positioned limit orders using Volume Profile POC + Market Structure confluence
2. Support/Resistance Validation - Dual confirmation filters weak levels, highlights high-probability reversal areas
3. Order Flow Imbalance Trading - Trade in direction of aggressive flow using (AGG) markers, fade zones showing absorption
4. Breakout/Breakdown Confirmation - and statuses validate moves through key levels
5. Liquidity Hunting - Track stop-loss clusters, anticipate stop runs based on depletion patterns
6. Entry Refinement - Use POC lines for precise limit placement at "fairest price" within zones
Combined Signal System
HVN Volume Profile × Market Structure Signals:
STRONG BUY: Both engines bullish + structure break up + volume confirmation
BUY: Bullish bias with partial confirmation
WEAK BUY: Early bullish signals
STRONG SELL: Both engines bearish + structure break down + volume confirmation
SELL: Bearish bias with partial confirmation
WEAK SELL: Early bearish signals
Alert Conditions:
Strong Buy/Sell signals (with volume confirmation)
Confluence zone activation (new order block created)
Order block depletion (zone exhausted)
What Makes This Indicator Unique
Industry-Standard Foundation:
Volume Profile POC detection + Market Structure analysis (swing pivots, BOS/MSS) + Point of Control tracking
Unique Innovations:
Dynamic Confluence Algorithm + Aggressive vs Passive Order Flow Decomposition + Adaptive Depletion Thresholds + Real-Time Absorption Detection + Battle Analysis with (AGG) markers + Complete Unified Methodology
Technical Excellence:
Resource-optimized (max 50 zones), comprehensive safety checks, multi-tier labeling, flexible customization
Best Practices
Wait for first touch - No label = untested zone
Watch (AGG) markers - Institutional urgency signal
Trust adaptive depletion - Strong zones failing early = major reversal
Use POC for entries - Best price within zone
Combine higher timeframes - Daily/4H zones strongest
Respect zones - Failed support becomes resistance
Follow battle labels - Contested areas show stop clusters
Adjust sensitivity - Tight ranges = lower %, trending = higher %
Performance Notes
Maximum Active Zones: 50 (automatic cleanup)
Maximum Lines: 400 (POC managed dynamically)
Lookback Cap: 1000 bars for optimization
Updates: All calculations on bar close for confirmed signals

XAUUSD 9/1 and 6/4 zone lane chart (BUY zone and SELL zone)XAUUSD 9/1 and 6/4 zone lane chart (BUY zone and SELL zone)

Quarterly Theory IndicatorQuarterly Theory Indicator (from Daye's Theory)
Functionalities:
1) Monthly Quarterly Cycles (division with vertical lines) & the latest Monthly True Open- only visible in the weekly TF (horizontal line).
2) Weekly Quarterly Cycles (division with vertical lines) & the latest Weekly True Open (horizontal line).
3) Daily Quarterly Cycles (division with vertical lines) & the latest Daily True Open (horizontal line).
4) 90Min "Sessional" Quarterly Cycles (division with vertical lines) & the four 90Min cycle True Open lines of the latest day (horizontal lines).

Reversal 2 Bar + W%R🇺🇸 English Description
Reversal 2 Bar + W%R is a clean and powerful price-action indicator designed to detect momentum-based reversal signals by combining multi-bar structure with Williams %R exhaustion zones.
🔍 Core Logic
A reversal signal is triggered when:
Bullish Reversal
The current candle closes above the highest price of the previous 2 candles,
AND Williams %R entered Oversold (≤ OS level) within the last N bars (user-defined window).
Bearish Reversal
The current candle closes below the lowest price of the previous 2 candles,
AND Williams %R entered Overbought (≥ OB level) within the last N bars.
This approach captures real momentum shifts rather than simple wick touches and gives “credit” to signals shortly after the market hits OB/OS zones — ideal for traders who want price-action confirmation after exhaustion.
🎯 Why It Works
Confirms trend exhaustion using W%R OB/OS
Confirms breakout strength using 2-Bar structure
Avoids weak signals by requiring close-based confirmation
The user-defined window (5–10 bars) allows flexibility for different volatility environments
📈 What You Get
Clear bullish/bearish reversal markers (REV↑ / REV↓)
Auto-colored candles for quick trend bias
Optional W%R filtering
Alerts for automated trading or notifications
This indicator is ideal for scalpers, day traders, and swing traders who rely on clean PA signals + strong exhaustion confirmation.
============================================================================
🇹🇭 คำอธิบายภาษาไทย
Reversal 2 Bar + W%R คืออินดิเคเตอร์ Price Action แบบเรียบง่ายแต่ทรงพลัง ที่ออกแบบมาเพื่อหา “สัญญาณกลับตัวที่มีโมเมนตัมจริง” โดยใช้โครงสร้างแท่งเทียน 2 แท่งร่วมกับโซน Overbought/Oversold ของ Williams %R
🔍 หลักการทำงาน
อินดิเคเตอร์จะให้สัญญาณกลับตัวเมื่อ:
ขาขึ้น (Bullish Reversal)
แท่งปัจจุบัน ปิดสูงกว่า high ของ 2 แท่งก่อนหน้า
และ Williams %R เคยเข้าโซน Oversold ภายในช่วง N แท่งล่าสุด (ตั้งค่าได้)
ขาลง (Bearish Reversal)
แท่งปัจจุบัน ปิดต่ำกว่า low ของ 2 แท่งก่อนหน้า
และ Williams %R เคยเข้าโซน Overbought ภายในช่วง N แท่งล่าสุด
วิธีนี้ทำให้สัญญาณกลับตัว “มีความหมาย” กว่าแค่โดนไส้แทง เพราะใช้การปิดทะลุระดับราคา พร้อมยืนยันว่าโมเมนตัมฝั่งตรงข้ามเริ่มหมดแรงจากการเข้าโซน OB/OS แล้ว
🎯 จุดเด่น
ใช้ W%R ช่วยยืนยันว่าเกิด “ภาวะหมดแรง” จริง
ใช้โครงสร้าง 2 Bar เพื่อยืนยัน “การเบรกโครงสร้าง”
เน้นสัญญาณคุณภาพสูงด้วยเงื่อนไข close-based
มีหน้าต่างให้เครดิต 5–10 แท่งหลังเข้าโซน เพื่อไม่ให้สัญญาณกลับตัวหลุดโอกาส
📈 สิ่งที่อินดี้แสดงให้คุณ
จุดกลับตัว REV↑ / REV↓ ชัดเจน
ระบายสีแท่งเพื่อบอก bias
แจ้งเตือน (Alert) ตั้งค่าได้
เลือกเปิด/ปิดการใช้ W%R filter ได้
เหมาะกับเทรดเดอร์ทุกรูปแบบที่ต้องการสัญญาณกลับตัวที่แม่นยำ เข้าใจง่าย และไม่รกจอ

Zonas de Liquidez Pro + Puntos de GiroRequirements for marking 💧:✅ High crosses the zone✅ Close returns inside (false breakout / fakeout)✅ Volume is 20% greater than the average✅ Occurs within the last 10 bars(Note: This last requirement is stated in the text but not explicitly in the code snippet provided)📚 Psychology Behind the SweepWho lost money?Traders with stops placed too tightlyBuyers who entered "on the breakout"Bots with automatic orders placed aboveWho made money?Smart Money / InstitutionsThey sold at a high priceThey hunted for liquidity before moving the priceThey know where retail stops are located🎯 How to Use the Drops in Your TradingGolden Rule:💧 near a strong zone + Multiple rejections = PROBABLE REVERSALStrategy:See 💧 at resistance → Look for SHORTSee 💧 at support → Look for LONGPrice returns to the swept zone → High-probability setupStop beyond the sweep high/low → ProtectionPractical Example:If you see 💧 LIQ at $111,263 (resistance)→ Wait for bearish rejection→ Entry: Sell at $110,800→ Stop: $111,500 (above the sweep high)→ Target: Next support level⚠️ Common Mistakes❌ Mistake 1: Trading the breakoutPrice breaks $111k → "It's going to the moon!" → Buy💧 LIQ appears → It was a trap → Drop → Loss✅ Correct Approach:Price breaks $111k → Check if there is 💧 LIQ💧 appears → "It's a trap" → Wait for rejection → Sell❌ Mistake 2: Ignoring the volumeNot all sweeps are equal.Sweeps with high volume are more reliable.No volume = it could be noise.🎓 Ultra-Fast SummaryElementMeaning💧 LIQLiquidity sweep detectedAt ResistanceBullish trap → Prepare for a shortAt SupportBearish trap → Prepare for a longWith High VolumeMore reliable signalNear Strong Zone High probability of reversal🔥 The Magic of Your IndicatorScenarioWithout this IndicatorWith this IndicatorAction"The price broke $111k, I'm buying!""There is 💧 LIQ + zone + rejections → It's a trap."ResultYou loseYou avoid a loss or gain on the short

HT Sentinel MatrixHT Sentinel Matrix is a HTF liquidity architecture — a sentry that projects the intent of the larger range directly into your execution window.
Instead of guessing where price might be reaching for, the Sentinel Matrix turns the chart into a multi-layered grid of dealing ranges, prior ranges, and refined premium/discount arrays, so you can read context, not candles.
Core Idea
The tool revolves around one premise:
Intraday precision comes from HTF truth.
HT Sentinel Matrix fuses HTF PO3 candles, composite Dealing Ranges (DR), Prior Candles Range (PCR), and a refined Fib matrix into a single, coherent framework you can trade from without clutter.
1. HTF PO3 Candles – The Structural Spine
The HTF PO3 engine builds a stack of HTF candles and projects them to the right of current price:
Automatic timeframe selection relative to your chart (or manual override).
True HTF or Heikin Ashi representation for structural clarity.
Projection of open, high, low, and PO3 data with optional OHLC labels.
Adjustable size, margin, colors, and offset for a minimal yet elegant visual.
This creates a visible structural spine of the dealing range you’re actually trading inside, rather than reacting to noise on your lower timeframe.
2. DR Mode – Composite Dealing Range Engine
Tracks completed HTF candles and the active developing one as well.
Automatically computes DR High, DR Low, DR EQ, DR 25%, and DR 75%.
Optionally extends HTF opens, treating them as structural points of interest.
Projects all levels forward with clean, consistent padding.
The result is a living DR framework that reveals where the true range is being negotiated and which portions are being repriced or accumulated.
3. PCR Mode – Prior Candles Range
Builds a single or stack of prior HTF ranges (PCR1, PCR2, PCR3, etc.).
Plots PH, PL, PEQ with optional 25% and 75% liquidity bands.
Automatically renames and organizes each PCR for clarity.
Shows how current price is interacting with previous HTF footprints.
This gives a true multi-session context showing reclaim, rejection, continuation, or distribution against prior HTF ranges.
4. DR/FIB + PCR – Project a Multi-HTF Liquidity Grid
Up to four HTF ranges plotted simultaneously.
Each HTF range displays PH, PL, PEQ, and optional 25%/75% bands.
Creates a stacked liquidity ladder across multiple HTFs.
This mode highlights multi-timeframe confluence, where DR structure, PCR footprints, and HTF ranges align.
5. FIB Mode – Refined Premium/Discount Matrix
Anchored to the composite HTF range.
Plots unique Fib levels.
Full control over visibility, style, and labeling.
A more precise alternative to generic Fibonacci tools, giving nuanced liquidity brackets for entries, partials, and reversals.
Conceptual Use
HT Sentinel Matrix is not a signal generator — it is an execution environment for traders who think in terms of:
Dealing Ranges, not isolated candles.
Liquidity bands, not random lines.
Multi-timeframe alignment, not single-frame bias.
Use HTF PO3 + DR/FIB to define the larger dealing range, stack PCR to understand HTF footprints, and execute your own model within these structural boundaries.
Disclaimer
This is an analytical tool for educational purposes only. It does not provide signals, financial advice, or guaranteed outcomes. Its edge lies in delivering clarity of context — the rest is your model, your discipline, and your execution.

STARKPROFITS SCALPER 2.0señales compra y venta..tendencia y estructura del mercado.se basa en tendencia

Valdex - Squeeze Momentum Indicator [MTF]📝 TradingView Publication Description (English)
SQM-MTF: Multi-Timeframe Squeeze Momentum Indicator (v6)
This is a powerful, multi-timeframe (MTF) version of the renowned Squeeze Momentum Indicator originally developed by LazyBear, completely updated for Pine Script v6.
This version allows traders to calculate the momentum and the Teeza Squeeze status from a higher or lower timeframe than the one currently displayed on the chart, providing superior context for entries and exits.
🚀 Key Features
Multi-Timeframe (MTF) Functionality: Use the "Timeframe del Indicador" setting to select a resolution (e.g., "60" for 1-hour or "240" for 4-hour) independent of your chart's resolution.
Momentum Area Plot: The default style is set to Area for better visual continuity, instead of the traditional histogram columns.
Original Color Logic: Uses the original four-color scheme to clearly identify momentum status and acceleration/deceleration:
Bright Green/Lime: Positive Momentum, Accelerating
Dark Green: Positive Momentum, Decelerating
Bright Red: Negative Momentum, Accelerating
Dark Red/Maroon: Negative Momentum, Decelerating
Optimized for V6: Code fully updated to Pine Script v6 syntax, including optimized request.security usage.
💡 How to Use
This indicator is typically used to identify periods of low volatility (the Squeeze) that signal a potential explosive move is imminent.
Use the MTF feature to:
Find the Squeeze: Check a higher timeframe (e.g., 4H) for the Squeeze status while executing trades on a lower timeframe (e.g., 1H or 15m).
Confirm Entry: Wait for the momentum bars to cross the zero line in the desired direction on the MTF indicator, confirming the start of the trend.
📋 Notas de Publicación (Para ti)
Cuando publiques, asegúrate de añadir las siguientes etiquetas (tags) para que sea fácil de encontrar:
Tags Sugeridas: SQUEEZE, MOMENTUM, MTF, MULTITIMEFRAME, SQUEEZEMOMENTUM, LAZYBEAR, VOLATILITY, PINEV6.
Source Code (Código Fuente): Siempre incluye el código Pine Script en la parte inferior de tu descripción en TradingView.

Fractals by KaraTradeFractals by KaraTrade
OVERVIEW
This indicator identifies fractal patterns on the chart, which are key reversal points in price action. Fractals help traders identify potential support and resistance levels, as well as trend reversal zones.
WHAT IS A FRACTAL?
A fractal is a pattern where a central candle's high or low is surrounded by lower highs or higher lows on both sides. Fractals indicate where the market has made a local extreme and potentially reversed direction.
FEATURES
5-Candle Fractals (Dark Gray X marks)
Stronger signals with strict pattern validation
Requires a clear sequence where each candle progressively moves toward the center and then away
Bearish fractal: high < high < high > high > high
Bullish fractal: low > low > low < low < low
The central candle must be the highest high (bearish) or lowest low (bullish)
Displayed with offset=-2 on the central candle
3-Candle Fractals (Light Gray Triangles)
Weaker signals for more frequent patterns
Simpler pattern: central candle must be higher or lower than both neighbors
Bearish fractal: high < high > high
Bullish fractal: low > low < low
Displayed with offset=-1 on the central candle
SETTINGS
Show 5-Candle Fractals: Toggle 5-candle fractal display
Show 3-Candle Fractals: Toggle 3-candle fractal display
HOW TO USE
Bearish Fractals (top): Potential resistance levels or sell zones
Bullish Fractals (bottom): Potential support levels or buy zones
Use in combination with other indicators for confirmation
5-candle fractals are more reliable but less frequent
3-candle fractals provide more signals but require additional confirmation
TECHNICAL DETAILS
Uses strict sequential logic (no equal values allowed)
Based on high/low prices (including wicks/shadows)
Displays with a delay for pattern confirmation
Compatible with all timeframes
Created by KaraTrade

Day of Week SeparatorThis indicator displays vertical lines to separate each day of the trading week, along with the optional 4hr separators. It also shows day-of-week labels (MON, TUE, etc.) at a specified hour for quick visual reference. Useful for intraday traders who want a clear view of daily and higher timeframe transitions.
Chop + MSS/FVG Retest (Ace v1.6) – IndicatorWhat this indicator does
Name: Chop + MSS/FVG Retest (Ace v1.6) – Indicator
This is an entry model helper, not just a BOS/MSS marker.
It looks for clean trend-side setups by combining:
MSS (Market Structure Shift) using swing highs/lows
3-bar ICT Fair Value Gaps (FVG)
First retest back into the FVG
A built-in chop / trend filter based on ATR and a moving average
When everything lines up, it plots:
L below the candle = Long candidate
S above the candle = Short candidate
You pair this with a higher-timeframe filter (like the Chop Meter 1H/30M/15M) to avoid pressing the button in garbage environments.
How it works (simple explanation)
Chop / Trend filter
Computes ATR and compares each bar’s range to ATR.
If the bar is small vs ATR → more likely CHOP.
If the bar is big vs ATR → more likely TREND.
Uses a moving average:
Above MA + TREND → trendLong zone
Below MA + TREND → trendShort zone
MSS (Market Structure Shift)
Uses swing highs/lows (left/right bars) to track the last significant high/low.
Bullish MSS: close breaks above last swing high with displacement.
Bearish MSS: close breaks below last swing low with displacement.
Those events are marked as tiny triangles (MSS up/down).
A MSS only stays “valid” for a certain number of bars (Bars after MSS allowed).
3-bar ICT FVG
Bullish FVG: low > high
→ gap between bar 3 high and bar 2 low.
Bearish FVG: high < low
→ gap between bar 3 low and bar 2 high.
The indicator stores the FVG boundaries (top/bottom).
Retest of FVG
Watches for price to trade back into that gap (first touch).
That retest is the “entry zone” after the MSS.
Final Long / Short condition
Long (L) prints when:
Recent bullish MSS
Bullish FVG has formed
Price retests the bullish FVG
Environment = trendLong (ATR + above MA)
Not CHOP
Short (S) prints when:
Recent bearish MSS
Bearish FVG has formed
Price retests the bearish FVG
Environment = trendShort (ATR + below MA)
Not CHOP
So the L/S markers are “model-approved entry candles”, not just any random BOS.
Inputs / Settings
Key inputs you’ll see:
ATR length (chop filter)
How many bars to use for ATR in the chop / trend filter.
Lower = more sensitive, twitchy
Higher = smoother, slower to change
Max chop ratio
If barRange / ATR is below this → treat as CHOP.
Min trend ratio
If barRange / ATR is above this → treat as TREND.
Hide MSS/BOS marks in CHOP?
ON = MSS triangles disappear when the bar is classified as CHOP
Keeps your chart cleaner in consolidation
Swing left / right bars
Controls how tight or wide the swing highs/lows are for MSS:
Smaller = more sensitive, more MSS points
Larger = fewer, more significant swings
Bars after MSS allowed
How many bars after a MSS the indicator will still allow FVG entries.
Small value (e.g. 10) = MSS must deliver quickly or it’s ignored.
Larger (e.g. 20) = MSS idea stays “in play” longer.
Visual RR (for info only)
Just for plotting relative risk-reward in your head.
This is not a strategy tester; it doesn’t manage positions.
What you see on the chart
Small green triangle up = Bullish MSS
Small red triangle down = Bearish MSS
“L” triangle below a bar = Long idea (MSS + FVG retest + trendLong + not chop)
“S” triangle above a bar = Short idea (MSS + FVG retest + trendShort + not chop)
Faint circle plots on price:
When the filter sees CHOP
When it sees Trend Long zone
When it sees Trend Short zone
You do not have to trade every L or S.
They’re there to show “this is where the model would have considered an entry.”
How to use it in your trading
1. Use it with a higher-timeframe filter
Best practice:
Use this with the Chop Meter 1H/30M/15M or some other HTF filter.
Only consider L/S when:
Chop Meter = TRADE / NORMAL, and
This indicator prints L or S in the right location (premium/discount, near OB/FVG, etc.)
If higher-timeframe says NO TRADE, you ignore all L/S.
2. Location > Signal
Treat L/S as confirmation, not the whole story.
For shorts (S):
Look for premium zones (previous highs, OBs, fair value ranges above mid).
Want purge / raid of liquidity + MSS down + bearish FVG retest → then S.
For longs (L):
Look for discount zones (previous lows, OBs/FVGs below mid).
Want stop raid / purge low + MSS up + bullish FVG retest → then L.
If you see L/S firing in the middle of a bigger range, that’s where you skip and let it go.
3. Instrument presets (example)
You can tune the ATR/chop settings per instrument:
MNQ (noisy, 1m chart):
ATR length: 21
Max chop ratio: 0.90
Min trend ratio: 1.40
Bars after MSS allowed: 10
GOLD (cleaner, 3m chart):
ATR length: 14
Max chop ratio: 0.80
Min trend ratio: 1.30
Bars after MSS allowed: 20
You can save those as presets in the TV settings for quick switching.
4. How to practice with it
Open replay on a couple of days.
Check Chop Meter → if NO TRADE, just observe.
When Chop Meter says TRADE:
Mark where L/S printed.
Ask:
Was this in premium/discount?
Was there SMT / purge on HTF?
Did the move actually deliver, or did it die?
Screenshot the A+ L/S and the ugly ones; refine:
ATR length
Chop / trend thresholds
MSS lookback
Your goal is to get it to where:
The L/S marks show up mostly in the same places your eye already likes,
and you ignore the rest.

Chop Meter + Trade Filter 1H/30M/15M (Ace PROFILE CLEAN v2)What this indicator does
Name: Chop Meter + Trade Filter 1H/30M/15M (Ace PROFILE CLEAN v2)
This is not an entry signal indicator. It’s a market condition filter:
It checks how compressed or expanded price is on
1H, 30M, and 15M.
It labels each TF as CHOP or NORMAL.
If 2 or more of those are in CHOP, it prints NO TRADE.
If 0 or 1 are in CHOP, it prints TRADE.
You use it to answer one question:
“Is this a session I should be pushing the button,
or is this a day to sit on my hands?”
How it works (simple version)
For each timeframe (1H, 30M, 15M), the script:
Looks back N bars (ATR length).
Measures:
ATR over N bars
Price range over N bars (highest high − lowest low)
Computes a compression value:
compression = ATR / range.
Then it compares that to the Threshold:
If compression > threshold → CHOP (market boxed / compressed)
If compression ≤ threshold → NORMAL (market expanded / trending)
Finally:
It counts how many TFs are CHOP.
If 2 or 3 TFs are CHOP → NO TRADE.
If 0 or 1 TFs are CHOP → TRADE.
Inputs / Profiles
At the top you see:
Profile
Overnight 4/0.40 – for Asia / London / overnight sessions
NYO 5/0.45 – for New York Open profile (default)
Custom – lets you type your own values
When Custom is selected, you can set:
ATR Length (Custom) – how many bars to use in the compression calc
Chop Threshold (ATR ÷ Range) (Custom) – where you cut between CHOP vs NORMAL
Higher threshold → more bars counted as NORMAL, less CHOP
Lower threshold → more bars counted as CHOP, fewer TRADE environments
For NYO, you normally keep:
Profile = NYO 5/0.45
(ATR over 5 bars, threshold 0.45)
What you see on the chart
A single line panel at the bottom-right, like:
1H: NORMAL | 30M: CHOP | 15M: NORMAL | TRADE | NYO 5/0.45
Meaning:
1H: NORMAL → the last 1H window is expanded enough (not boxed).
30M: CHOP → 30M is compressed (inside a tighter range).
15M: NORMAL → 15M has opened up.
TRADE → Only 1 TF is CHOP, so the majority says OK to trade.
NYO 5/0.45 → just a tag to remind which profile you’re using.
If instead you see:
1H: CHOP | 30M: CHOP | 15M: NORMAL | NO TRADE | NYO 5/0.45
That means:
1H and 30M are boxed
15M opened a bit, but 2 TFs are CHOP
Final verdict: NO TRADE environment
How to use it in your trading
1. As a gatekeeper before any entry model
No matter what entry you use (MSS + FVG, OB, purge setups, etc.):
If the panel says NO TRADE →
You do not open new positions.
You’re in “observe only” mode.
You can still study price, mark levels, and journal, but you’re not pressing the button.
If the panel says TRADE →
The environment is acceptable.
Now you can look for your entry model (e.g. MSS + FVG retest, SMT, OB, etc.).
Think of it as your first filter every session:
“Panel says NO TRADE? I don’t care how good the candle looks – I’m waiting.”
2. Reading each timeframe
1H: CHOP → Day is still boxed on the higher frame; big expansion hasn’t kicked in.
30M: CHOP → Classic 30M dealing range; many fake breaks and wicks likely.
15M: CHOP → Intraday still coiling; scalping environment at best.
When 2 or 3 say CHOP, expect:
Whipsaw
MSS both ways
Failed FVGs
News spikes that die in the box
Perfect time to protect your psychology and capital.
When 2 or 3 say NORMAL, expect:
Cleaner swings
Better follow-through after MSS / FVG
Easier to hold for targets
3. How it pairs with your MSS/FVG indicator
With your Chop + MSS/FVG Retest indicator:
Chop meter = environment filter
MSS/FVG indicator = entry trigger
Your process becomes:
Check chop meter:
If NO TRADE → hands off.
If TRADE → go to step 2.
On your chart, wait for:
Purge / SMT at the edges
MSS in the right direction
FVG + retest
Only take L/S when both:
Chop meter = TRADE, and
Entry model = L/S signal in the right area (premium/discount).
That way, you’re not just trading every L/S the MSS script spits out—you’re trading L/S only when the higher-timeframe environment is worth it.

Gabbie - Sweep SignalsGabbie – Sweep Signals highlights fractal swing candles on any timeframe. These fractal levels often represent areas where liquidity may rest above highs or below lows.
The indicator’s main use is on the 4-hour timeframe , where it detects the most recent sweep of a fractal level. After a sweep occurs, the script evaluates the next candle close to suggest the likely short-term momentum direction following that liquidity event.
Use this tool as confluence for:
Identifying recent liquidity sweeps on 4H
Anticipating potential continuation or reversal momentum
Projecting nearby liquidity targets
How to use
Apply on any chart (works on all symbols).
For best results, use on 4H and align with your higher-timeframe bias.
Treat signals as context, not standalone entries.
Settings
No changes are required to use the indicator immediately. Default settings display standard fractal sweep behavior.
Limitations / reminder
This is a discretionary confluence tool. It does not predict future price with certainty and should be used alongside your own risk management and strategy.
