HTF Fair Value Gap [LuxAlgo]The HTF Fair Value Gap indicator aims to display the exact time/price locations of fair value gaps within a higher user-selected chart timeframe.
🔶 USAGE
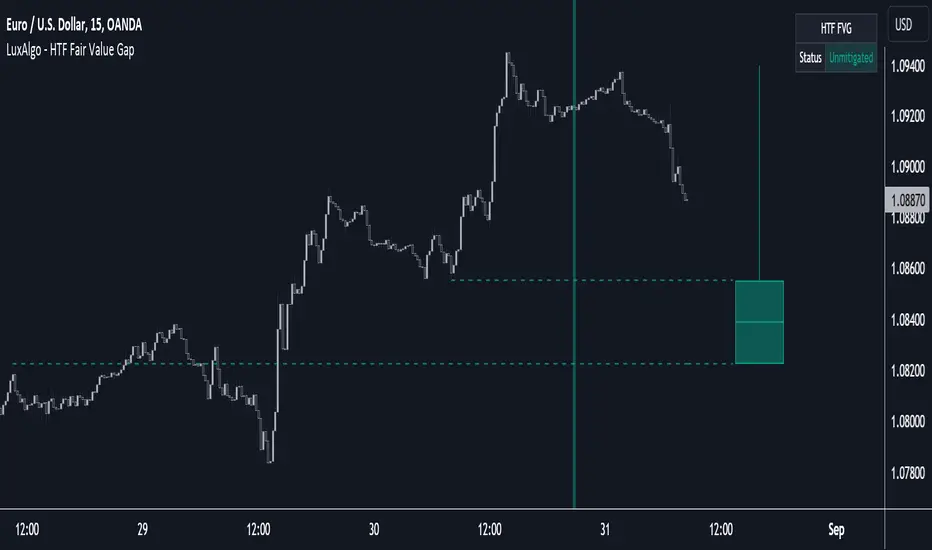
The indicator can be used to detect higher time frame fair value gaps. Detected historical HTF FVG are displayed as changes in chart background colors, with a green color indicating a bullish FVG and red a bearish FVG.
The most recent HTF FVG is displayed as a candle to the right of the most recent price candle. Dashed lines indicate the exact location of the FVG upper and lower extremities.
The wicks of the FVG candle indicate the price deviation from the FVG extremities after its formation and can help determine where the FVG is located within a trend.
A "Status" dashboard is included to indicate if the FVG is mitigated or not. This is also indicated by the border of the FVG candle, with a solid border indicating an unmitigated FVG.
🔶 SETTINGS
Timeframe: Chart timeframe used to retrieve the fair value gaps
🔹 Style
Offset: Offset to the right (in bars) of the FVG candle from the most recent bar.
Width: Width (in bars) of the FVG candle.
🔹 Dashboard
Show Dashboard: Determine whether to display the dashboard or not.
Location: Location of the dashboard on the chart.
Size: Size of the dashboard on the chart.
Fvgmtf
Fair Value Gap█ OVERVIEW
This indicator displays the Fair Value Gap of the current timeframe and an additional higher timeframe. For each FVG the gaps act as targets creating bullish and bearish gaps that are often filled.
█ FEATURES
MTF Options
MidPoint FIll
Delete Old On Fill
Label FVG Timeframe
MTF Options
Enabling the MTF Options will allow the user to use the "MTF Timeframe" setting to choose what HTF Fair Value Gap to display
MidPoint FIll
A line plot at the Half way point will be included in the Fair Value Gap, this will be used to delete the gap when reached instead of a full fill.
Delete Old On Fill
Deletes historical Fair Value Gaps when filled.
Label FVG Timeframe
Labels Every Fair Value gap with there relevant timeframe to make it easier to determine which gap is being filled.
█ HOW TO USE IT
The indicator is quite straight forward in its application, providing users with targets that are often filled as they are seen as market imbalance.
Just applying it to your chart will provide the existing Fair Value Gaps. MTF Confluence is helpful in seeing what is happening on the macro perspective.
█ SUGGESTION
My suggestion for clarity is to use a different color to some degree between the MTF and Current TF as Opposed to text, keeps the chart clear.
█ LIMITATIONS OF PINE (Please read)
I see many users going on different indicators with MTF in mind and trying to use it for LTF data e.g. 1hour chart, and selecting 5min in chart settings.
This is not recommended by the team themselves and should be noted for use always use HTF: www.tradingview.com
To understand how to use fair value gaps I recommend learning about the subject some more, searching online will provide you resources. The internet is your friend when learning. All the best.
