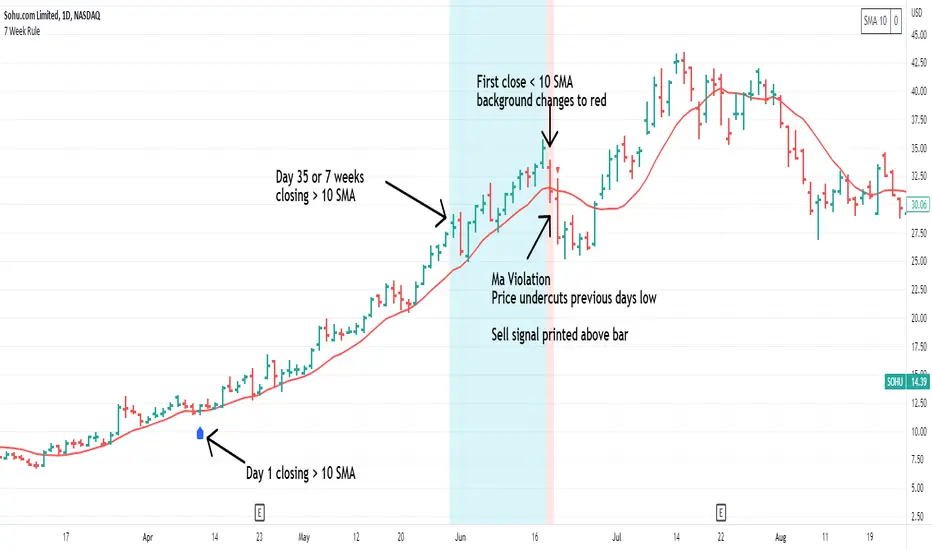
7 Week RuleThe 7 week rule was shared by Gil Morales in his book “Trade Like an O’Neil Disciple”. The rule is described as: Stocks that have shown a tendency to “obey” or “respect” the 10-day moving average for at least 7 weeks in an uptrend should often be sold once the stock violates the 10-day line. A “violation” is defined as a close below the 10-day moving average followed by a move on the next day below the intraday low of the first day.
This indicator makes using the 7 week rule easy. Once a stock has closed above its selected moving average (10SMA by default) for 35 days the 7 week rule is triggered. Once the stock then “violates” the moving average, a sell signal is printed on the chart.
Indicator Customizations
Moving Average Length & Type
Show or Hide Moving Average
Show Running Count of Days Above Selected MA
Highlight When 7 Week Rule Triggers
Option to Show First Day Above MA
Indicator is dynamic and will continue the count if no violation occurs.
Gilmorales
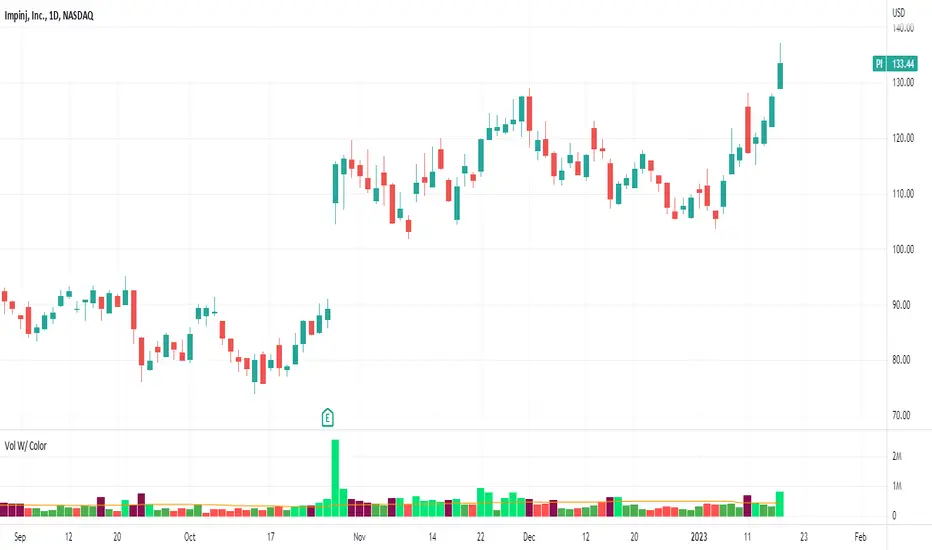
Volume With ColorVolume with color helps to quickly identify accumulation or distribution.
An accumulation day is an up day with volume greater than a user selected average.
A distribution day is a down day with volume greater than a user selected average.
This indicator will highlight those days by changing the volume bar colors for an easy visual.