KDJ – Long Only v3.0 (TradingView Strategy)
Overview|概覽
EN
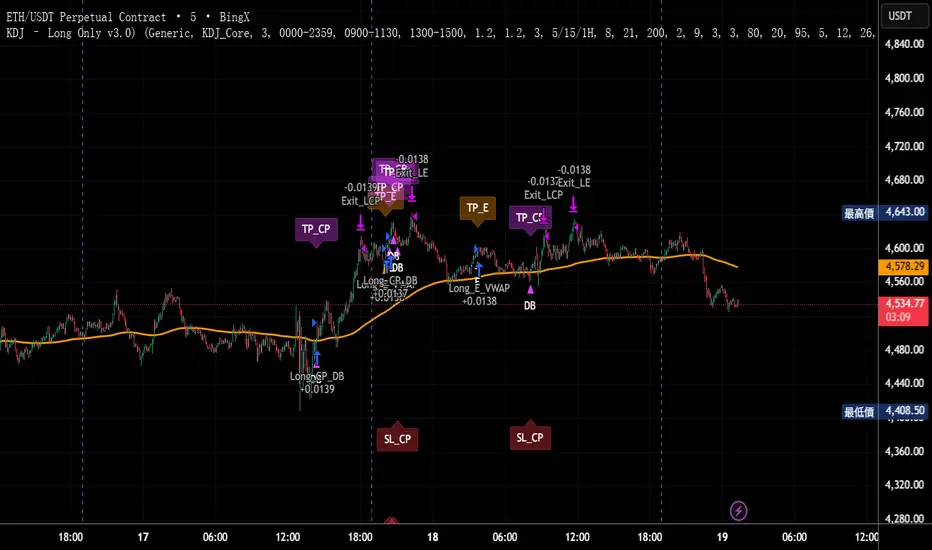
A research strategy that automates long-only entries using a KDJ-centric core with multi-layer confirmations and volatility-aware exits. Default preset targets ETH 5m; other symbols/timeframes can be tuned.
中文
研究用策略,透過 KDJ 核心與多層確認來自動化只做多進場,並以隨波動調整的出場邏輯運作。預設為 ETH 5 分鐘;其他商品/週期可自行調參。
Backtest (hypothetical) example: ETHUSDT.P, 5m, 2024-09-18→2025-09-18, fee 0.05%, slippage 1 tick.(僅示意,屬假設性回測)
What it does|做什麼
EN
Signals are organized into channels:
A KDJ trend core
B OB/FVG touch pullback
CP Double-bottom (buffered neckline)
SR Support/Resistance bounce with rejection/zone checks
D EMA pullback (long EMA length)
E VWAP reclaim (lower-band pierce & recapture)
F Prior-low sweep & reclaim
中文
訊號分成多通道:
A KDJ 順勢核心
B OB/FVG 回踩觸價
CP 雙底(頸線含緩衝)
SR 支撐/阻力觸價不破(含拒絕與區域檢查)
D EMA 回踩(長週期 EMA)
E VWAP 收復(下緣穿越後收回)
F 前低掃回
High-level logic|高層級原理
HTF/Mid-TF context:內建 5/15/1H 或 15/60/4H 組合;以簡化趨勢線/區域提供觸價參考
Trend & structure:本階 EMA(8/21/200) 結構;Structure Breakout(近期高低點 ±ATR 緩衝)/EMA8/21 回踩
Momentum/volume:MACD、KDJ 金叉與低區偵測、量能驗證
Regime:ADX 閘(趨勢/盤整門檻)、EMA 帶寬過濾震盪、Peak Guard 避免過度延伸
No look-ahead:入場不使用前視;樞紐/趨勢線僅作情境參考
Inputs & Features|參數與功能
Market Preset:Generic / ETH(ETH 預設收緊若干門檻,開箱即用)
Entry Mode:KDJ_Core / CandleOnly / KDJ_and_Candle
Session Filter:最多三段交易時窗
Lite Filters:過度延伸、實體大小、DI 差距
S/R 模組:拒絕條件、KDJ 覆核、區域要求、即時 R:R 檢核
OrderBlock/FVG:近棒位移掃描
Chart Pattern:雙底 W,ATR 容差與頸線緩衝
Plotting:EMA200、通道字母標記、可選 TP/SL 標籤
Automation via Alerts(generic)|快訊自動化(通用)
EN
On entries/exits the strategy emits JSON through alert_message. Create alerts with “Any alert() function call” and route them to your own webhook/bridge. Symbol mapping, sizing mode, and user info are configurable in inputs.
中文
進出場時透過 alert_message 輸出 JSON。建立快訊時選 “Any alert() function call”,再由你的 webhook/橋接服務轉單;輸入面板可設定商品代碼、下單型式與使用者資訊。
提示:調整參數後,請重建快訊,並將訊息欄設為 {{strategy.order.alert_message}}。
Position sizing|部位大小
base / quote / percent_local / percent(percent_local 以本地 USD 估值計算)
可選「按數量模式」以便與本地部位同步(position_size sync)
Risk & Exits|風險與出場
SL:ATR / Swing / ATR_or_Swing;TP Cap 以 ATR 或 % 限制上限
Breakeven & Trailing:達指定 R:R 啟動保本;之後以 最高價回看 − ATR×k 追蹤
Same-bar exits:可允許/禁止同根觸發 TP/SL
Pyramiding:pyramiding=2,最多兩筆多單可同時存在(淨倉交易所請留意整體倉位的平倉行為)
Suggested workflow|建議流程
回測目標市場/週期 → 設定時段/濾網與門檻 → 微調 TP/SL 與部位大小 → 建立快訊({{strategy.order.alert_message}})→ 監看執行日誌
Notes & Disclaimer|注意與免責
回測結果仰賴時間框解析與成交規則;棒內路徑與實盤可能不同
僅供研究/教育;非投資建議
本頁無廣告、無外部連結或聯絡資訊
Release Notes|版本說明
2025-09-19
新增:One-shot Force Flat(一鍵清倉僅一次)— 於下一根收盤執行,完成後自動失效
Webhook:進/出場皆輸出 JSON;提醒更新參數後重建快訊
行為澄清:pyramiding=2,允許同圖表最多兩筆多單並存;同棒出場可設定
2025-09-18
Netted venue 說明:在淨倉模式下,出場會影響同商品的整體淨多倉;請留意手動單與策略單的互動
2025-08-28
修正小數顯示;預設優化(ETH/5m);保留隨波動的 RR/SL 邏輯
Croissance
ETH/SOL 1D Dynamic Trend Core - STRATEGY v 45Overview
The Dynamic Trend Core is a sophisticated, multi-layer trading engine designed to identify high-probability, trend-following opportunities. Its core philosophy is rooted in confluence, meaning it requires multiple conditions across trend, momentum, and volume to align before generating a signal. This approach aims to filter out market noise and provide a clearer view of the underlying trend.
The script includes a comprehensive backtesting engine for strategy optimization and a rich, intuitive visual interface for real-time analysis.
How It Works: Core Logic
The engine validates signals through several sequential layers:
Primary Trend Analysis (SAMA): The foundation is a Self-Adjusting Moving Average (SAMA) that dynamically determines the primary market direction (Bullish, Bearish, or Consolidation).
Momentum Confirmation: Signals are then qualified using a blend of the Natural Market Slope and a Cyclic RSI to ensure momentum is firmly aligned with the established trend.
Advanced Filtering Suite: A suite of optional filters provides robust confirmation and allows for deep customization:
Volume & ADX: Confirms that trades are supported by sufficient market participation and trend strength.
Market Regime: Gauges broad market health (e.g., using TOTAL market cap) to avoid trading against the entire market.
Multi-Timeframe (MTF) Analysis: Aligns signals with the dominant trend on a higher timeframe (e.g., Weekly).
BTC Cycle Analysis: Positions trades within the context of historical Bitcoin cycles using models like the Halving Cycle or Mayer Multiple.
On-Chart Visuals & Features
The script provides full transparency into its logic with a powerful on-chart interface.
IMPORTANT: For the live visual elements to function correctly, you must enable "Recalculate on every tick" in the script's settings (Settings > Properties).
Power Core Gauge: Located at the bottom-center of the chart, this gauge is the heart of the system. It displays the number of filter conditions currently met (e.g., 5/6) and "powers up" by glowing brighter as more conditions align, indicating a fully confirmed signal is ready.
Live Conditions Panel: This panel in the bottom-right corner acts as a real-time pre-flight checklist. It shows the status (pass/fail) of every individual filter, so you know exactly why a signal is, or is not, being generated.
Energized Trendline: The primary SAMA trendline changes color and intensity based on the strength and direction of the trend, offering immediate visual context.
BTC Halving Cycle Visualizer: Provides a background color guide to the different phases of the Bitcoin halving cycle for macro context.
How to Use & Configure
Select Operation Mode:
Backtest Mode: Use this to test different settings on historical data and find optimal configurations for a specific asset and timeframe.
Alerts-Only Mode: Use this for live trading to generate alert signals without cluttering the chart with backtest data. (Contact publisher for access to this version)
Configure Your Filters:
Start with the default filter settings.
If a potential setup is missed, check the Live Conditions Panel to see which specific filter blocked the signal.
Enable, disable, or adjust filters in the script's settings to match your trading style and the asset's characteristics.
Manage Your Risk:
Go to the "Risk & Exit" settings to configure your Stop Loss and Take Profit parameters to match your personal risk tolerance.
Disclaimer: This script is for educational and informational purposes only. It is not financial advice. All trading involves risk, and past performance is not indicative of future results. Please conduct your own research and backtesting before making any trading decisions.

BTC Dynamic Trend Core Strategy v45// The Dynamic Trend Core is a sophisticated, multi-layer trading strategy that provides both a quantitative //
// backtesting engine and a rich, intuitive visual interface. It is designed to identify high-probability //
// trend-following opportunities by requiring a confluence of conditions to be met before a signal is considered //
// valid. //
// //
// The system's philosophy is rooted in confirmation, seeking to filter out market noise by ensuring that trend, //
// momentum, market sentiment, and volume are all in alignment. //
// //
// --- CORE LOGIC COMPONENTS --- //
// 1. **Primary Trend Analysis (SAMA):** The foundation is a self-adjusting moving average (SAMA) that //
// determines the underlying market trend (Bullish, Bearish, or Consolidation). //
// //
// 2. **Confirmation & Momentum:** Signals are confirmed with a blend of the Natural Market Slope and a Cyclic //
// RSI to ensure momentum aligns with the primary trend. //
// //
// 3. **Advanced Filtering Layers:** A suite of optional filters allows for robust customization: //
// - **Volume & ADX:** Ensure sufficient market participation and trend strength. //
// - **Market Regime:** Uses total crypto market cap to gauge broad market health. //
// - **Multi-Timeframe (MTF):** Aligns signals with the dominant weekly trend. //
// - **BTC Cycle Analysis:** Uses Halving or Mayer Multiple models to position trades within historical //
// macro cycles. //
// //
// --- VISUAL INTERFACE --- //
// The strategy's real power comes from its on-chart visual feedback system, which provides full transparency. //
// ****Note: for this to be enabled recalculate 'on every tick' needs to be enabled in the properties settings. //
// 1. **Power Core Gauge:** Located at the bottom-center, this gauge is the heart of the system. It displays the //
// number of active filter conditions that have been met (e.g., 5/6). It "powers up" as more conditions align,//
// glowing brightly when a signal is fully confirmed and ready. //
// //
// 2. **Live Conditions Panel:** In the bottom-right corner, this panel acts as a detailed pre-flight checklist. //
// It shows the real-time status of every single filter, helping you understand exactly why a trade is (or //
// is not) being triggered. //
// //
// 3. **Energized Trendline:** The main SAMA trendline changes color and brightness based on the strength and //
// direction of the trend, providing immediate visual context. //
// //
// 4. **Halving cycle visualisation:** Visual guide to halving phases //
// //
// --- HOW TO USE --- //
// 1. **Select Operation Mode:** Use "Backtest Mode" to test settings and "Alerts-Only Mode" for live signals. //
// //
// 2. **Configure Strategy:** Start with the default filters. If a potential trade setup is missed, check the //
// **Live Conditions Panel** to see exactly which filter blocked the signal. Adjust the filters to suit your //
// specific asset and timeframe. //
// //
// 3. **Manage Risk:** Adjust the Risk & Exit settings to match your personal risk tolerance. //

DCA Buy v1Key Features
1. Selective Entry Filters
Trend Filter
Enabled through "Enable Trend Filter?" using the "EMA Length" setting to ensure entries align with prevailing trends.
Momentum Filter
Configured using "Enable Momentum Filter?" combined with "RSI Length" and "RSI Source" to detect oversold conditions.
Bollinger Filter
Activated via "Enable Bollinger Filter?" along with "BB Length" and "BB Multiplier" to focus entries on deeper price dips below Bollinger Bands.
2. DCA Configuration
Base Order Settings
Choose between a percentage ("Base Order % of Equity/Initial Capital") or fixed value ("Base Order Value ($)").
Safety Order Settings
Fine-tune "Initial Deviation (%)" and "Price Deviation Multiplier" to control the spacing of safety orders.
Use "Volume Scaling Factor (Qty)" to scale the size of each subsequent safety order.
Customize the "First Safety Order Type" as either value-based or a multiplier of the base order using "1st Safety Order Value ($)" or "1st Safety Order Multiplier (Qty)".
Set the maximum number of safety orders through "Max Safety Orders".
3. Profit and Risk Management
Take Profit Settings
"Take Profit (%)" triggers a sell when a specific profit percentage above the average entry is reached.
Use "Trailing Take Profit (%)" to lock in profits while capturing additional upside if prices continue to rise.
Stop Loss Settings
Configure "Stop Loss (%)" to prevent excessive drawdowns by closing all positions when prices drop below a defined percentage.
4. Time Control & Visualization
Time Filters
Define trading windows with "Start Time" and "End Time".
Use "Cooldown (Seconds)" to avoid frequent entries during rapid price movements.
Visualization
Enable "Show Average Entry Price", "Show Take Profit Level", and "Show Stop Loss Level" to plot key levels on the chart for better monitoring.
5. Performance Metrics
Built-in performance tracking includes:
Net Profit (%): Measures overall profitability.
Win Rate (%): Displays the ratio of winning trades.
Max Drawdown (%): Tracks the largest equity decline.
Trading Days: Calculates the duration of active trades.
Profit/Day (%): Evaluates daily returns.
The performance table also shows average cycle duration and utilization of available capital.
