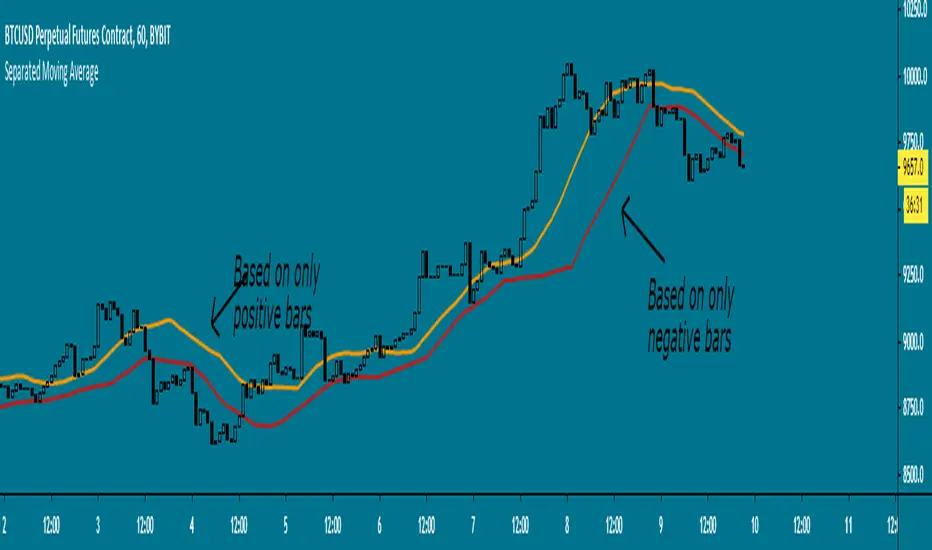
Separated Moving Average - evoHere are two moving averages, one based on positive candles and the other based on negative candles. If the current bar is positive, the negative MA will use its last known negative bar for the calculation. The default setting uses Heikin Ashi to smooth the candles with the trend, you can turn this off if you want in inputs.
Let me know if you find it useful :)
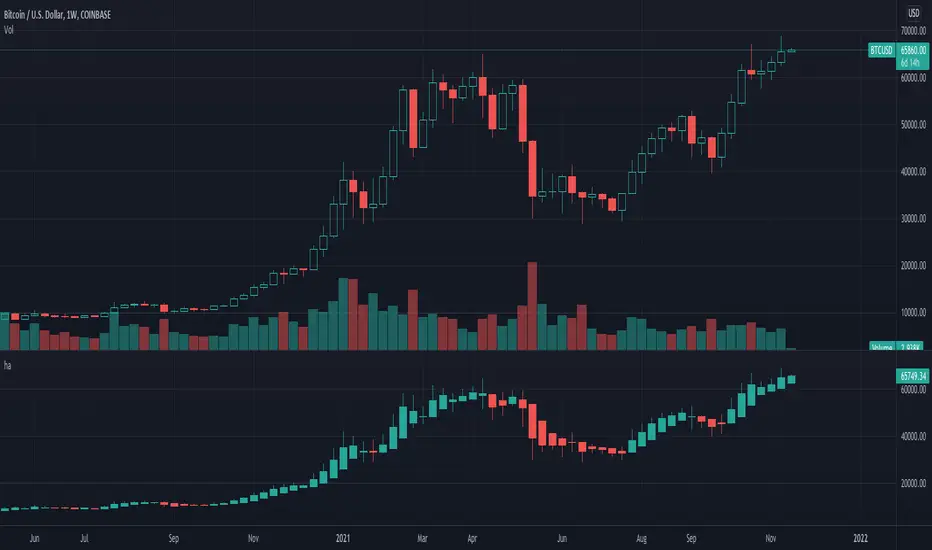
Heikin-ashi
Off-chart 21 MA, Bollinger Bands and Heikin Ashi CandlesThis off-chart indicator provides three basic and useful tools for trend trading in Bitcoin and probably other markets. Heikin Ashi candles being utilized with classic candle patterns at the same time could be considered as a conservative and safe confirmation approach for entring your position.

21 MA, Bollinger Bands and Heikin AshiThis on-chart indicator provides three basic and useful tools for trend trading in Bitcoin and probably other markets. Moving and Bollinger lines act as strong support and resistance in 4H resolution. Heikin Ashi candles being utilized with classic candle patterns at the same time could be considered as a conservative and safe confirmation approach for entring your position.

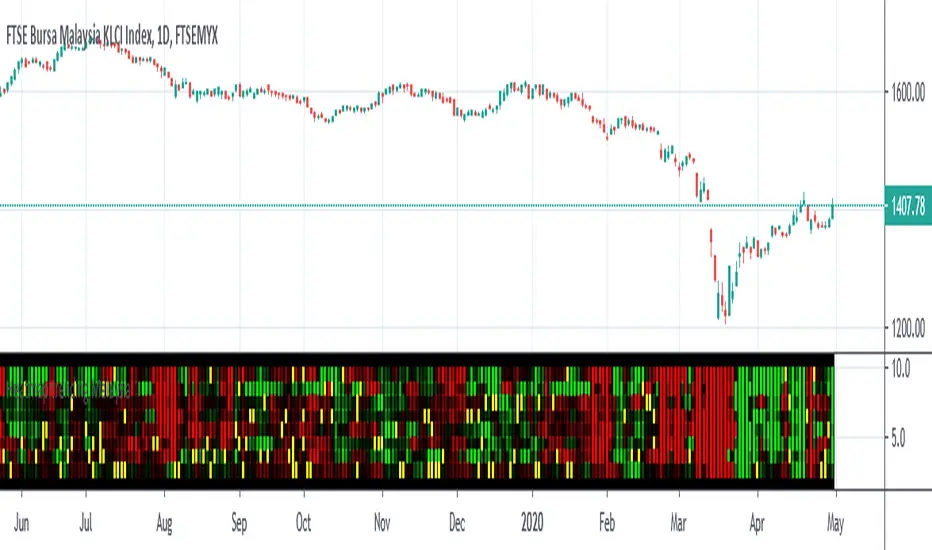
Heatmap trending MalaysiaThis heatmap chart is created base on Heikin Ashi trend for Malaysia Major Index
CONSTRUCTN ,TECHNOLOGY,FINANCE,CONSUMER,PROPERTIES,IND-PROD,PLANTATION,REIT.
This allow compare to malaysia stock for macro trending.
Lastly ,thank to LonesomeTheBlue which inspire me for this coding .
Heikin-Ashi Source FunctionCustom source function for toggling traditional Candle sources or Heikin-Ashi sources on a traditional Candles chart.
Thanks to PineCoders for rounding method: www.pinecoders.com
Thanks to @LucF and @RicardoSantos for their advice and enlightenment as always.
NOTICE: This is an example script and not meant to be used as an actual strategy. By using this script or any portion thereof, you acknowledge that you have read and understood that this is for research purposes only and I am not responsible for any financial losses you may incur by using this script!
Pivot Points Standard Asian RangeThis script is a trend following template for intraday trading. When the moving averages cross, you get your signal to look for buy/ sell trades only. wait for price to pullback before entering for continuation trades. Can be used for counter trend trading strategy as well. Best used with heiken-ashi candles.

Briz HA MTF - A Heikin-Ashi Multi-Timeframe Indicator Ever wanted to know what Heikin-Ashi candles are showing for multiple time frames at a glance? Adjustable time frame for each row. Arrows show when each column is either all green (white up arrow) or all red (yellow down arrow).

Smooth HA / Hull MA / MTF===========
Smooth HA / Hull MA / MTF
===========
A combination of a Smoothed Heikin Ashi Chart Line and a Hull MA Line, paints a "Long" or "Short" alert when the Hull MA changes color - editable settings for the smoothing of HA data and Hull MA Length; you can also change the time frame used (must be the same or longer as the chart).
-----------
This indicator does a real good job at finding highs and lows (otherwise known as entry and exit points!) picking up on just about every large, decent swing and making the most from those big moves! The disadvantage of all Smoothed HA strategies are when times are choppy or ranging - given the natural lag of the indicator you can be sure in choppy times you'd be buying at the top and selling at the bottom almost every time ~ No indicator is perfect!
This Smooth HA/Hull MA indicator also has a built in MTF function (Multi-Time-Frame). This means you can be using a 1hr chart and set the indicator to a 4hr chart - generally any movements on a greater time frame will overcome any movements of the smaller time frame, so this is where you should be gathering data about which direction the market is moving - as always, follow the trend.
Hope (like always) this is of at least some use to some people.
Good Luck and Happy Trading!


Heikin Ashi With Moving Averages This script is using 4 moving averages, 2 for short term movements, and 2 for long term movements.
Used on Heikin Ashi will help identify short term that is true short term, and Short Term that will most likely turn into a long term trend.
color coded candlesticks will identify if the price action is low in RSI or STOCH. colors can be changed in settings
If you need help understanding the settings let me know ill help you just post the question
You will need to add Heikin Ashi on your chart to get the full effect of this script. Nevertheless, you can use it on traditional candlesticks

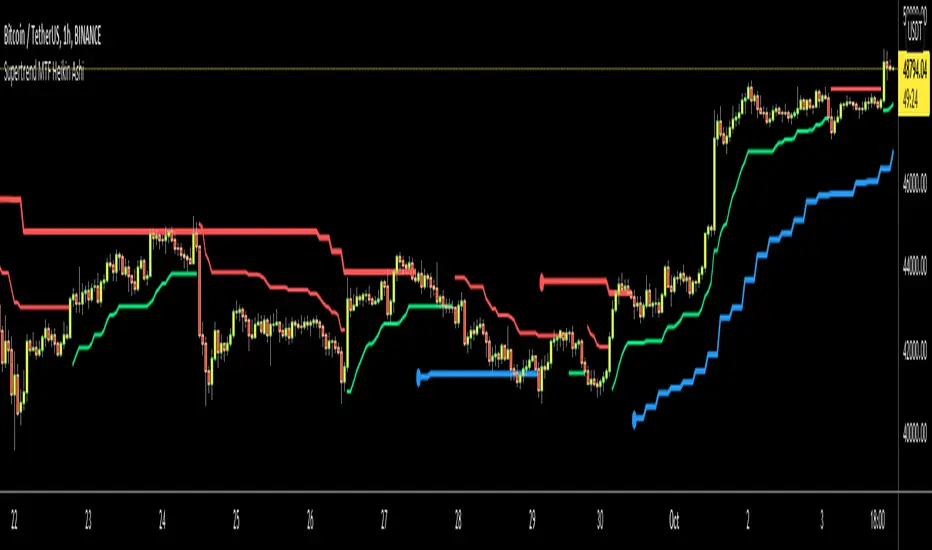
Supertrend MTF Heikin AshiThis is non-repaiting Supertrend Multi Time Frame script, uses Heikin Ashi Candles as source on normal chart
There is an option for Higher Time Frame. if you choose "Auto" then Higher Time Frame calculation is made by the script. If you choose "User Defined" option and then you can select Time Frame.
You better use this script with other indicators such as RSI, Momentum etc.
Enjoy!
[TVExtBot]HeikinAshi Trend Indicator v1.0Heikin-ashi Trend Indicator v1.0
BYBIT:BTCUSD
This indicator analyzes trends with Heikin-ashi Ass and EMA to buy and sell, and closes positions by analyzing patterns of Bollinger bands and candles.
The numbers at the top and bottom of the indicator are the RSI values.
Only overbought 30 or less and oversold 70 or more are displayed.
이 지표는 하이킨아시와 EMA로 트랜드를 분석하여 매수와 매도 진입을 하고 볼린저밴드와 캔들의 패턴을 분석하여 포지션종료를 합니다.
지표의 상단과 하단에 표시된 숫자는 RSI값입니다.
과매수 30이하와 과매도 70이상만 표시합니다.

BERLIN CandlesA problem with Heikin Ashi is that while it gives you a great overview of overall direction, it is rarely possible to use it as a replacement for normal japanese
candlesticks. The reason for this is that actual price data is lost, since the candles are more akin to a moving average than a different way to see price action. Also, with Heikin Ashi, most of the actual price action is lost, because the candles can be bigger than the high and low of the underlying japanese candlestick.
With BERLIN Candles I have tried to fix that problem. By using a smoothed out version of the previous Heikin Ashi candle close as the current BERLIN Candle open, the high and low of the actual japanese candlestick for the high and low of the BERLIN Candle, and the current Heikin Ashi close as the BERLIN Candle close, while setting hard limits for BERLIN Candle open and close values so that they can never exceed the high and low of the underlying japanese candlestick.
One problem still persists though. The actual current price data is lost. However, the BERLIN Candles have solved this by adding a fifth part to the candles. The close of the underlying japanese candlesticks are indicated with a plus-sign. This way, actual price data is never lost, while keeping all of the other benefits of this type of candles.
A few added bonuses:
The addition of the 14 period ATR at the latest candle
The baseline from Ichimoku is included as an option
The 14 period ATR value of each candle can be seen in the indicator data as
the orange value

Trendy Bar Trend ColorTrendy Bar Trend Color
Inspired by trend candlestick charts on other trading platforms. Changes bar colors to stay in trend much like Heikin Ashi candles without the ATR price distortion. This is done by comparing the HL2 and/or Open-Close values of current candlestick to the prior candlestick.

SBER HA Smooth ContainerSBER's modified Heikin Ashi Smoothed Container
Uses EMA 16 and Heikin Ashi Candles.. For NIFTY and its stocks only.

Heiken Ashi Triangles at the Top and Bottom of ScreenHeiken Ashi Triangles at the Top and Bottom of Screen
The image below shows the comparison to actual Heiken Ashi candles
(Though changing from candles to Heiken Ashi tends to smooth the triangles a little)

Backtesting on Non-Standard Charts: Caution! - PineCoders FAQMuch confusion exists in the TradingView community about backtesting on non-standard charts. This script tries to shed some light on the subject in the hope that traders make better use of those chart types.
Non-standard charts are:
Heikin Ashi (HA)
Renko
Kagi
Point & Figure
Range
These chart types are called non-standard because they all transform market prices into synthetic views of price action. Some focus on price movement and disregard time. Others like HA use the same division of bars into fixed time intervals but calculate artificial open, high, low and close (OHLC) values.
Non-standard chart types can provide traders with alternative ways of interpreting price action, but they are not designed to test strategies or run automated traded systems where results depend on the ability to enter and exit trades at precise price levels at specific times, whether orders are issued manually or algorithmically. Ironically, the same characteristics that make non-standard chart types interesting from an analytical point of view also make them ill-suited to trade execution. Why? Because of the dislocation that a synthetic view of price action creates between its non-standard chart prices and real market prices at any given point in time. Switching from a non-standard chart price point into the market always entails a translation of time/price dimensions that results in uncertainty—and uncertainty concerning the level or the time at which orders are executed is detrimental to all strategies.
The delta between the chart’s price when an order is issued (which is assumed to be the expected price) and the price at which that order is filled is called slippage . When working from normal chart types, slippage can be caused by one or more of the following conditions:
• Time delay between order submission and execution. During this delay the market may move normally or be subject to large orders from other traders that will cause large moves of the bid/ask levels.
• Lack of bids for a market sell or lack of asks for a market buy at the current price level.
• Spread taken by middlemen in the order execution process.
• Any other event that changes the expected fill price.
When a market order is submitted, matching engines attempt to fill at the best possible price at the exchange. TradingView strategies usually fill market orders at the opening price of the next candle. A non-standard chart type can produce misleading results because the open of the next candle may or may not correspond to the real market price at that time. This creates artificial and often beneficial slippage that would not exist on standard charts.
Consider an HA chart. The open for each candle is the average of the previous HA bar’s open and close prices. The open of the HA candle is a synthetic value, but the real market open at the time the new HA candle begins on the chart is the unrelated, regular open at the chart interval. The HA open will often be lower on long entries and higher on short entries, resulting in unrealistically advantageous fills.
Another example is a Renko chart. A Renko chart is a type of chart that only measures price movement. The purpose of a Renko chart is to cluster price action into regular intervals, which consequently removes the time element. Because Trading View does not provide tick data as a price source, it relies on chart interval close values to construct Renko bricks. As a consequence, a new brick is constructed only when the interval close penetrates one or more brick thresholds. When a new brick starts on the chart, it is because the previous interval’s close was above or below the next brick threshold. The open price of the next brick will likely not represent the current price at the time this new brick begins, so correctly simulating an order is impossible.
Some traders have argued with us that backtesting and trading off HA charts and other non-standard charts is useful, and so we have written this script to show traders what happens when order fills from backtesting on non-standard charts are compared to real-world fills at market prices.
Let’s review how TV backtesting works. TV backtesting uses a broker emulator to execute orders. When an order is executed by the broker emulator on historical bars, the price used for the fill is either the close of the order’s submission bar or, more often, the open of the next. The broker emulator only has access to the chart’s prices, and so it uses those prices to fill orders. When backtesting is run on a non-standard chart type, orders are filled at non-standard prices, and so backtesting results are non-standard—i.e., as unrealistic as the prices appearing on non-standard charts. This is not a bug; where else is the broker emulator going to fetch prices than from the chart?
This script is a strategy that you can run on either standard or non-standard chart types. It is meant to help traders understand the differences between backtests run on both types of charts. For every backtest, a label at the end of the chart shows two global net profit results for the strategy:
• The net profits (in currency) calculated by TV backtesting with orders filled at the chart’s prices.
• The net profits (in currency) calculated from the same orders, but filled at market prices (fetched through security() calls from the underlying real market prices) instead of the chart’s prices.
If you run the script on a non-standard chart, the top result in the label will be the result you would normally get from the TV backtesting results window. The bottom result will show you a more realistic result because it is calculated from real market fills.
If you run the script on a normal chart type (bars, candles, hollow candles, line, area or baseline) you will see the same result for both net profit numbers since both are run on the same real market prices. You will sometimes see slight discrepancies due to occasional differences between chart prices and the corresponding information fetched through security() calls.
Features
• Results shown in the Data Window (third icon from the top right of your chart) are:
— Cumulative results
— For each order execution bar on the chart, the chart and market previous and current fills, and the trade results calculated from both chart and market fills.
• You can choose between 2 different strategies, both elementary.
• You can use HA prices for the calculations determining entry/exit conditions. You can use this to see how a strategy calculated from HA values can run on a normal chart. You will notice that such strategies will not produce the same results as the real market results generated from HA charts. This is due to the different environment backtesting is running on where for example, position sizes for entries on the same bar will be calculated differently because HA and standard chart close prices differ.
• You can choose repainting/non-repainting signals.
• You can show MAs, entry/exit markers and market fill levels.
• You can show candles built from the underlying market prices.
• You can color the background for occurrences where an order is filled at a different real market price than the chart’s price.
Notes
• On some non-standard chart types you will not obtain any results. This is sometimes due to how certain types of non-standard types work, and sometimes because the script will not emit orders if no underlying market information is detected.
• The script illustrates how those who want to use HA values to calculate conditions can do so from a standard chart. They will then be getting orders emitted on HA conditions but filled at more realistic prices because their strategy can run on a standard chart.
• On some non-standard chart types you will see market results surpass chart results. While this may seem interesting, our way of looking at it is that it points to how unreliable non-standard chart backtesting is, and why it should be avoided.
• In order not to extend an already long description, we do not discuss the particulars of executing orders on the realtime bar when using non-standard charts. Unless you understand the minute details of what’s going on in the realtime bar on a particular non-standard chart type, we recommend staying away from this.
• Some traders ask us: Why does TradingView allow backtesting on non-standard chart types if it produces unrealistic results? That’s somewhat like asking a hammer manufacturer why it makes hammers if hammers can hurt you. We believe it’s a trader’s responsibility to understand the tools he is using.
Takeaways
• Non-standard charts are not bad per se, but they can be badly used.
• TV backtesting on non-standard charts is not broken and doesn’t require fixing. Traders asking for a fix are in dire need of learning more about trading. We recommend they stop trading until they understand why.
• Stay away from—even better, report—any vendor presenting you with strategies running on non-standard charts and implying they are showing reliable results.
• If you don’t understand everything we discussed, don’t use non-standard charts at all.
• Study carefully how non-standard charts are built and the inevitable compromises used in calculating them so you can understand their limitations.
Thanks to @allanster and @mortdiggiddy for their help in editing this description.
Look first. Then leap.

HeikinAshi_Atr_StrategyThis strategy combines HeikinAshi and ATR, have better performance on 5min XBTUSD pair after parameter optimization.
Different from the original HeikinAshi chart provided by Tradingview (which is Repainting ), this script does not use the HeikinAshi SECURITY function so there is no Repainting!
Try it by yourself !!

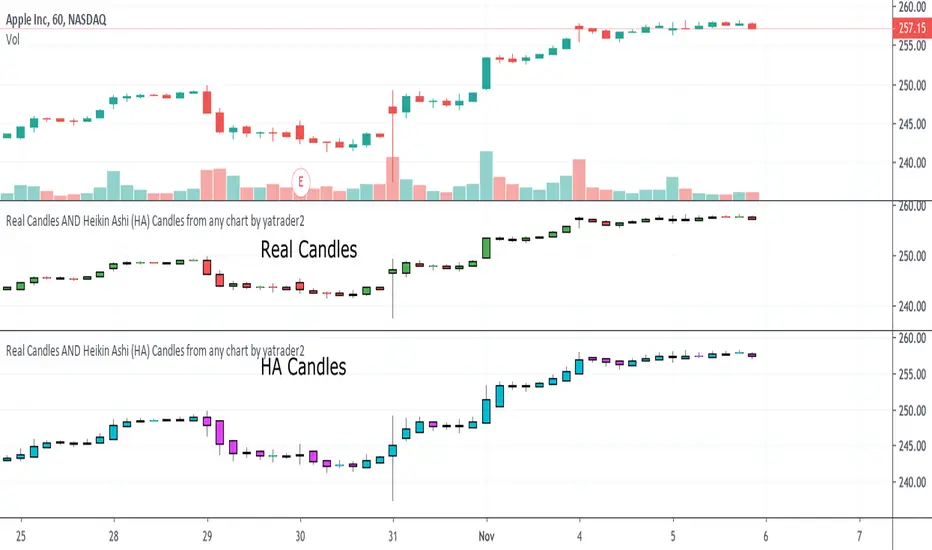
Real Candles Heikin Ashi (HA) Candle functionsThis script plots both real and HA candles regardless or which are used on the chart in TV settings.
(and has the functions for you to use.)
Lots of people seem to misunderstand backtesting (or scam people) based on HA candles.
Backtesting with HA candles leads to impossible trades. ALWAYS backtest with real candles.
That doesn't mean you might not want to look at HA candle values to make trading decisions.
Add the code below to calculate HA candles from real and use that in your HA trading algo,
but test it on real charts.
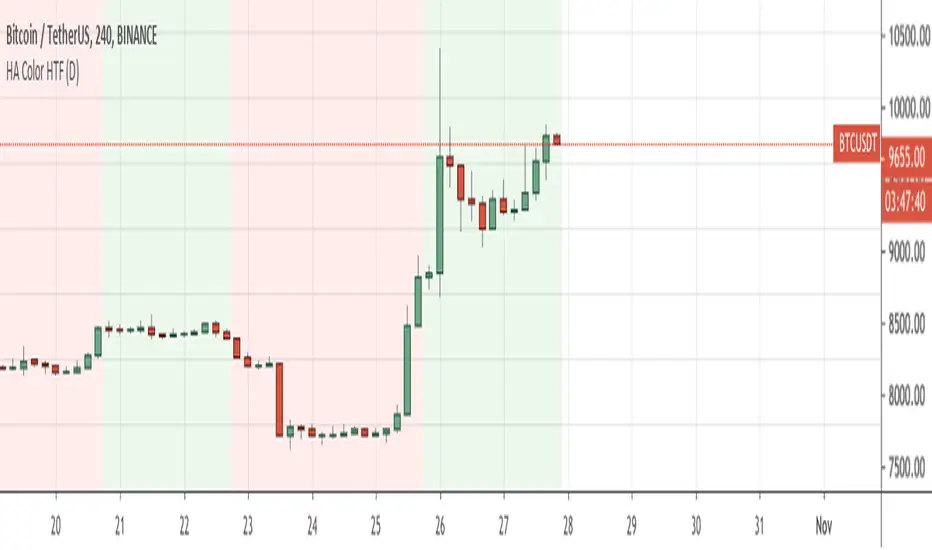
QuantNomad - Heikin Ashi Colors Higher TimeframeSimple script displaying color of Heiken Ashi candles from higher timeframes as a background.
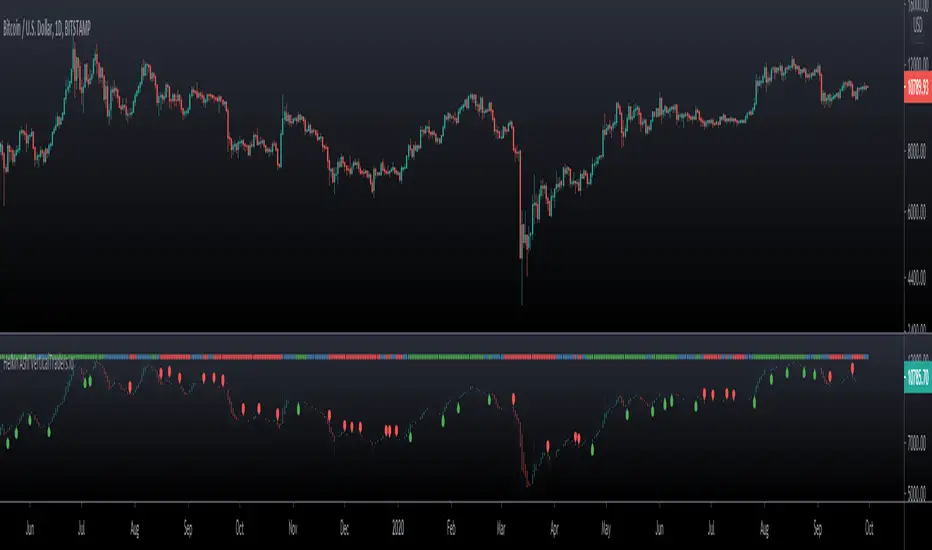
Heiken AshiHeikin Ashi charts are similar to candle charts, but the main difference is that a Heikin Ashi chart uses daily price averages to show the movement of the average price of an asset.
The idea is to use the heikin Ashi technique as an indicator and not as the main chart, to avoid enter or exist the market too late.
Key concepts:
- The averaged open and close help filter some of the market noise, creating a chart that tends to highlight the trend direction better than typical candlestick charts.
- The downside is that some price data is lost with averaging. The most recent price (close) may not reflect the actual price of the asset, which could affect risk.
- Long down candles with little upper shadow represent strong selling pressure. Long up candles with small or no lower shadows signal strong buying pressure.
Extra functions in this indicator:
- Trend Bar indicator, uptrend(green), downtred(red), warning or indecision (yellow).
- Long and Short Labels base on trend and Heikin Ashi entries.
- Change the color of the main chart Candlesticks as the Heikin Ashi indicators.
- Alerts for long and short entries.
- Size of Labels.
Heiken-Ashi CandlesSimple script to view Heiken-Ashi candles below a normal candles chart.
Could also be useful for using HA calcs in strategy scripts on normal candles chart for proper backtesting.
I adapted this to v4 from original v2 script by @samtsui. If you like please remember to give him a Thumbs Up for his original version! ->
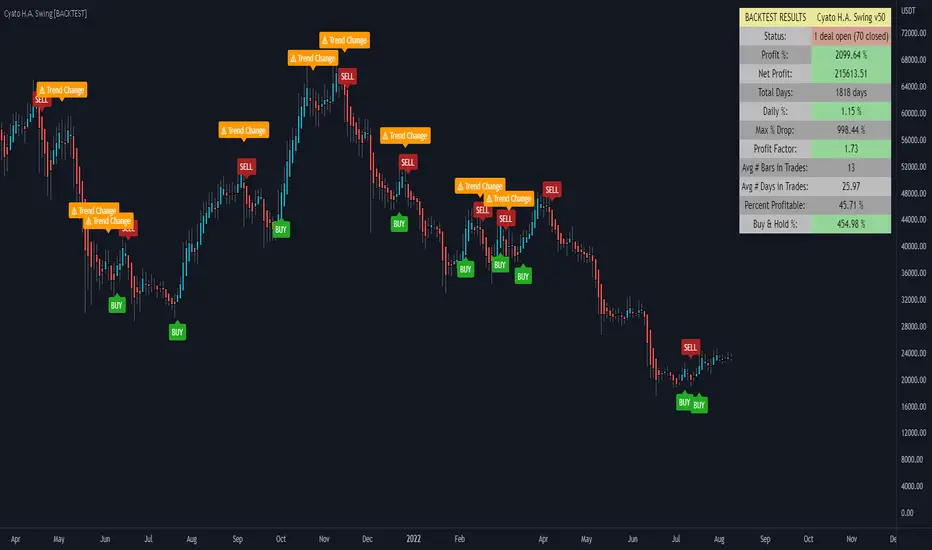
Cyatophilum H.A. Swing [BACKTEST]Hi guys, to celebrate the beginning of a new altcoins cycle, I created a Swing trade Indicator. (It's a joke, there will not be any altcoins cycle)
Cyatophilum Heikin Ashi Swing
This indicator will allow us to create one strategy for each pair and never miss those big swings ever again!
HOW BEAT BUY & HOLD WORKS
This kind of strategy is a safe long term investment , usually played in high timeframes such as 4H, 1D etc.
It is perfect for beginners in trading as the process is very simple: buy and sell when you receive the alert. The high timeframes allows to trade manually by receiving alerts on your phone or email, but you also can automate it if you prefer.
The primary goal of these strategies is to increase your capital faster than someone simply holding the asset .
The trades are made with no leverage and 100% equity . It is for those who want to grow their portfolio fast without risking to lose everything. You can use several strategies at once, in this case split your equity accordingly.
HOW DOES IT WORK?
The Heikin Ashi candles are very usefull. This strategy is built upon H.A. candles but is used on normal candles, because H.A. candles price are an average of real candles and we want to know the real price. I did the trick by recalculating the H.A. open, high, low and close with the original formula based on the real candles's ohlc. This allows me to use the strategy tester and backtest with real results.
HOW TO USE
Creating a signal is as simple as adding the indicator called to your chart and click "Set alert". Select "Once per bar close" for your alert options.
There are 3 alerts:
- BUY
- SELL
- BUY OR SELL (for free TV users)
Sample Backtest results
Bitcoin/Dollar
Ethereum/Bitcoin
Basic Attention Token/Bitcoin
> > Start using the indicator now < <
Note: This version is the BACKTEST. You can find the Alert version in my profile scripts.