HeikinAshi_Point (HA-P)Hello?
Traders, welcome.
If you "follow", you can always get new information quickly.
Please also click "Like".
Have a good day.
-------------------------------------
Following the previously published MACD-Total indicator, we are releasing the second indicator.
- index -
1. HA-P Indicator Description
2. Chart interpretation using HA-P indicators
3. More important than indicators is creating a trading strategy
(1. HA-P Indicator Description)
The Heikin Ashi candle chart is a very good way to see trends.
However, it is a pity that the actual price is not known on the chart made of Heikin Ashi candles.
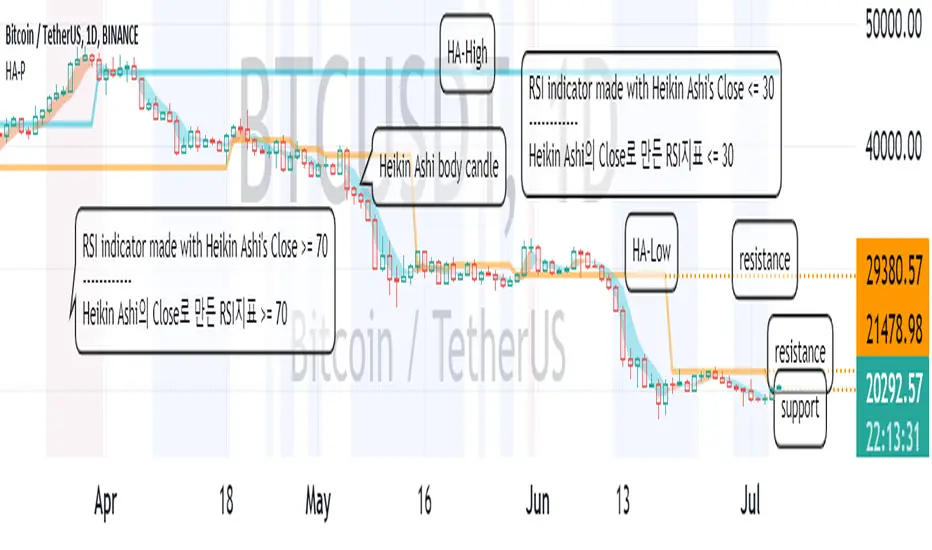
To compensate for this, the body candle part (Open~Close) of the Heikin Ashi candle was filled with the background of the normal candle.
If you see more candles below the bottom of the body candle, you know the strength of the downtrend is high.
Conversely, if more candles are displayed above their body candles equivalent, you can tell that the bullish strength is high.
It can be seen that when the body candle color is displayed in blue, it is more likely to decline, and when it is in yellow, it is more likely to rise.
The Heikin Ashi candle is a trending candle.
Therefore, Heikin Ashi candles cannot be traded on their own.
To complement this, HA-Low and HA-High indicators were created.
The point where the HA-Low and HA-High indicators are leveled serves as support and resistance.
So, the longer the horizontal line, the stronger the support and resistance role.
A typical RSI is usually expressed as Close.
Since the Close of the Heikin Ashi candle is different from the normal Close, we made it to display when the RSI is oversold and overbought as the background of the price chart.
You cannot trade with the RSI indicator and the Heikin Ashi candle.
However, it can be used to detect a change in trend.
This gives you time to react to trend changes.
In order to trade, it is possible to find support and resistance at the HA-Low and HA-High indicators.
------------------------------------------------------------ ------
(2. Chart interpretation using HA-P indicator)
Let's interpret the BTCUSDT 1D chart using the HA-P indicator.
Primary resistance: around 21478.98
Secondary resistance: around 29380.57
It moved higher on the 4th of July, breaking out of the RSI oversold zone.
If it rises above the 19946.21 point and finds support, it is expected to lead to further upside.
However, it needs to rise above 21478.98 for support to lead to further upside.
---------------------------------
(3. More important than indicators is creating a trading strategy)
In order to trade using these indicators, you need to invest a lot of time and observe.
Whether you use an indicator or not, the most important thing in trading is whether you have many trading strategies.
No matter how good indicators and signals are, if you do not have a trading strategy, you will not be able to properly trade due to psychological pressure.
Therefore, it is most important to plan a trading strategy in advance before proceeding with a trade.
- How much money to invest
- How to set up a rough plan for buying in installments and selling in installments
- How to set the Stop Loss point
- How long will the investment be (short-term, medium-term, long-term, etc.)
Basically, the above thoughts must be concretely thought out before proceeding with the investment.
Otherwise, if you buy blindly when the price rises, there is a high possibility that you will end up incurring a loss due to psychological anxiety due to the volatility of the price.
----------------------------------
Heikinashi
Aarika Heikin AshiHello Traders,
This indicator is probably based for the people who use HA candlestick chart and frequently have to switch between Japanese candlestick and HA candles. The worry is over with this simple indicator.
Now you can enjoy both candlesticks at the same time.
AHA allows you to have 2 EMAs (mostly used for crossovers). Default values set at 8/21 EMA which we may indicate a trend reversal.
We strongly recommend you back-test everything that you need before you start using AHA.
Thank you.

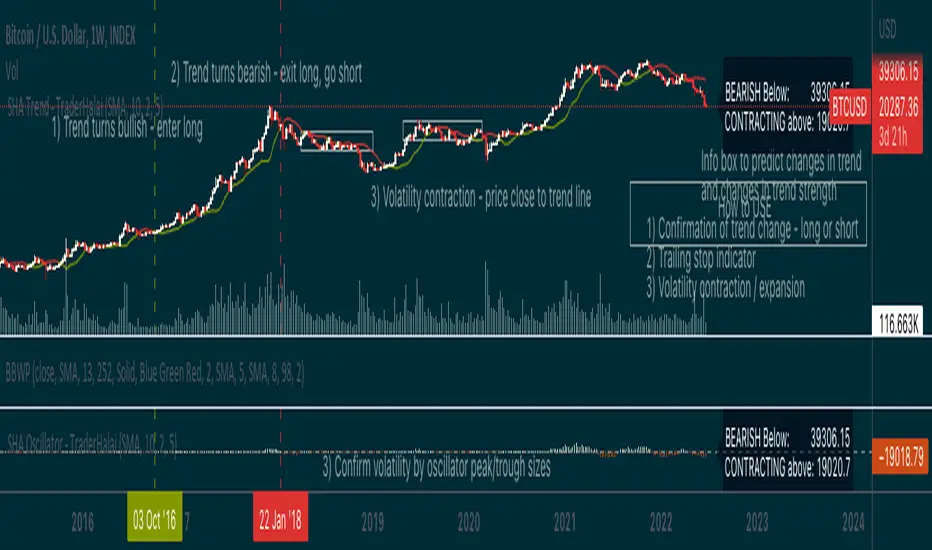
Smoothed Heikin Ashi Trend on Chart - TraderHalaiThis indicator is a predictive tool using Heikinashi to calculate shifts in trade direction.
It works by reverse-engineering the regular candle stick closing price required, to flip the Heiken Ashi candle from Red to Green and vice-versa.
Below, is an earlier indicator that I released and created. This plots this price as an oscillator, which allows traders to get a predictive indicator of a trend change.
This indicator extends upon this functionality by adding a smoothing function to the reverse-engineered regular candle stick closing price, to reduce the choppiness of signals. It also plots the indicator on the chart to allow for easier visual confirmation.
How to use
1) As a directional bias - Bullish or bearish
2) Volatility expansion/contraction - further distance from line means volatility expansion - am planning to release an oscillator version also
3) Trailing stop loss - once you are in a trade
Other Features
Select a moving average period and smoothing calculation method (e.g. SMA / EMA)
Non-repaint mode for backtesting and use/integration with higher timeframes
Final note - Open Source
I am releasing this as open-source for the benefit of the community and to allow further development, scrutiny and criticism. Please feel free to use this indicator as you see fit. If you do use this indicator to create another script, feel free to drop me a note, as I would be highly interested in your idea.
Thanks, and Enjoy!
Heikin Ashi OscillatorThis indicator plots a delta between the Heiken Ashi close price and the regular candlestick closing price as a histogram, which allows you to quickly analyse changes in trend
direction.
It also provides a reverse-engineered closing price for regular candlesticks, to reach in order to maintain the momentum, which allows you to be forewarned of potential pivot points to change in bias in direction.
Feel free to use this indicator to modify and add to your charts as you wish.

[_ParkF]HeikinAshi
In the Input menu, the default value of Location is 1, and HeikinAshi can be seen overlapping the candle.
If you modify the Location value, you can overlay it separately with candle to compare.
(In this case, the HeikinAshi value is different from the actual value, so it is recommended to use it to identify the trend.)
Also, if you move HeikinAshi to a new pane, you can use it as an auxiliary indicator at the bottom.
--------------------------------------------------------------------------------------------------------------------------------------------------------------------------------------------------
Input 메뉴에서 Location의 기본값은 1이며, 헤이킨아시를 캔들과 겹쳐서 볼 수 있게 되어 있습니다.
Location 값을 수정하면 캔들과 따로 overlay 시켜 비교할 수 있습니다.
(이 경우 헤이킨아시의 값은 실제값과 다르니 추세 파악을 위해 사용하시길 권장합니다.)
또, 헤이킨아시를 새 페인으로 옮기면 하단의 보조지표처럼 사용할 수 있습니다.

Rolling Heikin Ashi Candles█ OVERVIEW
This indicator displays a Rolling Heikin Ashi Candles for a given timeframe Multiplier. Contrary to Heikin Ashi Candles Charts, if the timeframe Multiplier is "5", this indicator plots Heikin Ashi Candles OHLC of the last 5 Candles.
█ WHAT IS THE NEED FOR IT
Let's see if we want to use a Higher timeframe OHLC Data using security function or resolution options. The indicator repaints until the higher timeframe Heikin Ashi Candles closes, leading to a repainting strategy or indicator using higher-timeframe data. So we can use Rolling Heikin Ashi Candles in these cases.
█ USES
To Pull out higher timeframe Heikin Ashi Candles OHLC Data to build a non-repainting strategy or indicator.
█ WHY I AM BUILDING THIS SIMPLE INDICATOR
There is no doubt higher timeframe analysis is a critical study to mastering the markets.
I found a necessity for an indicator that analyses multiple higher timeframes and gives us a cumulative or average trend direction. I already built the indicator; I will release it soon. The Indicator I am building is wholly based on my understanding and perspective of Market Structure. Please use this indicator idea to remove the repainting issue when you make an indicator that utilises higher timeframe data.
I am using this in my upcoming indicators. Felt to share before head.
Stay Tuned...
If you have any recommendations or alternative ideas, then please drop a comment under the script ;)


Heikin-Ashi Candle ColoringThis script will change the color of normal candlesticks to the color that the corresponding Heikin-Ashi candles would have.
This allows to spot a trend or a trend reversal just by looking at candles, without using Heikin-Ashi candles, which distort the appearance of a typical chart.

Heikin Ashi Candles [Improved] - real closing priceHeikin Ashi Candles - with real closing price!, and with a Heikin Ashi based moving average!
One of the main functionality of Heikin Ashi is to provide a smoothed price to get clarity in trends. This script builds upon the Heikin Ashi Candlestick I published in 2020 that took the standard Heikin Ashi calculations and added the actual closing price.
The improved version adds a new smoothing calculation to give traders an even better way to display trends. In addition to that, a Heikin Ashi based moving average is added to guide you to take trades in the trend direction. The best part is the users have the ability to display both the real closing price and the Improved Heikin Ashi closing price.
With a few modifications within the smoothing settings, the users can get features like Candle Cloud that provides traders with functionalities like Ichimoku clouds.
Usage:
This indicator serves as a trend tool with enhanced features of the original Heikin Ashi calculations. The indicator help traders to take trades in the same direction of the trend. The new improved version gives traders a new better way to make use of all Heikin Ashi strategies that have been developed during the years. Apply the same methods with this new version.
Disclaimer: No financial advice, only for educational/entertainment purposes.
Heikinashi Candles Biggest problem that when we use normal heikin-ashi candlestick pattern then all applied indicator values also changes
Like Pivot Point with CPR ,,, EMA,,, SMA including VWAP indicator value
So , this indicator help us plot Heikinashi candles on Normal candles
Please follow below steps:
Add this indicator to chart
Go to setting >> un-tick Body, Border and Wick color
That will hide candles on chart and Plot heikinashi candles on Normal candles without changing any indicator value
Remember use normal candle stick pattern that

lib_Indicators_v2_DTULibrary "lib_Indicators_v2_DTU"
This library functions returns included Moving averages, indicators with factorization, functions candles, function heikinashi and more.
Created it to feed as backend of my indicator/strategy "Indicators & Combinations Framework Advanced v2 " that will be released ASAP.
This is replacement of my previous indicator (lib_indicators_DT)
I will add an indicator example which will use this indicator named as "lib_indicators_v2_DTU example" to help the usage of this library
Additionally library will be updated with more indicators in the future
NOTES:
Indicator functions returns only one series :-(
plotcandle function returns candle series
INDICATOR LIST:
hide = 'DONT DISPLAY', //Dont display & calculate the indicator. (For my framework usage)
alma = 'alma(src,len,offset=0.85,sigma=6)', //Arnaud Legoux Moving Average
ama = 'ama(src,len,fast=14,slow=100)', //Adjusted Moving Average
acdst = 'accdist()', //Accumulation/distribution index.
cma = 'cma(src,len)', //Corrective Moving average
dema = 'dema(src,len)', //Double EMA (Same as EMA with 2 factor)
ema = 'ema(src,len)', //Exponential Moving Average
gmma = 'gmma(src,len)', //Geometric Mean Moving Average
hghst = 'highest(src,len)', //Highest value for a given number of bars back.
hl2ma = 'hl2ma(src,len)', //higest lowest moving average
hma = 'hma(src,len)', //Hull Moving Average.
lgAdt = 'lagAdapt(src,len,perclen=5,fperc=50)', //Ehler's Adaptive Laguerre filter
lgAdV = 'lagAdaptV(src,len,perclen=5,fperc=50)', //Ehler's Adaptive Laguerre filter variation
lguer = 'laguerre(src,len)', //Ehler's Laguerre filter
lsrcp = 'lesrcp(src,len)', //lowest exponential esrcpanding moving line
lexp = 'lexp(src,len)', //lowest exponential expanding moving line
linrg = 'linreg(src,len,loffset=1)', //Linear regression
lowst = 'lowest(src,len)', //Lovest value for a given number of bars back.
pcnl = 'percntl(src,len)', //percentile nearest rank. Calculates percentile using method of Nearest Rank.
pcnli = 'percntli(src,len)', //percentile linear interpolation. Calculates percentile using method of linear interpolation between the two nearest ranks.
rema = 'rema(src,len)', //Range EMA (REMA)
rma = 'rma(src,len)', //Moving average used in RSI. It is the exponentially weighted moving average with alpha = 1 / length.
sma = 'sma(src,len)', //Smoothed Moving Average
smma = 'smma(src,len)', //Smoothed Moving Average
supr2 = 'super2(src,len)', //Ehler's super smoother, 2 pole
supr3 = 'super3(src,len)', //Ehler's super smoother, 3 pole
strnd = 'supertrend(src,len,period=3)', //Supertrend indicator
swma = 'swma(src,len)', //Sine-Weighted Moving Average
tema = 'tema(src,len)', //Triple EMA (Same as EMA with 3 factor)
tma = 'tma(src,len)', //Triangular Moving Average
vida = 'vida(src,len)', //Variable Index Dynamic Average
vwma = 'vwma(src,len)', //Volume Weigted Moving Average
wma = 'wma(src,len)', //Weigted Moving Average
angle = 'angle(src,len)', //angle of the series (Use its Input as another indicator output)
atr = 'atr(src,len)', //average true range. RMA of true range.
bbr = 'bbr(src,len,mult=1)', //bollinger %%
bbw = 'bbw(src,len,mult=2)', //Bollinger Bands Width. The Bollinger Band Width is the difference between the upper and the lower Bollinger Bands divided by the middle band.
cci = 'cci(src,len)', //commodity channel index
cctbb = 'cctbbo(src,len)', //CCT Bollinger Band Oscilator
chng = 'change(src,len)', //Difference between current value and previous, source - source .
cmo = 'cmo(src,len)', //Chande Momentum Oscillator. Calculates the difference between the sum of recent gains and the sum of recent losses and then divides the result by the sum of all price movement over the same period.
cog = 'cog(src,len)', //The cog (center of gravity) is an indicator based on statistics and the Fibonacci golden ratio.
cpcrv = 'copcurve(src,len)', //Coppock Curve. was originally developed by Edwin "Sedge" Coppock (Barron's Magazine, October 1962).
corrl = 'correl(src,len)', //Correlation coefficient. Describes the degree to which two series tend to deviate from their ta.sma values.
count = 'count(src,len)', //green avg - red avg
dev = 'dev(src,len)', //ta.dev() Measure of difference between the series and it's ta.sma
fall = 'falling(src,len)', //ta.falling() Test if the `source` series is now falling for `length` bars long. (Use its Input as another indicator output)
kcr = 'kcr(src,len,mult=2)', //Keltner Channels Range
kcw = 'kcw(src,len,mult=2)', //ta.kcw(). Keltner Channels Width. The Keltner Channels Width is the difference between the upper and the lower Keltner Channels divided by the middle channel.
macd = 'macd(src,len)', //macd
mfi = 'mfi(src,len)', //Money Flow Index
nvi = 'nvi()', //Negative Volume Index
obv = 'obv()', //On Balance Volume
pvi = 'pvi()', //Positive Volume Index
pvt = 'pvt()', //Price Volume Trend
rise = 'rising(src,len)', //ta.rising() Test if the `source` series is now rising for `length` bars long. (Use its Input as another indicator output)
roc = 'roc(src,len)', //Rate of Change
rsi = 'rsi(src,len)', //Relative strength Index
smosc = 'smi_osc(src,len,fast=5, slow=34)', //smi Oscillator
smsig = 'smi_sig(src,len,fast=5, slow=34)', //smi Signal
stdev = 'stdev(src,len)', //Standart deviation
trix = 'trix(src,len)' , //the rate of change of a triple exponentially smoothed moving average.
tsi = 'tsi(src,len)', //True Strength Index
vari = 'variance(src,len)', //ta.variance(). Variance is the expectation of the squared deviation of a series from its mean (ta.sma), and it informally measures how far a set of numbers are spread out from their mean.
wilpc = 'willprc(src,len)', //Williams %R
wad = 'wad()', //Williams Accumulation/Distribution.
wvad = 'wvad()' //Williams Variable Accumulation/Distribution.
}
f_func(string, float, simple, float, float, float, simple) f_func Return selected indicator value with different parameters. New version. Use extra parameters for available indicators
Parameters:
string : FuncType_ indicator from the indicator list
float : src_ close, open, high, low,hl2, hlc3, ohlc4 or any
simple : int length_ indicator length
float : p1 extra parameter-1. active on Version 2 for defining multi arguments indicator input value. ex: lagAdapt(src_, length_,LAPercLen_=p1,FPerc_=p2)
float : p2 extra parameter-2. active on Version 2 for defining multi arguments indicator input value. ex: lagAdapt(src_, length_,LAPercLen_=p1,FPerc_=p2)
float : p3 extra parameter-3. active on Version 2 for defining multi arguments indicator input value. ex: lagAdapt(src_, length_,LAPercLen_=p1,FPerc_=p2)
simple : int version_ indicator version for backward compatibility. V1:dont use extra parameters p1,p2,p3 and use default values. V2: use extra parameters for available indicators
Returns: float Return calculated indicator value
fn_heikin(float, float, float, float) fn_heikin Return given src data (open, high,low,close) as heikin ashi candle values
Parameters:
float : o_ open value
float : h_ high value
float : l_ low value
float : c_ close value
Returns: float heikin ashi open, high,low,close vlues that will be used with plotcandle
fn_plotFunction(float, string, simple, bool) fn_plotFunction Return input src data with different plotting options
Parameters:
float : src_ indicator src_data or any other series.....
string : plotingType Ploting type of the function on the screen
simple : int stochlen_ length for plotingType for stochastic and PercentRank options
bool : plotSWMA Use SWMA for smoothing Ploting
Returns: float
fn_funcPlotV2(string, float, simple, float, float, float, simple, string, simple, bool, bool) fn_funcPlotV2 Return selected indicator value with different parameters. New version. Use extra parameters fora available indicators
Parameters:
string : FuncType_ indicator from the indicator list
float : src_data_ close, open, high, low,hl2, hlc3, ohlc4 or any
simple : int length_ indicator length
float : p1 extra parameter-1. active on Version 2 for defining multi arguments indicator input value. ex: lagAdapt(src_, length_,LAPercLen_=p1,FPerc_=p2)
float : p2 extra parameter-2. active on Version 2 for defining multi arguments indicator input value. ex: lagAdapt(src_, length_,LAPercLen_=p1,FPerc_=p2)
float : p3 extra parameter-3. active on Version 2 for defining multi arguments indicator input value. ex: lagAdapt(src_, length_,LAPercLen_=p1,FPerc_=p2)
simple : int version_ indicator version for backward compatibility. V1:dont use extra parameters p1,p2,p3 and use default values. V2: use extra parameters for available indicators
string : plotingType Ploting type of the function on the screen
simple : int stochlen_ length for plotingType for stochastic and PercentRank options
bool : plotSWMA Use SWMA for smoothing Ploting
bool : log_ Use log on function entries
Returns: float Return calculated indicator value
fn_factor(string, float, simple, float, float, float, simple, simple, string, simple, bool, bool) fn_factor Return selected indicator's factorization with given arguments
Parameters:
string : FuncType_ indicator from the indicator list
float : src_data_ close, open, high, low,hl2, hlc3, ohlc4 or any
simple : int length_ indicator length
float : p1 parameter-1. active on Version 2 for defining multi arguments indicator input value. ex: lagAdapt(src_, length_,LAPercLen_=p1,FPerc_=p2)
float : p2 parameter-2. active on Version 2 for defining multi arguments indicator input value. ex: lagAdapt(src_, length_,LAPercLen_=p1,FPerc_=p2)
float : p3 parameter-3. active on Version 2 for defining multi arguments indicator input value. ex: lagAdapt(src_, length_,LAPercLen_=p1,FPerc_=p2)
simple : int version_ indicator version for backward compatibility. V1:dont use extra parameters p1,p2,p3 and use default values. V2: use extra parameters for available indicators
simple : int fact_ Add double triple, Quatr factor to selected indicator (like converting EMA to 2-DEMA, 3-TEMA, 4-QEMA...)
string : plotingType Ploting type of the function on the screen
simple : int stochlen_ length for plotingType for stochastic and PercentRank options
bool : plotSWMA Use SWMA for smoothing Ploting
bool : log_ Use log on function entries
Returns: float Return result of the function
fn_plotCandles(string, simple, float, float, float, simple, string, simple, bool, bool, bool) fn_plotCandles Return selected indicator's candle values with different parameters also heikinashi is available
Parameters:
string : FuncType_ indicator from the indicator list
simple : int length_ indicator length
float : p1 parameter-1. active on Version 2 for defining multi arguments indicator input value. ex: lagAdapt(src_, length_,LAPercLen_=p1,FPerc_=p2)
float : p2 parameter-2. active on Version 2 for defining multi arguments indicator input value. ex: lagAdapt(src_, length_,LAPercLen_=p1,FPerc_=p2)
float : p3 parameter-3. active on Version 2 for defining multi arguments indicator input value. ex: lagAdapt(src_, length_,LAPercLen_=p1,FPerc_=p2)
simple : int version_ indicator version for backward compatibility. V1:dont use extra parameters p1,p2,p3 and use default values. V2: use extra parameters for available indicators
string : plotingType Ploting type of the function on the screen
simple : int stochlen_ length for plotingType for stochastic and PercentRank options
bool : plotSWMA Use SWMA for smoothing Ploting
bool : log_ Use log on function entries
bool : plotheikin_ Use Heikin Ashi on Plot
Returns: float

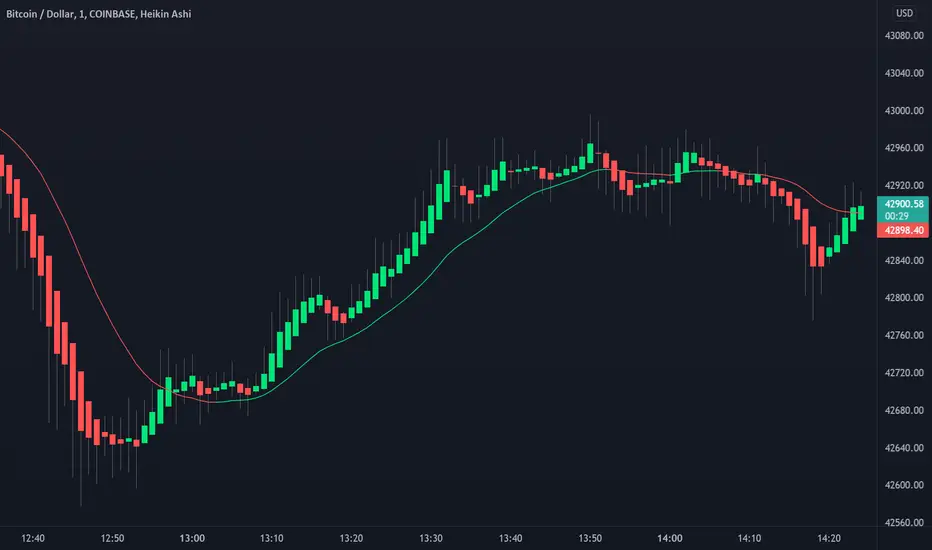
Awesome Heikin Ashi [Morty]This indicator uses Heikin Ashi candles and two EMAs to help you follow the trend and enter the trade. Heikin Ashi candles help to smooth the price and EMAs are used to detect trend. The default parameter of EMA is EMA10 and EMA20. You can use it at any timeframe. You should always adjust the EMA length according to different timeframes.
Features:
- Highlight background based on two EMAs
- Adjustable EMA length
- Adjustable Label size
- Show entry and exit signal labels
- Show stoploss price
- You can choose Long only or Short only or both signals
- Alert functions for notification
NOTE: If you use this signal to enter a trade, make sure the candle is close and enter in the next candle.

HTF Candles by DGThigher timeframe (multi timeframe) candles
a simple study introducing new pine function box.new

[jav] HeikinAshized OscillatorsThis script allows to HeikinAshize different commonly used centered oscillators.
It plots them like Heikin Ashi candles. In this way, we can eliminate some of the noise and uncertainty that is inherent to applying only one calculation period to the oscillators.
Applying Heikin Ashi to an oscillator might be advantageous compared to applying it directly to the chart, because you are not altering price readings. The obvious advantage is the clear visualization of the trend directions without noise.
INPUTS
The oscillators included are:
Relative Strength Index (RSI)
Stochastic
Stochastic RSI
Fisher transform
Inverse Fisher Transform of RSI (IFTRSI)
Commodity Channel Index (CCI)
Money Flow Index (MFI)
Chande Momentum Oscillator (CMO)
Momentum (MOM)
True Strength Index (TSI)
Williams' Percent Range (WPR).
Apart from the choice of one of these indicators, only two more inputs are required:
the main (median) period and
the % of variability of this period.
RESULTS
The script calculates 4 evenly spaced periods from that data (period and variability), e.g. for a period of 50 and a variability of 30%, the script calculates oscillator values for 4 different periods evenly spaced around 50, (35, 45, 55, 65) and uses these 4 values to draw the Heikin Ashi candle.
The script also plots the usual upper/lower (overbought/oversold) values, as well as the central line.
CREDITS
The interesting concept of applying Heikin Ashi to an oscillator was recently introduced in Tradingview by @JayRogers . Many thanks for the idea.
For Heikin Ashi calculations, the useful script by @allanster was taken as a reference.
Any improvements, modifications or suggestions are welcome.

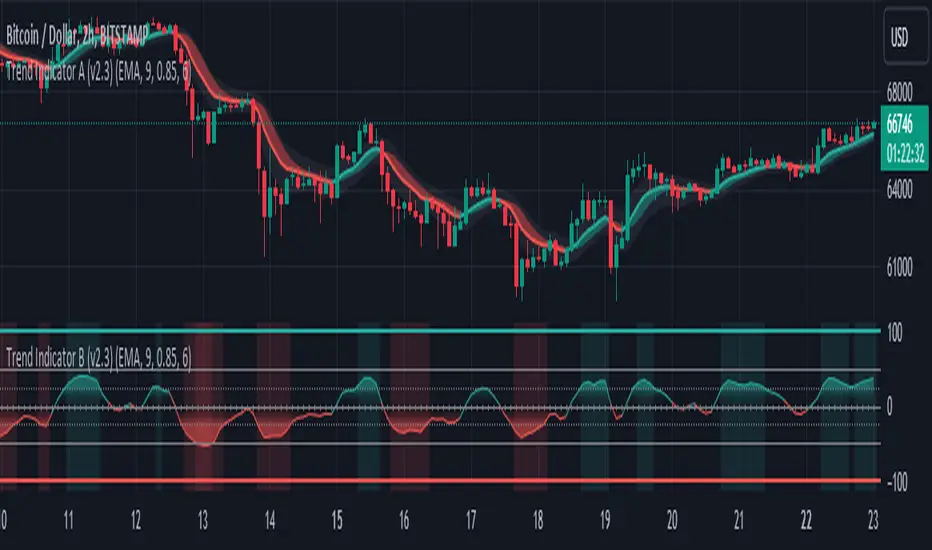
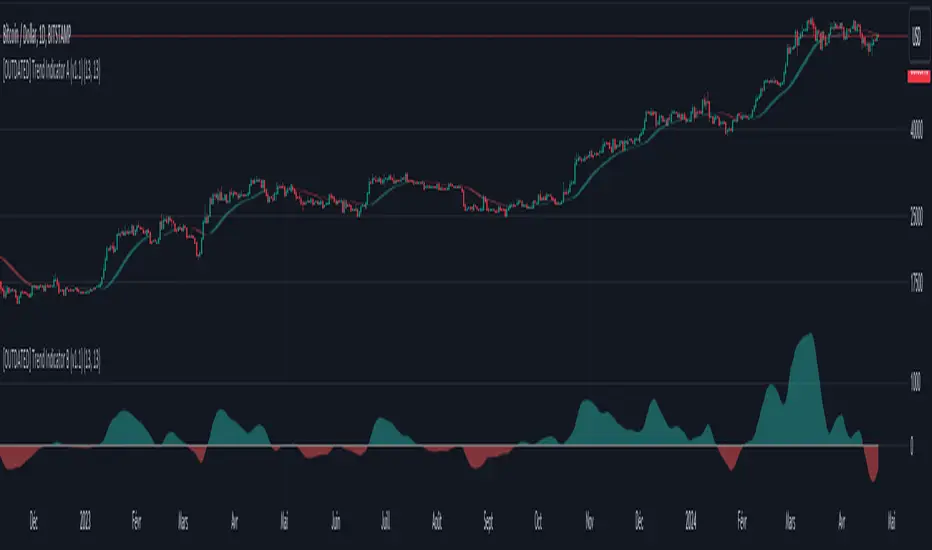
Trend Indicator B-V2 (Momentum measuring)"Trend Indicator A-V2" and "Trend Indicator B-V2" are updated and improved versions of my initial trend indicators. Totally rethinking the code, adding highs and lows in the calculations, including some more customisation through colour schemes.
In practice, this indicator uses EMAs and Heikin Ashi to provide an overall idea of the trend.
The "Trend Indicator A-V2" is an overlay showing “Smoothed Heikin Ashi” .
The "Trend Indicator B-V2" uses the same values in a different way to measure the momentum of the trend and identify potential trend rejections.
Please, take into account that it is a lagging indicator.
Dziwne Trend Indicator A (EMA + Heikin Ashi cloud)First script ever publish.
It is a very simple trend indicator based on EMAs and Heikin Ashi .
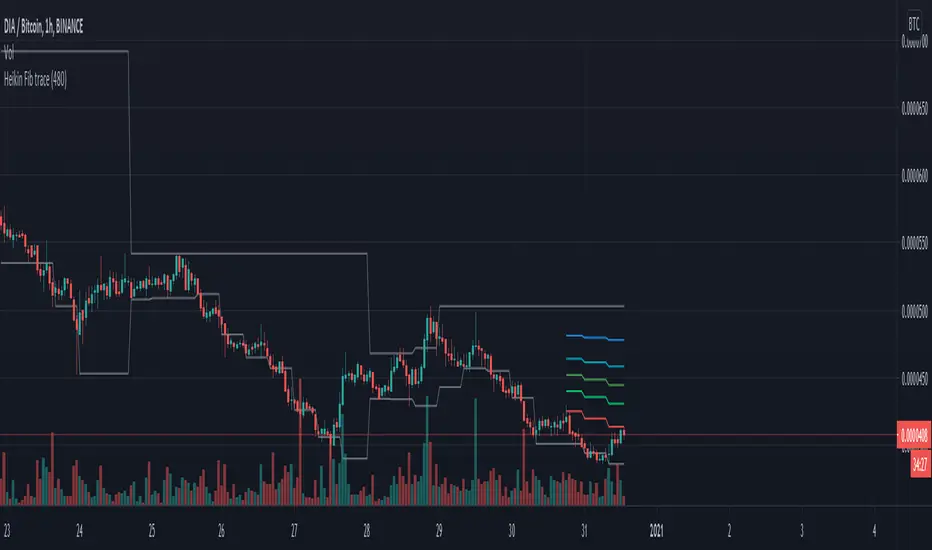
HeikinAshi Fibonacci Retracement v2It draws Fib retracements based on the highest high measured when HeikinAshi candles are green, and lows based on when HeikinAshi candles are red.
The idea is that you can see the fib retracements based on HeikinAshi trends on a larger timeframe to help trade in smaller timeframes.
for v2 I reset the fib trace when a new high is set and also at the second green heikin candle. And I only show the last 20 bars of fib lines to avoid confusion and focus on the current trade.
Happy trading!
Heikin Ashi Candles - Actual CloseHeikin Ashi Candles - Actual Close is a simple script that instead of displaying Heikin Ashi Close it displays the actual close.
This script is a handy tool for anyone that wants to use Heikin Ashi candles that displays the real close. The coloring of the candles is still based on the Heikin Ashi calculations.
Enjoy.

QuantNomad - Heikin-Ashi PSAR AlertsUsing this script you can create alerts for my Heikin-Ashi PSAR Strategy:
When creating alerts use "Once Per Bar Close" in parameters.
####################
Disclaimer
Please remember that past performance may not be indicative of future results.
Due to various factors, including changing market conditions, the strategy may no longer perform as good as in historical backtesting.
This post and the script don’t provide any financial advice.
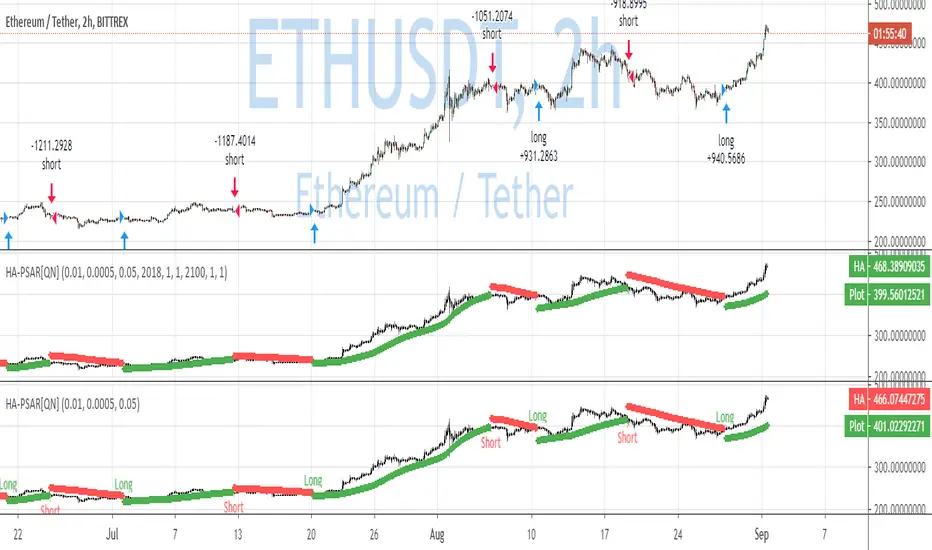
QuantNomad - Heikin-Ashi PSAR StrategyContinue experimenting with different combinations of strategies.
Here is the PSAR Strategy calculated based on HA candles. HA is already calculated inside the script, do not apply it to HA candles.
Strategy is calculated based on 25% equity invested with 0.1% commission.
####################
Disclaimer
Please remember that past performance may not be indicative of future results.
Due to various factors, including changing market conditions, the strategy may no longer perform as good as in historical backtesting.
This post and the script don’t provide any financial advice.

Ranged Volume - evoA simple script that shows mirrored regular volume bars with the purpose to show break-outs and low volume ranges, using highest and lowest of a few bars back.
Use Heikin Ashi function to smooth the colors with the trend.

Volume Moving Average - evoThis script shows regular volume bars with two separate moving averages using only bullish and only bearish candles. The moving average uses the last known value of its calculation.
Using the Heikin Ashi function will smooth the colors and moving averages (good for trends):
The crossovers are a good way to see what the dominant direction of a trend is, if you test them on your time frame and instrument they might be good to trade on their own, I have not tested this and the default settings are not tuned for that.
As always, let me know if you like it or found a good way to use it :)

