RSI Divergence and Convergence Finder-ShayanDST001//@version=5
indicator("RSI Divergence and Convergence Finder", overlay=true)
// Input parameters
rsiLength = input.int(14, title="RSI Length")
overbought = input.int(70, title="Overbought Level")
oversold = input.int(30, title="Oversold Level")
lookback = input.int(5, title="Lookback Period for Divergence/Convergence")
// Calculate RSI
rsiValue = ta.rsi(close, rsiLength)
// Find peaks and troughs for price and RSI
priceHigh = ta.highest(high, lookback)
priceLow = ta.lowest(low, lookback)
rsiHigh = ta.highest(rsiValue, lookback)
rsiLow = ta.lowest(rsiValue, lookback)
// Bullish Divergence: Price makes lower lows, RSI makes higher lows
bullishDivergence = (priceLow == low) and (rsiLow > rsiValue) and (rsiValue > oversold)
// Bearish Divergence: Price makes higher highs, RSI makes lower highs
bearishDivergence = (priceHigh == high) and (rsiHigh < rsiValue) and (rsiValue < overbought)
// Bullish Convergence: Price makes higher highs, RSI makes higher highs
bullishConvergence = (priceHigh == high) and (rsiHigh > rsiValue) and (rsiValue < overbought)
// Bearish Convergence: Price makes lower lows, RSI makes lower lows
bearishConvergence = (priceLow == low) and (rsiLow < rsiValue) and (rsiValue > oversold)
// Plot arrows on the chart
plotshape(series=bullishDivergence, title="Bullish Divergence", location=location.belowbar, color=color.green, style=shape.labelup, text="Bull Div")
plotshape(series=bearishDivergence, title="Bearish Divergence", location=location.abovebar, color=color.red, style=shape.labeldown, text="Bear Div")
plotshape(series=bullishConvergence, title="Bullish Convergence", location=location.belowbar, color=color.blue, style=shape.labelup, text="Bull Conv")
plotshape(series=bearishConvergence, title="Bearish Convergence", location=location.abovebar, color=color.orange, style=shape.labeldown, text="Bear Conv")
// Plot RSI for reference
hline(overbought, "Overbought", color=color.red)
hline(oversold, "Oversold", color=color.green)
plot(rsiValue, title="RSI", color=color.purple)
Divergence RSI baissière cachée
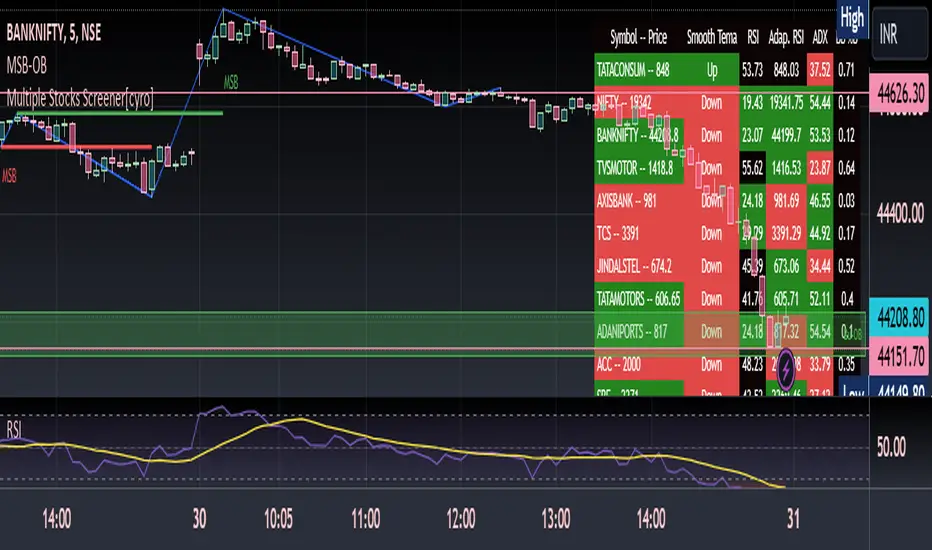
Multiple Indicators ScreenerThis is a stock screener that incorporates open source code by QuantNomad, with the addition of slow and fast EMA pullback and crossover functions. It is designed for intraday scalping and quick trades, using 1, 3, and 5 minute candles. The RSI, Supertrend, and ADX indicators help to confirm trade setups, and the use of discount, premium, and equilibrium zones can improve results. With the ability to screen 40 stocks, the screener ensures that no quick action is missed. ]
Disclaimer
It is important to note that any trade initiated using this screener should be well researched, as the creator is not responsible for any profit or loss incurred.