Intraday Intensity ModesIntraday Intensity Index was created by David Bostian and its use was later featured by John Bollinger in his book "Bollinger on Bollinger Bands" . It is categorically a volume indicator and considered to be a useful tool for analyzing supply and demand dynamics in the market. By measuring the level of buying and selling pressure within a given trading session it attempts to provide insights into the strength of market participants' interest and their aggressiveness in executing trades throughout the day. It can be used in conjunction with Bollinger Bands® or other envelope type indicators as a complimentary indicator to aid in trying to identify potential turning points or trends.
Intraday intensity is calculated based upon the relationship between the price change and the volume of shares traded during each daily interval. It aims to capture the level of buying or selling activity relative to the overall volume. A high intraday intensity value suggests a higher level of buying or selling pressure, indicating a more active and potentially volatile market. Conversely, a low intraday intensity value indicates less pronounced trading activity and a potentially quieter market. Overall, intraday intensity provides a concise description of the intensity of trading activity during a particular trading session, giving traders an additional perspective on market dynamics. Note that because the calculation uses volume this indicator will only work on symbols where volume is available.
While there are pre-existing versions within community scripts, none were found to have applied the calculations necessary for the various modes that are presented within this version, which are believed to be operating in the manner originally intended when first described by Bostian and again later by Bollinger. When operating in default modes on daily or lower chart timeframes the logic used within this script tracks the intraday high, low, close and volume for the day with each progressing intraday bar.
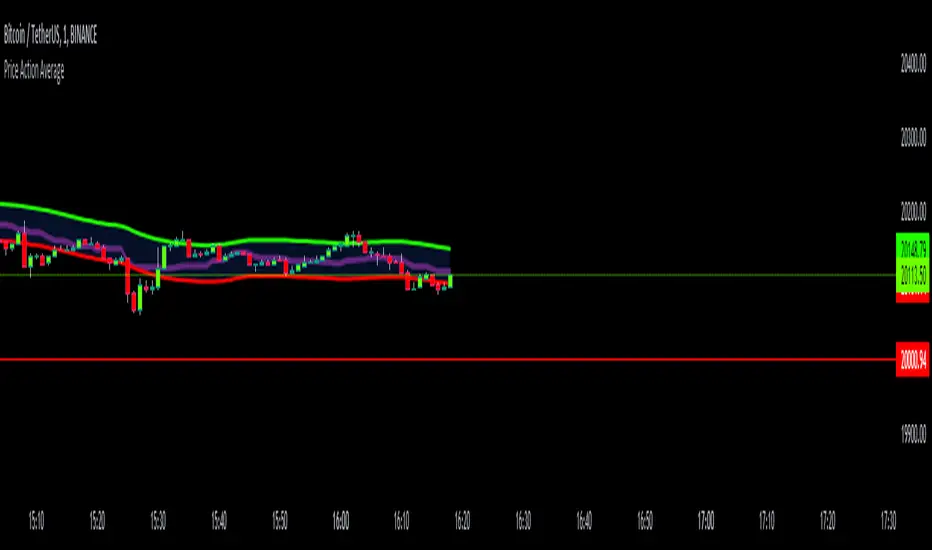
The BB indicator was included on the top main chart to help illustrate example usage as described below. The Intraday Intensity Modes indicator is pictured operating in three different modes beneath the main chart:
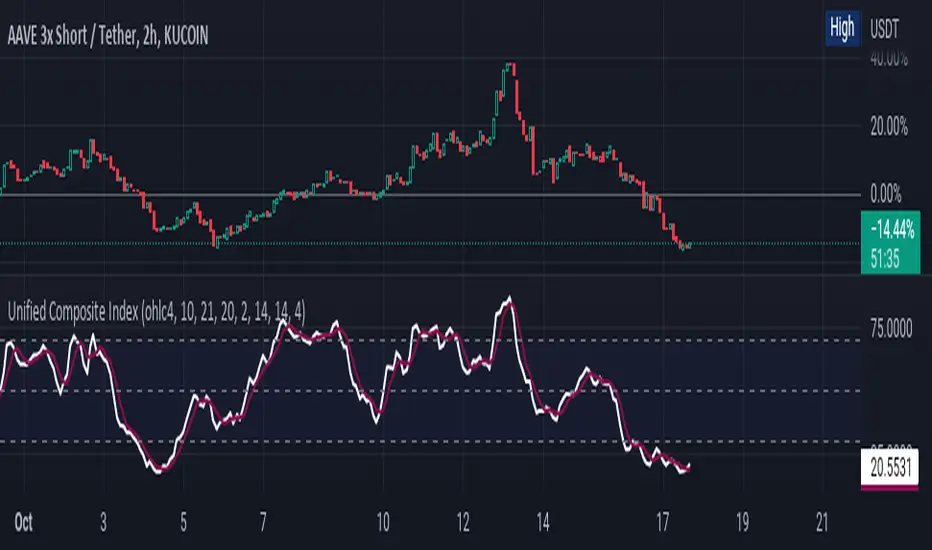
• The top pane beneath the main chart shows the indicator operating as a normalized 21 day II% oscillator. A potential use while in this mode would be to look for positive values as potential confirmation of strength when price tags the upper or lower Bollinger bands, and to look for negative values as potential confirmation of weakness when price tags the upper or lower Bollinger bands.
• The middle pane shows the indicator operating as an "open ended" cumulative sum of II. A potential use while in this mode would be to look for convergence or divergence of trend when price is making new highs or lows, or while price is walking the upper or lower Bollinger bands.
• The bottom pane shows the indicator operating in standard III mode, which provides independent values per session.
Indicator Settings: Inputs tab:
Osc Length : Set to 1 disables oscillation, values greater than 1 enables oscillation for II% (Intraday Intensity percent) mode.
Tootip : Hover mouse over (i) to show recommended example Settings for various modes.
Cumulative : When enabled values are cumulatively summed for the entire chart and indicator operates in II mode.
Normalized : When enabled a rolling window of Osc Length values are summed and normalized to the rolling window's volume.
Intrabar : When enabled price range and volume are evaluated for intensity per bar instead of per day which is a departure from the original
concept. Whenever this setting is enabled the indicator should be regarded as operating in an experimental mode.
Colors For Up Down : Sets the plot colors used, may be overridden in Settings:Style tab.
Styles / Width : Sets the plot style and width used, may be overridden in Settings:Style tab.
This indicator is designed to work with any chart timeframe, with the understanding that when used on timeframes higher than daily the indicator becomes "IntraPeriod" intensity, for example on weekly bars it would be "IntraWeek" intensity. On Daily or lower timeframes the indicator operates as "IntraDay" intensity and is being updated on each bar as each day progresses. If the experimental setting Intrabar is enabled then the indicator operates as "IntraBar" intensity and is no longer constrained to daily or higher evaluations, for example with Intrabar enabled on a 4H timeframe the indicator would operate as "Intra4H" intensity.
NOTICE: This is an example script and not meant to be used as an actual strategy. By using this script or any portion thereof, you acknowledge that you have read and understood that this is for research purposes only and I am not responsible for any financial losses you may incur by using this script!
Indicateur Pine Script®