TZ - India VIX Volatility ZonesTZ – India VIX Volatility Zones is a long-term volatility analysis indicator designed to visually map important India VIX regimes using clearly defined horizontal zones and labels.
The indicator highlights how market volatility cycles between complacency, normal conditions, elevated risk, and panic phases. These zones are based on historical behavior of India VIX and help traders understand when risk is underpriced or overstretched.
This tool is especially useful for:
Index traders
Options sellers and buyers
Risk management and regime filtering
Long-term volatility study
How It Works
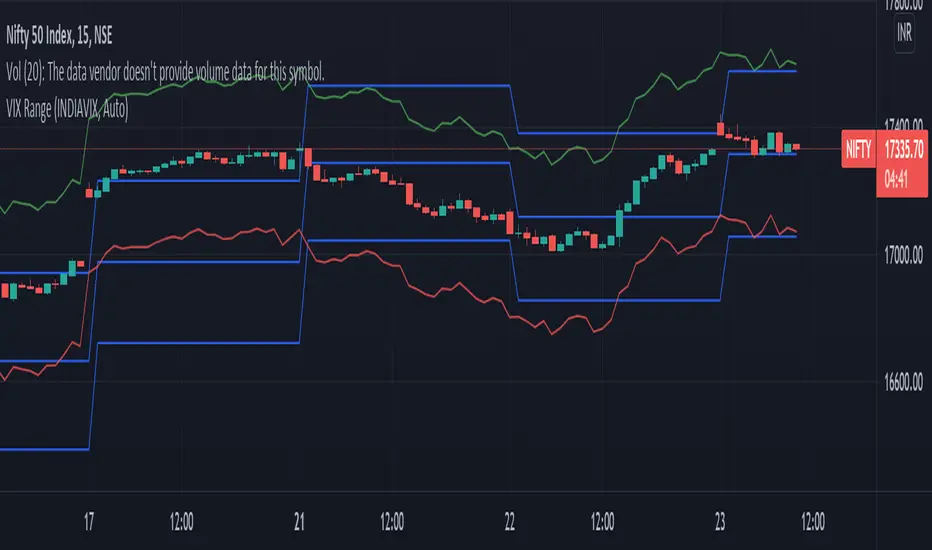
The script plots static, historically significant volatility zones on the India VIX chart and visually separates them using shaded bands and labels.
Volatility Zones Explained
1.Extreme Low Volatility (VIX 8–10)
Indicates market complacency and underpriced risk. Often precedes volatility expansion.
2.Low Volatility (VIX 10–13)
Stable market conditions with controlled movement.
3.Normal Volatility (VIX 13–18)
Healthy market behavior and balanced risk.
4.High Volatility (VIX 18–25)
Rising uncertainty and increased intraday swings.
5.Panic Zone (VIX 25–35+)
High fear environment, usually during major events or crises.
How Traders Can Use This Indicator
Identify volatility regimes before choosing option strategies
Avoid aggressive short-volatility trades during extreme zones
Prepare for volatility expansion during low-VIX phases
Use as a market risk context tool alongside price action
This indicator does not provide buy/sell signals. It is designed for contextual analysis and decision support.
Best Usage
Apply on India VIX (NSE:INDIAVIX)
Works best on Weekly and Monthly timeframes
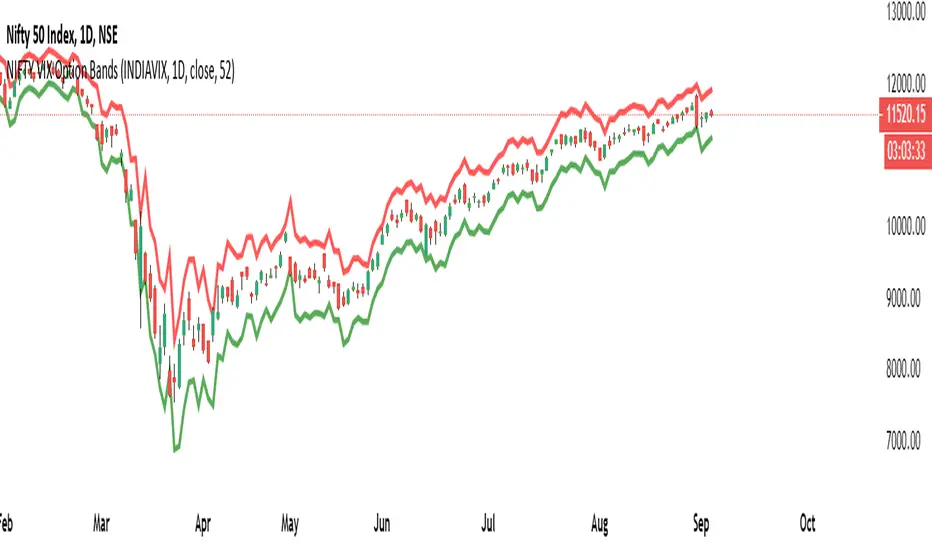
Can be combined with index charts for volatility-based risk assessment
Disclaimer
This indicator is for educational and analytical purposes only.
It does not constitute financial advice or trade recommendations.
Users should apply proper risk management and confirm signals using additional analysis.
Indicateur Pine Script®