Intraday Trading Tool [VK]This Indicator is all you need to day trade.
Overview: This is a intraday/scalp trading Indictor works using MTF- MA,MACD,RSI for trend ,SRSI For Entries , Murrey Lines for Targets and ATR For Stop Loss , it is designed for all type of markets (crypto, forex, stocks, commodity etc.) and works on all commonly used timeframes .
About The Indicator :
This indicator uses the most commonly used indicators in The markets, MA channel + MACD (Background Trend) + RSI (Trend On Top) . This Three Indicators Are Used For Trend In Higher Time Frame. We Have to take trades based on Trend In Higher Time Frames. We are using SRSI For entries which Has the function to show entries from Higher Time Frames .
Stop Loss And Take Profit : we have used ATR for Stop Loss which will show up with Buy/Sell Signals. and for Taking Profit We Have used Murrey Lines Which Can be used to see Support/Resistance as Targets And also has the function to show Support/Resistance from Higher Time Frame.
Extra Function :
The Cross And Triangles On the Bottom of the Chart Indicates MACD Cross on Higher Time Frames .
How to get access:
Send a Private Massage for getting access to the script.
Intraday

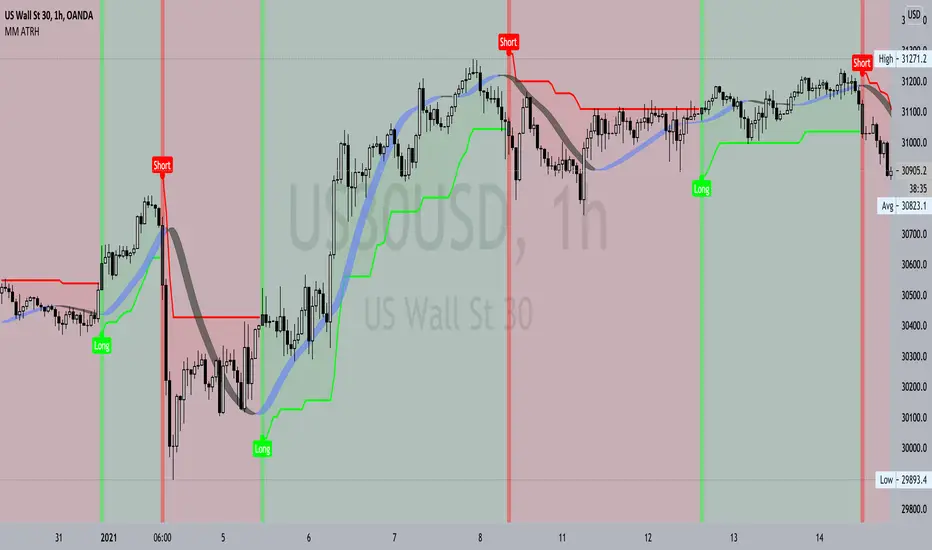
MM AverageTrueRangehUllFeatures:
- Powerful 2 calculation used in one. Average True Range Multiplier & Sensitivity.
- Clearly shows trend direction, volatility , momentum & sentiment of any financial market.
- Dynamic stop loss levels formed by the help of average true range calculation which are produce right from the long or short signal and does stretch until the opposite directional signal appears.
- Generates potential long and short trade signals using complex formula of volatility , momentum and trend following.
- ATR calculation method can be changed from normal (ATR) to SMA version true range inside setting by ticking or unticking the input function named “Change ATR Calculation Method?”.
- Long and short signals labels can be turn off/on using “Reveal Long/Short Signals?”. - Background color can be shown/hidden using “Signal-light Show/Hide?”.
- Alert feature available for long and short signals.
Important two main settings of ATRH indicator:
1. ATR Multiplier
o A retail trader should adjust the setting depending on the financial market, instrument and timeframe as per required.
o Basically, higher timeframe has more range in price so ATR multiplier can be set higher.
o ATR multiplier value lower can produce more signals which will be as more trades opportunities but it can also lead to fake signals. 3-5 value is producing reasonable signals in any timeframe either it be lower or it be higher. If a trader by mistake doesn’t set a proper input value then the whole indicator could even function poorly so this setting must be used wisely.
2. Sensitivity
o Sensitivity can be from 0 to 1. It can be also integer or floating-point number example: 0.1, 0.3, 0.8 etc.
o It is used to control the signal generation speed by 3 to 5 candle bars before (if the value is set higher) or after (if the value is set lower) during the time of condition meeting for either long or short signals.
o Depending on any financial market or instrument sensitivity value should be managed well by a trader for his/her needs taking consideration on the nature of that particular financial market or instrument & timeframe.
Use link below or PM us for access you this indicator. Happy Trading
Key Levels SpacemanBTC IDWMKey levels, plotted automatically
Additional timeframes can be added on request
Useful for seeing strength of the trend in the market

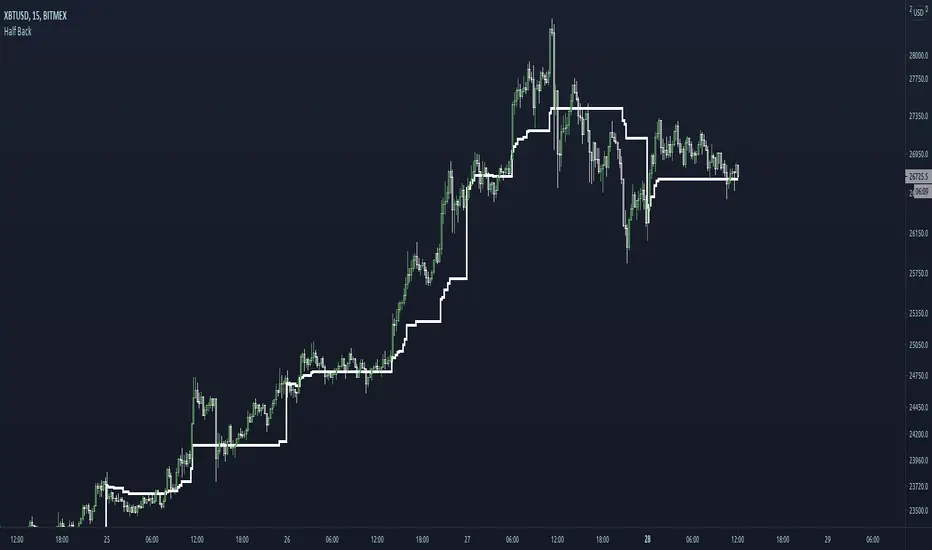
Half BackA dynamic intraday midpoint for Day Timeframe trader reference.
Midpoint is halfway between the day's highest high and lowest low.
Midpoint resets daily.
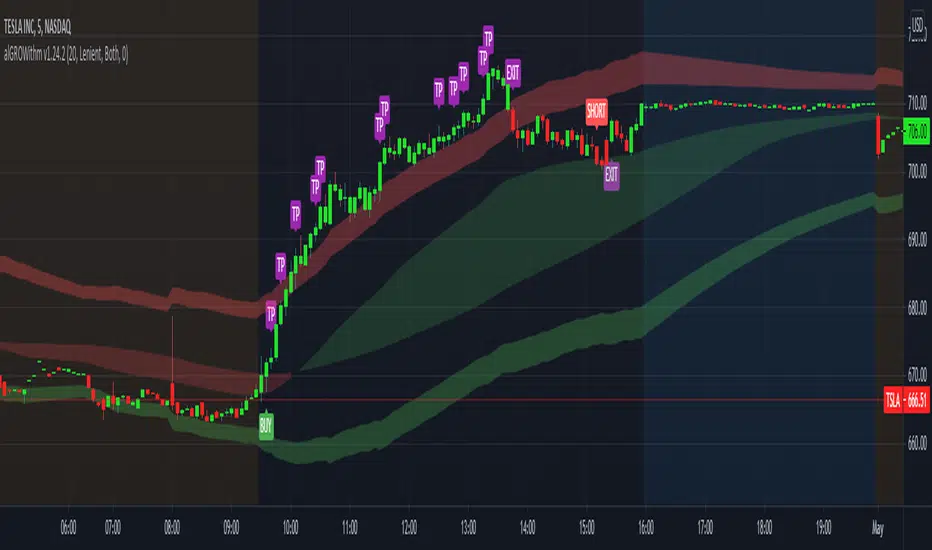
alGROWithm PremiumIntroducing the alGROWithm indicator!
Years of trading experience and endless hours of screen time has undeniably proven to me that the most fundamental rule of any market is: price moves from supply to supply and demand to demand. Specifically, this means that a breakout of a supply zone , the probability of it reaching the next supply zone before starting consolidate is very high. Similarly, a breakdown from previous demand zone will likely continue to the next demand zone . The identification method of these supply and demand channels is one of the features that sets this indicator apart from other available tools.
What separates alGROWithm from other available tools?
- Proprietary method for identifying supply & demand channels combined with a directional bias computation based on recent historical prices
- Only signaling precise entries based on supply & demand that maximize R/R
- Tracking open positions and displaying a trading plan directly on the chart immediately after signaling entry points
- Indicating precise exit levels to help you avoid exiting too early or trading by emotion
What are the features included in alGROWithm?
Trading Plan Lines : These are the Buy/Short/Take Profit/Exit lines plotted directly on the chart
Show Long Signals : These are the green "BUY" labels that appear on the chart when alGROWithm identifies a critical breakout to the next supply level
Show Short Signals : These are the red "SHORT" labels that appear on the chart when alGROWithm identifies a critical breakdown to the next demand level
Show Take Profit Signals : These are the purple "TP" labels that appear on the chart when alGROWithm identifies that the subsequent supply/ demand level has been hit
Show Exit/Stop Loss Signals : These are the purple "EXIT" labels that appear on the chart when alGROWithm identifies that the trade has run its course and it's time to exit
Show Dashboard : This is a dashboard that is displayed to the right of the latest candle, and contains the following information:
- Current Position : "Long", "Short", or "None"
- Next Profit Target : Only displays if there is an active Position
- Current Bias : alGROWithm computes a directional bias based on recent historical prices. Text will say "Long" or "Short"
- Long/Short Bias Until : alGROWithm's bias will change if this price is hit. Note that these are not BUY or SELL levels - this simply indicates whether things are looking up or down
- Enter Short/Long At : Only displays if Current Position = "None"
Note that you can enable/disable any of these chart overlays at anytime through the indicator settings.
The alGROWithm indicator works on any timeframe, any market, and standard OR Heikin Ashi candlesticks .
I have been working very hard on this indicator and I personally use it on a daily basis with options trading. I am so excited to share the wealth with you!
You can use the link below to visit our website and gain access to the script.
GMS: Market Performance IndicatorThis is just an easy way to visualize what the market's performance is (in price or percent) in any given session for any chosen time frame. The magnitude of price moves are not the same today as they were 50 years ago, which is why I included the percent selection to better compare historical movements. Time frame selections are Daily, Weekly, Monthly, Quarterly, and Yearly. I added in a little background highlight to show the start of a new session as well.
The source code is open so feel free to poke around!
Hope this helps,
Andre

MAST TrendHello Traders !!
This is a simple super trend based MAST trend.
By default the supertrend is 10 period with 3 ATR multiplier.
A moving average is used to benefit from the pullback entries.
Bullish Pullback : Price above Supertrend & below MA
Bullish: Price above Supertrend and above MA
Bearish pullback : Price below Supertrend & above MA
Bearish : Price below Supertrend & below MA
Refer to investopedia or any relevant articles for in detail about Supertrend.

Vwap Pvwap Intraday Trend - NiftyKishoreHello Traders !!
This is a simple trend identification script which is based on the current vwap (Cvwap) and previous vwap (Pvwap).
Pvwap in the sense; previous day vwap closing value.
Bullish: price is closing above the current day vwap and previous day vwap(pvwap).
Bearish : Price is closing below the current day vwap and previous day vwap (pvwap).
Made a change to the barcolors as well :)
Bullish
Green Bar: close is above Pvwap and Cvwap.
Blue bar: close is above Pvwap but below Cwap.
Bearish
Red bar: close is below Pvwap and Cvwap.
Purple bar: close is below Pvwap but above Cvwap.
Simple but effective
Cheers !!
Intraday Caja de AlfredoThis indicator is not a strategy by itself, and only works intraday.
A box will start to draw an hour after the market open and continue being drawn for the next two hours. This is being done due to the theory of it being the time where small investors and institutions are moving the price with less volatility than the first hour.
Once the Box has been closed support and resistance of the day will be drawn. Price should try remaining between t his two.
There are alerts for the breakthrough of the box to either upside or downside. This should be followed by a corresponding direction candle pattern, in order to expect a higher/lower break.

Intraday Mid PointA moving indicator that is overlaid main chart. Identifies the start of the day, and then applies this formula:
( Current High of Day + Current Low of Day ) / 2, to get the mid point. It is a useful tool to identify buy side or sell side control, along with vwap.

Delta Volume Weighted - IntradayResets at the start of the day's session (9:50 am on the ASX).
Takes the first candle and checks if its a green candle (close > open), and adds the volume to a total (which starts at 0 at the start of the day).
Subtracts it if the candles in red.
Continues to do this along with all the candles.
The volume is also multiplied by the difference between open and close so that large candles with large volume have more weight and move the indicator more.

Confluence of Indicators and Signals v1 skvWhy this script
This script will display the buy or sell signals received from indicators, super trend, adx, rsi, macd, sma, and floor pivots along with some tweaked calculations and fixed numbers. This is useful for beginners who want to study the signals and timing to practice. This script is created for educational purpose and can be used for intraday scalping with 5 minutes time frame only after the signals are understood clearly.
How to use
Strong Buy - when series of buy/long signals generated by indicators, bright green up arrow indicates momentum/strength
Strong Sell - when series of sell/short signals generated by indicators, bright orange down arrow indicates momentum/strength
Exits - use the pivot lines, or the RSI-LX, SX exit signals. Also combine with Bollinger Bands to understand the exit points.
Look for reversals at pivot resistance and support.
Disclaimer
1. Only for educational purpose
2. Intraday scalping strategies only and on 5 min timeframe
3. Do paper trade before using any information for actual trading
4. Not swing or positional trade

StableFork Indicator
StableFork Intraday Indicator
The Indicator makes us my experience of 16 years and applies my setup to the price action. The Indicator works on the crossover of 2 moving averages in conjunction with ATR and based on the nature of crossover gives an automated Buy or Sell Signal along with stop loss and profit booking targets. For ALGO trading purpose profit booking by default is set to a trailing system ( Trailing by 0.5%).
Features
Advanced Signal Bars
Clear Buy / Sell Signals on Charts
Clearly Mentioned Fixed and ATR Based Targets on the Charts
Clearly Mentioned Trailing SL levels on the Charts
Realistic Target Settings suitable to Intraday Trading
Risk Reward 1:2
Algo Trading Ready
Alerts are compatible for various webhook based alert services
Not a Holy Grail system
This is a premium invite only indicator, you can send us a DM to get access.
The client will get benefits of any future development or updates in the current code without any extra charges.
Trade Management
Trade Entry - The indicator keeps searching for setups that suit either a buy or a sell signal. One a condition is identified - the relevant alert is shown on screen and can be customized as an automated alert as well using TRADINGVIEW'S alert function.
Order Execution - Order is executed at the bar following the signal generation bar , this takes care of any false signals triggered by volatility as well. Trade is in motion from the start of the next bar keeping the original risk / reward in place. If the client is using the indicator for manual use , entry price and trade alerts can be hidden from the settings menu of the indicator.
Trade Management - After the order has been executed - the indicator keeps checking the price action for either profit booking or for triggering a new trade in case the trend analysis has failed. In the example quoted above, since it was a trending day , targets on both the long and short trades were achieved. On a range bound day or very volatile day performance of the indicator will be badly affected as the indicator merely follows price, its not the other way around.
Exit Triggers - The indicator will show you a pop up on screen to book profits in case the trade goes in the direction of the generated signal , for ALGO trading purposes profit booking on such trades will be on the trailing stop loss method. In case a user requires to exit at fixed targets only, default setting has to be chosen from the input settings menu of the indicator.
On Screen Information: The indicator shows the current signal and keeps plotting the target and trailing stop loss line along with extreme zone ATR zones for more profit booking. Depending on the risk profiling of the user, a user can chose where to book profits.
Guidelines on how to use the Indicator
The most stable time frame for stocks and index signal generation is 10 mins - in case you select a shorter time frame, the indicator is bound to give a lot of alerts
The most stable time frame for Commodities and Forex trading signals is 30 minutes.
The most stable time frame for Crypto Currencies trade signal generation is 45 minutes.
Disclaimer
I am not a SEBI Registered Analyst and shall not be liable for any profit, loss or liability resulting, directly or indirectly from the use and results of the Indicator.
I am a self taught trader and the indicator is the result of my hard of 16 years of price action analysis, and by no means have I established that this is the best strategy that can fetch you better returns than any other strategies. The Indicator follows price action, price action does not follow the indicator - This is not a Holy Grail setup, sometimes targets will be hit and sometimes the trades will hit stop losses as well.
Instructions to obtain access to this invite-only script
Send us a DM if you wish to gain access to the indicator

HuD IntradayConsist of :
- standard Bollinger Band (BB) - MA20 and 2 dev
- EMA ( default 9,20,50 and 200)
- WMA ( 5 and 10 )
- Donchian Channel
Suitable for intraday trading - 15min, 30 min or 1 hour timeframe
Trading Strategy :
1. Enter trade only when
- band is Green
- line EMA20 above EMA50 and line EMA50 above EMA200 ( black > purple > red )
- RSI (default setting 14) is above level 50 and trend is positive (RSI line moving upward)
2. Possible Entry point ( 3 options )
i Breakout candle and candle still below lower BB
ii Retracement/Pullback - after Breakout and candle still inside green band. RSI still above 50
iii. Buy on Weakness (BOW) - Blue diamond icon
3. Stop Loss :
- Select "Show Stop Loss" - to display stop loss line
- Based on ATR
- adjustable depend on trader risk
Other option for stop loss :
- WMA Area ( Dark green ) - candle cross under WMA, can consider to exit trade
- EMA20 - candle cross under EMA20, can consider to exit trade.
4. Alert
Therea are 3 alerts availabe
i. Breakout signal
ii. Sell signal - candle break trailing Stop
iii. BOW - Buy on weakness signal
Note :
- This indicator only suitable for Bursa Malaysia
- Do PM me if you interested

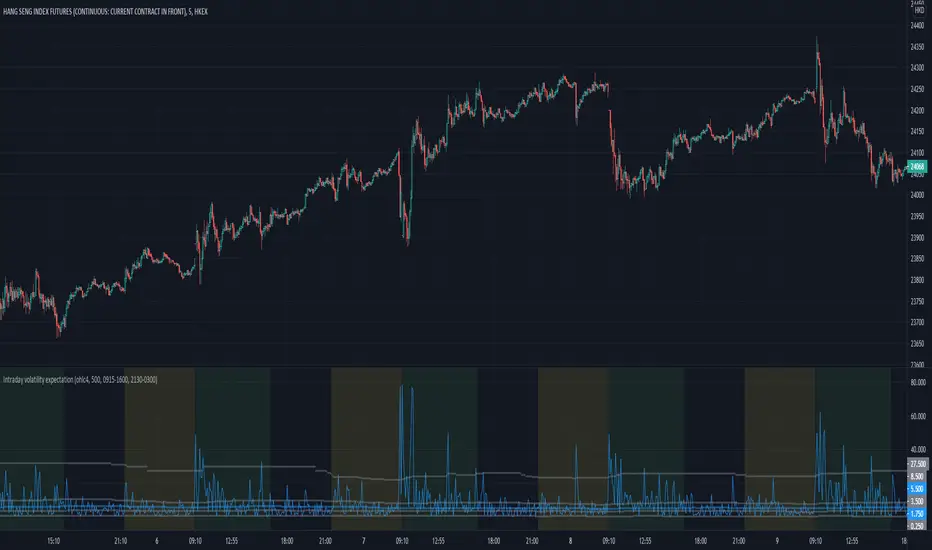
Intraday volatility expectationManaging expectation is important for price action traders.
This indicator mainly for intraday reference, and it plots the price change/ volatility statistics on a bar-to-bar basis, with the marking of +/- 1 and 2 sigma SD .
The user can refer to the historical volatility to manage their expectation of the velocity of price action by referring to these statistics.
Camarilla Scanner v1The script is based on Camarilla pivots for trend analysis of stock in intraday.
It will scan the selected stocks chosen in input settings displays the current status of where they are with respect to Camarilla pivots.
The day's history will show only those closed above R4/below S4.

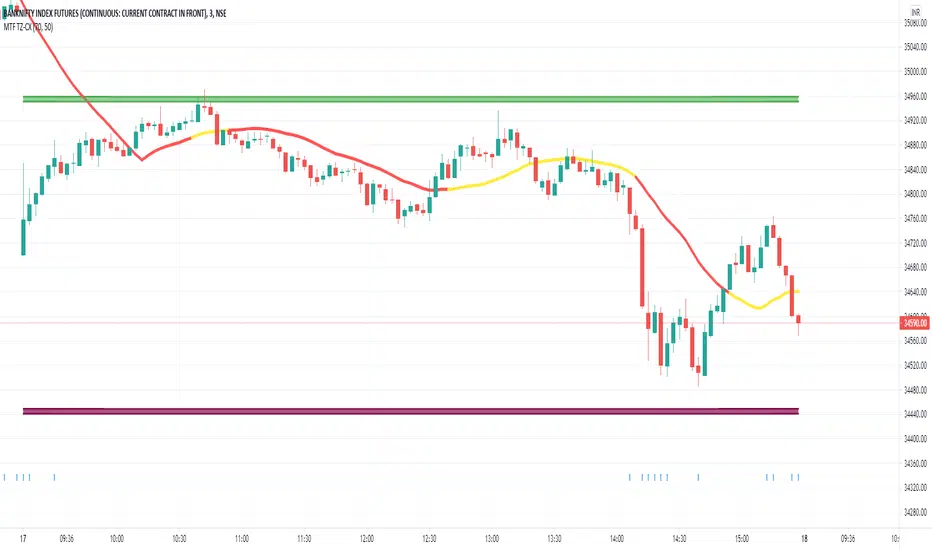
Multi Time Frame - Trend AnalysisMuti Time Frame - Trend Analysis
How does it work ? Price movements over range of period is to compute the trend forward.
This script used SuperTrend (ST) , ATR and RSI to determine the trend and direction so that a buy sell decision can be made
To Indicate the strength of the trendline , RSI is computed over multiple timeframes and then used to in sync with SuperTrend to help determine the direction
The user can customise the RSI strength validation. So one the Super Trend and ATR Levels are matched , the RSI is validated before giving a BUY/SELL suggestion
Best Time Frames to use : Upto 15/30 Mins if using RSI based logic , user can use higher timeframe if the goal is to identify the trend and the use lower time frame to determine Buy/Sell
Where to use
Trend Indicator using Multi Time Frame Analysis to suggest a long or a short
The main use of this indicator is quick scalping and Intra-day trading.
The Indicator shows the option to show the Trend Zone and Buy/Sell Signals which the use can on or off
How to use
User Choices : To avoid false positives we have introduced a double check using RSI ,
it is defaulted to 60/ 40 - the users are free to change it as per their preferences
The system will not suggest a trade when the the counter in beyond the RSI limits
Stop Loss - That should be done by following ones risk appetite , Ideally the open/close of the previous candle should be the stop loss for the buy/sell
but everyone has their own Risk Management Strategies based on the capital deployed.
Disclaimer : There could be scenarios when the candle is shown as a long or short and then the candle turns into opposite direction red/green .
In such scenarios , Please refer to the just preceding candle and if this candle is moving into positive direction (forming green candle) only then buy ,
Similarly Sell/Short only if this candle is forming a red candle
How to get access
Please click on the link / email in the signature or send me a private message to get access
Feedback
Please click on the link/email in the signature or send me a private message for suggestions/feedbacks
JD IntradayJD Intraday Indicator is a single algorithm that is designed for the 1hr charts of Forex, Crypto, Stocks and Indicies and aimed at the intraday trader.
How to use;
When the three moving averages are aligned, the background will be shaded red or green - this is the direction we are expecting the market to go.
The best moves happen when the moving averages have just fanned out.
There are a number of rules baked into the code to try and eliminate as many fake signals as possible.
This algorithm is a combination of several indicators but has trend continuation at its heart.
When to trade
An alert will trigger when the price has bounced off the closest Moving Average and the internal confirmations align.
Wait for the bar to close and place a pending order with a 3 pip gap from the high or low of the candle.
Stops want to be just above (or below) the closest Moving Average with a target of at least 2:1.
JD Intraday in action
How to Access
Gain access to JD Intraday for your TradingView account through our website, links below.
7 day paid trials, subscriptions and lifetime access are all available.
All tiers give you full instructions on how to trade this strategy.

SHARP PIVOTS (INTRADAY LEVELS) Hi friends,,
This indicator is based on modified fib levels.
Buy above 23.7% from recent low and sell below 72.7% from recent high.
15 mins close above or below the entry levels Recommended.
use Heiken Ashi candles for trend confirmation.
USE RSI 60/40(UNCONVENTIONAL) For additional conformation

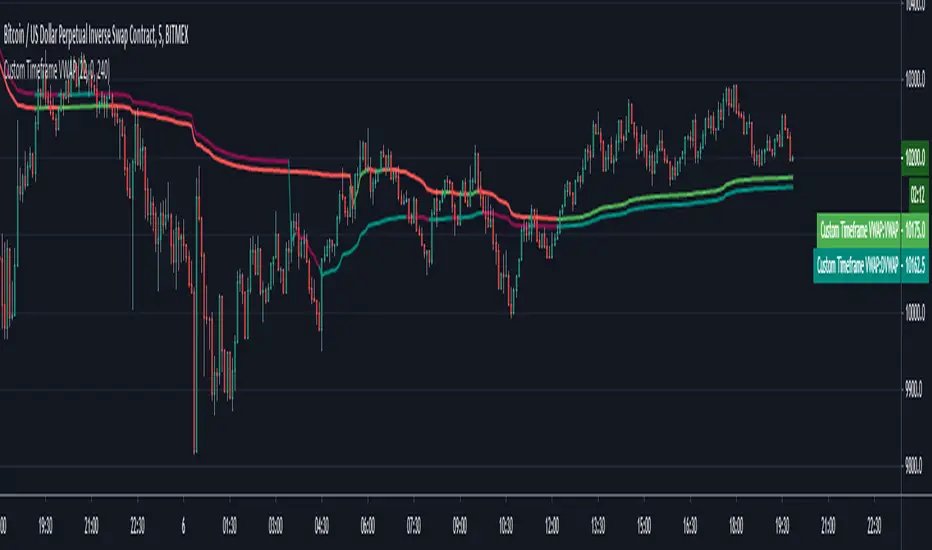
Custom Timeframe VWAPThis script calculates the daily VWAP from any specified starting point intraday. Also colors the VWAP based on whether price is above or below it.
Standard vwap starts at day open 0 GMT, however there are some exchanges for eg. Deribit that have seen they use a different time period to begin VWAP calculations. This is useful in such cases.
You need to specify the hours & minutes of the VWAP that want to use. VWAP will be hidden on any timeframe higher than specified "Highest Visible Timeframe".
Also a big thanks to u/mortdiggiddy as he helped with this script.
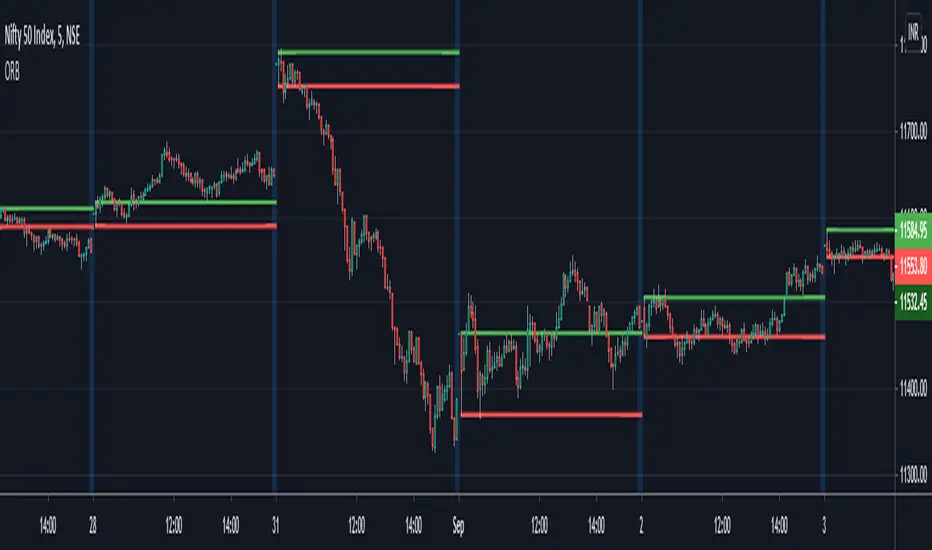
ORB - Opening Range BreakoutThis script plots the high/low of any custom session and extends it until the daily close. It does not show on the timeframe higher than the length of custom opening session by default.
The time period of opening range & the max timeframe to display it on can be adjusted from the settings.
So for eg. if want to use 5m ORB to trade, then set "ORB total time" as 5min & "Session Time" as whatever is the opening 5mins time period of ticker that are trading.
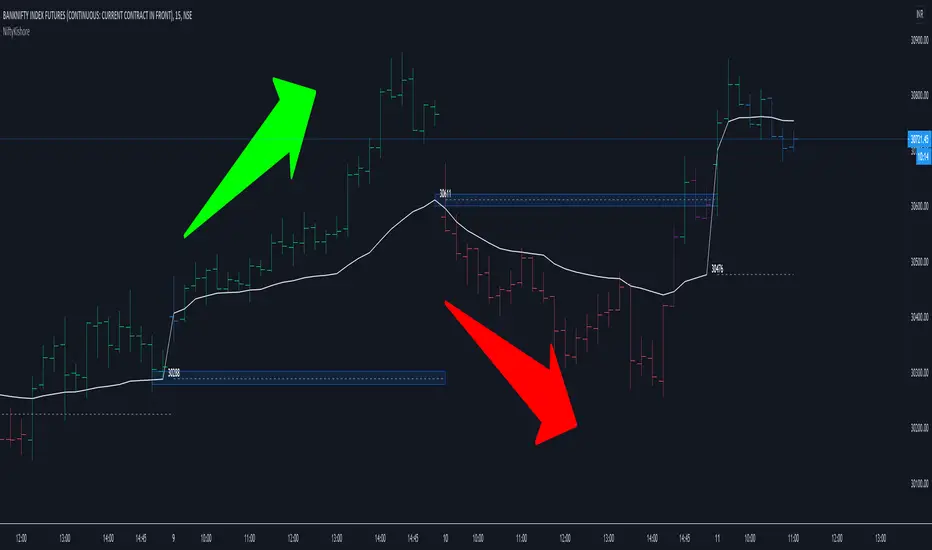
Trend Following Algo by Technicaltrader615 for BankniftyThis is an Intraday Trend Following System developed for Trading the Bank nifty Index. It couples traditional trend following with Momentum and Price action. The trades are Entered and Exited the Same day. If Old buy signal is continuing, system wont take trade, System will wait for new signals. For continuation or re entry there is a separate program which is under development.
This can be applied to Futures segment and Options Also. Options you have to understand parameters like Expiry, Strike Price, IV etc; Future trading is recommended compared to option as the system is tested with futures.
For more Details you can contact thru trading view chat window. You can also scroll down for my signature. There will not be any trail period.

Intraday Long & Short 5MinRules for using this indicator
1. Time Frame - 5 Min (Recommended) or 15 Min
2. Long Entry - when High of signal candle breaks by any Green candle' close.
3. Short Entry - when Low of signal candle breaks by any Red candle' close.
4. Price might reverse after you take entry till Red line or Green Line and as this indicator is based on Higher High and Lower Low Support and Resistance method. Most of time it will reverse after touching the line. You can confirm the Price action from that point. else Exit.
5. Entry in 5 Min timeframe and holding for swingtrade until overbought and oversold indication appears will give extra profits.
6. DYOR
Like,Comment and add this to favorite if you find it useful.
Consider Donating coins only if this indicator turns profitable for you.
Thank you!
