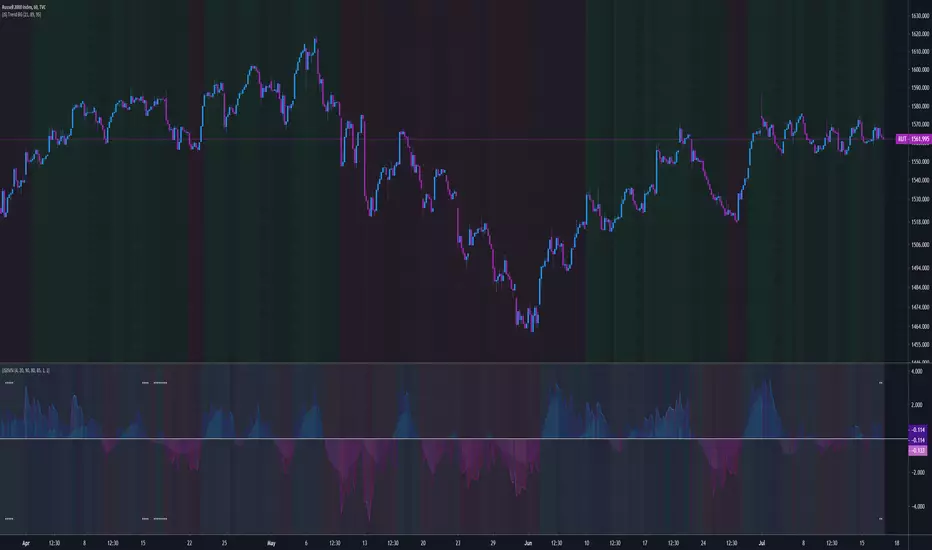
(JS) Sustained Velocity Squeeze IndexSo I have revamped my original SVI indicator with the new Squeeze Pro system and have fused them together to form a single and extremely versatile indicator.
First, allow me to share the description on the original SVI, as all of this still applies:
" The Sustained Velocity Index is an original indicator I've created as a means to accurately measure parabolic moves to the up or down side.
Acceleration
I have added Acceleration to the equation which you can turn on and off.
This is meant to amplify the value when the move is sustained in a given direction.
What this does is amplify the reading based on consecutive green or red candles.
You can also change the Acceleration sensitivity with 5 being the strongest and 1 being the weakest.
Length
This is rather obvious - the look back period for the math formula.
However - I did include presets that I thought best suited Daily/Weekly/Monthly which you can toggle on and off
The rest of the options are purely cosmetic;
Backgroud Off - Turn the indicator background colors on and off.
Simple Background? - This toggles a simple two shade background on and off.
Background Transparency - Allows you to adjust the transparency of the background colors.
Plot Background Off? - Allows you to toggle the background inside the plot on and off.
Plot Line Color Off? - If you don't like the way the plot line changes colors, this turns it white.
Color Scheme - Four schemes to choose from, first three are color based, the last one is a plain version.
Plot Width - Adjusts the width of the plot line on the indicator.
Plot Line Value? - Toggles a line on the indicator at the current value on and off. "
Regarding the Squeeze Pro:
" The new Squeeze Pro has three different squeeze types rather than a single signal.
White = Warning/Low Squeeze
Red = Regular/Mid Squeeze
Yellow = Power/High Squeeze "
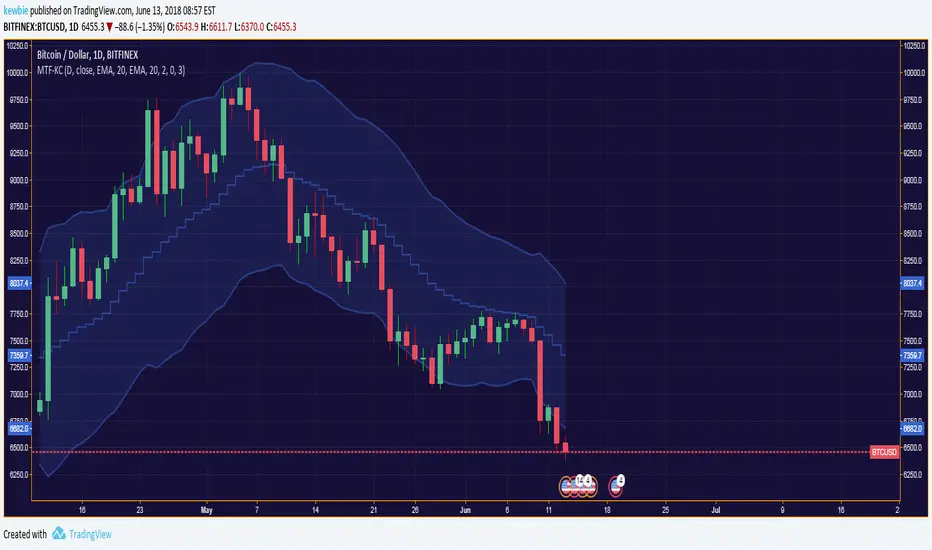
So what does this new indicator do? well - it does everything above, for one. Also, it allows you to use these indicators (Squeeze and SVI) separately in more ways than one, or if you choose so, individually. The default layout is the SVI overlayed on top of the Squeeze Momentum which can be seen in the background allowing you to be aware of both simultaneously, and done in a way that doesn't feel cluttered.
So here''s the new features:
Squeeze Momentum Off - This is rather obvious, when selected this will only show the SVI, no squeeze overlay.
Squeeze Momentum Only - Obvious again, when this is on SVI is removed and only the Squeeze momentum appears on the indicator.
Squeeze Momentum Plot Transparency - This toggles the opacity of the Squeeze momentum when it is overlayed with SVI, so you can bring it out/fade it back more depending on your preference.
Combined Indicator - This is the really cool feature. I combined the math formulas of both the Squeeze and SVI to create a single momentum indicator, the combo indicator tends to lag the other two a bit, but is better at assessing the longer term trend.
There are 5 different color schemes as well, with the fifth being a plain grayscale bg if you aren't into all the extra stuff.
Lots of moving parts to this script! I have been using this thing now for about a week or so prior to publishing and I love it so far, hope you all do too - enjoy!
Canaux de Keltner (KC)
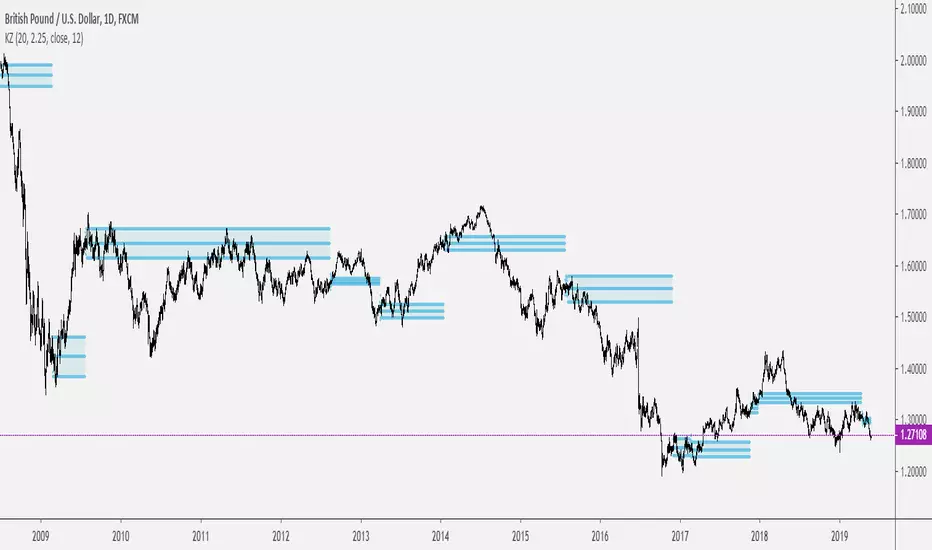
Keltner ZonesThis is an indicator that draws support and resistance zones / levels based on price action in and around Keltner Channels.
There are 3 different modes;
Draw zones based on price breaking the upper band
Draw zones based on price breaking the lower band
Draw zones if price stays within the bands for a prolonged period of time.
You can also decide if you want the indicator to paint zones or levels. The Zones can grow rather large if there is a volatility shock since they are drawn using the true range around the trigger price.
Upper Band Zones
Lower Band Zones
Congestion Zone
[AU] Fibonacci Fractal Regression ChannelFibonacci Fractal Regression Channel v01
Based upon:
Fractal Regression Channel V0 () by @RicardoSantos
Note: For use on 4H charts and lower intervals/timeframes
Rumpy's McGinley's Dynamic Bollinger Bands and Keltner ChannelUses volume weighted (optional) applied to the McGinley Dynamic for the basis of either a Bollinger Band or Keltner Channel.
When volume weighting is enabled it uses a volume weighted standard deviation to calculate the bollinger width.
Keltner channel also uses the McGinley formula to calculate the ATR used to determine the width of the channel.
Both the 1x and 2x standard dev and ATR multiples had significant PA interaction so both intervals are plotted to the BB and KC.
---------------------------------------
If you find it useful please consider a tip/donation :
BTC - 3BMEXEDyWJ58eXUEALYPadbn1wwWKmf6sA
---------------------------------------
Keltner Channel :

CHOP_LRSI V2.0Incorporated the strategies which are part of the "Flow Tend Indicator Strategy V2" strategy into the CHOP_LRSI study.
Long and Short signals can be displayed below the study. Alerts are supported for every strategy.

Jurik Channels — SharkCIAThis is a keltner channel calculated using the Jurik Moving Average.
Special thanks to auroagwei www.tradingview.com
Special thanks to everget www.tradingview.com
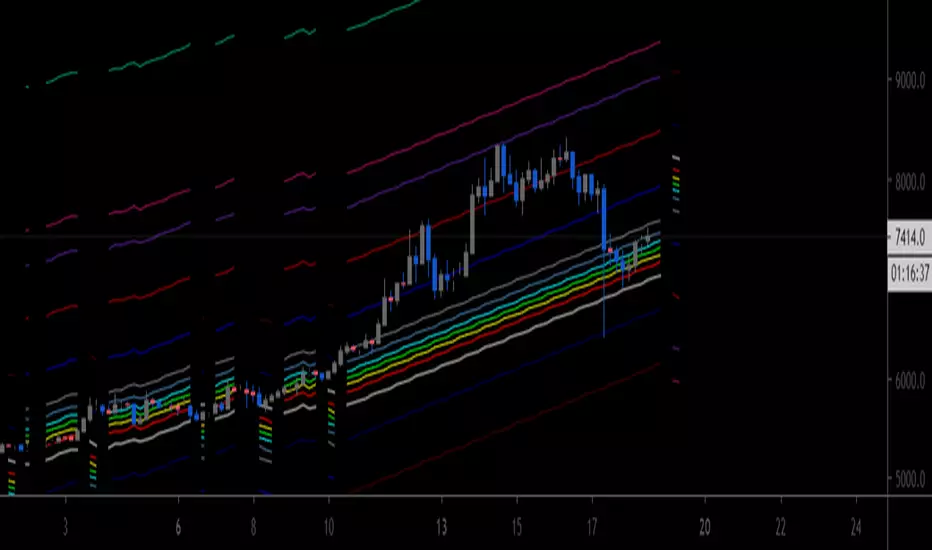
Improved Multi-Timeframe (MTF) 21 TRC - plots same as live dataThis multi-timeframe 21-period true range channel uses an improved calculation to accurately calculate the indicator's value with every new bar on the time frame your chart is set to. Previously the indicator only recalculated with every new update on the timeframe used in its security function. This means that this improved script plots the real, current value of your indicator across your chosen timeframes on your chart's resolution and no longer only plots only the indicator's monthly/weekly/daily/4 hour/ect closing value on the your chart.
This indicator uses a similar calculation the "Keltner Channel" indicator.
Input values are fixed to their default (close,21,3) configuration to make this indicator's improved calculation possible.
When using "Plot Higher Timeframe?" the script will set the indicator to only plot its value in closest larger timeframe. This option overrides the two following options. For example, when using the daily resolution , only the weekly value will plot, or when using the one hour (60m) resolution, only the 4 hour (240m) value will plot.
The "Omit Higher Timeframes?" option will set the indicator to only plot starting from the 1/2/3/4/5/6/7th closest larger timeframe. For example, when using the daily resolution and this option set to 0, all values from the weekly resolution and up will plot, but if set to 1, all values from the monthly resolution and up will plot instead.
The "Plot Yearly/Quarterly/Monthly/Weekly/Daily/4 Hour/1 Hour/15 Minute/5 Minute?" options allow enabling/disabling a specific timeframe. All are enabled by default. For example, if you do not want the yearly value of the indicator to ever plot, you can disable the "Plot Yearly?" option.
Keltner Channel signalsUsing pupytherapy script
and the same system that we use for Bollinger and linear channel we can make easy the signal for the Keltner channel
I need to think how to make all those channels to combine I hope in next version I could do it :)

Keltner Channels x 2"Keltner Channel x 2" is a simple modification of another script found on Tradingview that was posted by Ale91wolf called "Keltner Channels Linda Raschke".
This modified script allows the user to stack one Keltner Channel on top of another using different ATR multipliers which can be helpful by creating more visual
levels of price action as well as areas for potential trailing stop levels.

Cyatophilum Ichimoku Small TimeFrames [ALERT SETUP]A script for daytraders trading small timeframes.
Currently in developpement.
If you want to try it send me a PM, and give a like to receive updates.
AutoEnvelopeA channel that contains approximately 95% of all price data for the past 100 bars, about five months on a daily chart. It automatically plots correct channels for any trading vehicle in any timeframe.
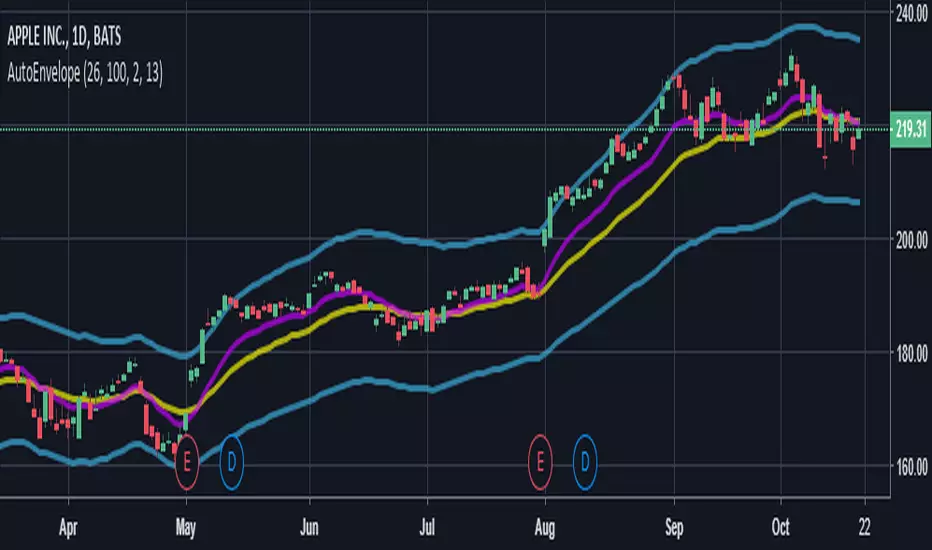
AutoEnvelopeA channel that contains approximately 95% of all price data for the past 100 bars, about five months on a daily chart. It automatically plots correct channels for any trading vehicle in any timeframe.

Keltner Channels+Parabolic Sar+Fractals+MACDA mixture of 4 indicators on the same overlay. Keltner Channels, Parabolic Sar, Fractals. MACD is integrated for yellow candles in order to show huge macd and trigger line gaps. MACD integration focuses on hist line by determining negative upper level and positive bottom level.


Keltner Channel Strategy The Keltner Channel, a classic indicator
of technical analysis developed by Chester Keltner in 1960.
The indicator is a bit like Bollinger Bands and Envelopes.
WARNING:
- This script to change bars colors.

Keltner Channel The Keltner Channel, a classic indicator
of technical analysis developed by Chester Keltner in 1960.
The indicator is a bit like Bollinger Bands and Envelopes.

BB & KCThis script is a mix of both the default Bollinger Bands and the default Keltner Channels.
It helps in identifying the squeeze of the bands and also the consolidation of the price movement.

Advanced Keltner ChannelsThis is a more advanced version of the standard Keltner Channels indicator. It allows you to change the type of the moving average (Simple, Exponential, Weighted, Volume-weighted, Triple EMA or a moving average that uses RSI ). The indicator also allows you to volume weight the indicator (turned on by default). If you want to weight the indicator against the true range instead of volume this is also possible. By default, this will be done automatically for assets that do not support volume .

Multiple-Timeframe Keltner ChannelKeltner Channels are volatility-based envelopes set above and below a moving average first devised by Chester W. Keltner then later revised by Linda Bradford Raschke.
This script allows for the overlay of the Keltner Channel across multiple-timeframes.
Additionally allows for the selection of the true range average type with a user defined lookback period.
Default settings is the traditional type of KC seen on TV.
Note: When inputting the MA-Basis strings it is case sensitive; enter only lowercase or all uppercase. If a typo is made it will by default revert to an EMA base.