Broadening Formation Structure Review ToolThis script provides an educational, checklist-based framework for studying Broadening Formations together with basic Strat-style reversal behavior and higher-timeframe direction. It is designed to show multiple structural conditions in one place so users can observe how they interact. It does not execute trades, generate signals, or provide financial advice.
What makes this script original is the integration of four components into a single logical framework:
• dynamic tracking of Broadening Formation high/low levels
• proximity evaluation relative to those levels
• classification of simple bar reversal behavior
• higher-timeframe open–close continuity checks
Instead of using these concepts as separate tools, the script combines them into a single checklist so users can see when multiple conditions occur at the same time.
Broadening Formation levels may be user-defined or automatically derived using:
• unlimited dynamic expansion
• range-limited dynamic expansion
• swing-pivot detection
• manual input mode
Users may also optionally lock levels once a structure is identified.
Proximity to BF levels can be measured in several ways, including percentage, ticks, points, dollars, ATR multiples, or expected-move multiples. The script can also detect when price takes out BF highs or lows.
The script classifies basic Strat-style price behavior, including:
• two-up / two-down moves
• outside bars
• failed 2U/2D reversals
• 2D→2U and 2U→2D reversals
A selectable higher timeframe (such as 60, 240, D, W, or M) is used to evaluate direction by comparing the higher-timeframe open and close.
The on-chart table summarizes:
• current BF High and BF Low levels
• proximity status relative to those levels
• whether BF highs or lows have been taken out
• reversal classification results
• higher-timeframe direction
• theoretical risk distance and 2R/3R projections
Optional alerts can notify when three-condition or four-condition checklist alignment occurs, based only on the logical rules visible in the script. Optional chart lines for BF levels may also be displayed.
Transparency and behavior notes
• swing pivots repaint until confirmed
• higher-timeframe direction is only final at bar close
• dynamically derived BF levels may update as price forms new extremes
This script is intended purely for market-structure study and education. It does not guarantee performance, predict outcomes, or recommend trades.
M-formation

Multi Timeframe Market Formation [LuxAlgo]The Multi Timeframe Market Formation tool allows traders to analyze up to 6 different timeframes simultaneously to discover their current formation, S/R levels and their degree of synchronization with the current chart timeframe. Multi timeframe analysis made easy.
🔶 USAGE
By default, the tool displays the chart's timeframe formation plus up to 5 other formations on timeframes higher than the one in the chart.
When the chart formation is synchronized with any enabled timeframe formation, the tool displays labels and a trailing channel, it uses a gradient by default, so the more timeframes are synchronized, the more visible the labels and the trailing channel are.
All timeframes enabled in the settings panel must be higher than the chart timeframe, otherwise the tool will display an error message.
🔹 Formations
A formation is a market structure defined by a lower and an upper boundary (also known as support & resistance).
Each formation has a different symbol and color to identify it at a glance.
It helps traders to know the current market behavior and the tool displays up to 5 of them.
BULLISH (green ▲): higher high and higher low
BEARISH (red ▼): lower high and lower low
CONTRACTION (orange ◀): lower high and higher low
EXPANSION (blue ▶): higher high and lower low
SIDEWAYS (yellow ◀): Any that does not fit with the others
🔹 Multi Timeframe Formations
The tool displays up to 6 different timeframe formations, the chart timeframe plus 5 more configurable from the settings panel.
Each of them has an upper and lower limit, a timeframe, a color and an icon.
If a bound level is shared by more than one formation, the timeframes and symbols are displayed on the same line.
These are significant levels shared by different timeframes and traders need to be aware of them.
🔹 Sync With Chart Timeframe
If the current formation on the chart timeframe is in sync with any of the timeframes enabled in the settings panel, the tool will display this on the chart.
The more timeframes are in sync, the more they are visible, providing a clear visual representation of the common market behavior on multiple timeframes at the same time.
🔶 SETTINGS
Formation size: Size of market formations on the chart timeframe
🔹 Timeframes
TF1 to TF5: Activate/deactivate timeframe, set size of market formation and activate/deactivate high and low levels
🔹 Style
Show Labels: Enable/Disable Timeframe Sync Labels
Transparency Gradient: Enable/Disable Transparency Gradient
Show Trailing Channel | Multiplier: Enable/Disable Trailing Channel and set multiplier
Color for each formation

Formation Defined Moving Support and ResistanceThe script was originally coded in 2018 with Pine Script version 3, and it was in protected code status. It has been updated and optimised for Pine Script v5 and made completely open source.
The Formation Defined Moving Support and Resistance indicator is a sophisticated tool for identifying dynamic support and resistance levels based on specific price formations and level interactions. This indicator goes beyond traditional static support and resistance by updating levels based on predefined formation patterns and market behaviour, providing traders with a more responsive view of potential support and resistance zones.
Features:
The indicator detects essential price levels:
Lower Low (LL)
Higher Low (HL)
Higher High (HH)
Lower High (LH)
Equal Lower Low (ELL)
Equal Higher Low (EHL)
Equal Higher High (EHH)
Equal Lower High (ELH)
By identifying these key points, the script builds a foundation for tracking and responding to changes in price structure.
Pre-defined Formations and Comparisons:
The indicator calculates and recognises nine different pre-defined formations, such as bullish and bearish formations, based on the sequence of price levels.
These formations are compared against previous levels and formations, allowing for a sophisticated understanding of recent market movements and momentum shifts.
This formation-based approach provides insights into whether the price is likely to maintain, break, or reverse key levels.
Dynamic Support and Resistance Levels:
The indicator offers an option to toggle Moving Support and Resistance Levels.
When enabled, the support and resistance levels dynamically adjust:
Upon a change in the detected formation.
When the bar’s closing price breaks the last defined support or resistance level.
This feature ensures that the support and resistance levels adapt quickly to market changes, giving a more accurate and responsive perspective.
Customisable Price Source:
Users can choose the price source for level detection, selecting between close or high/low prices.
This flexibility allows the indicator to adapt to different trading styles, whether the focus is on closing prices for more conservative levels or on highs and lows for more sensitive level tracking.
This indicator can benefit traders relying on dynamic support and resistance rather than fixed, historical levels. It adapts to recent price actions and market formations, making it useful for identifying entry and exit points, trend continuation or reversal, and setting trailing stops based on updated support and resistance levels.

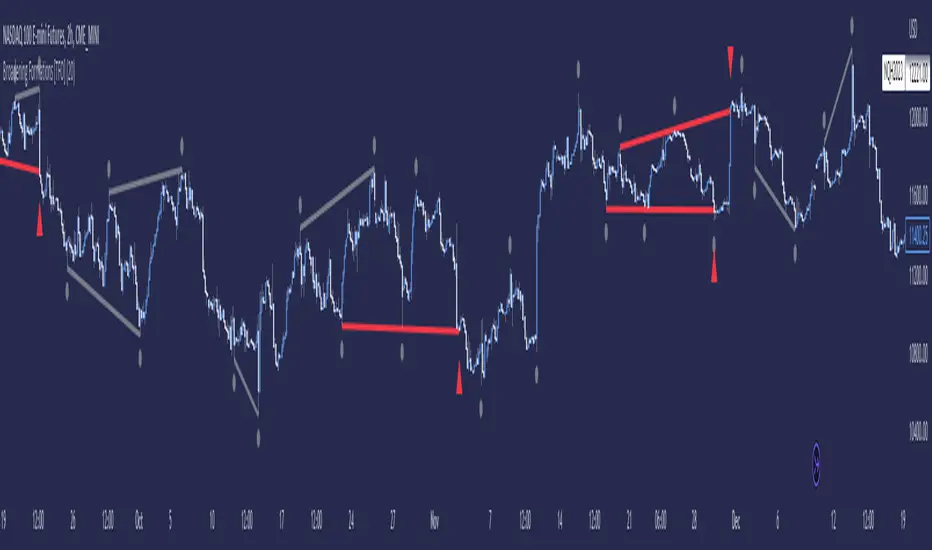
Broadening Formations [TFO]This indicator highlights deviations from broadening formations (or megaphone patterns). Deviations from broadening ranges can often foreshadow reversals, especially in consolidation phases. These deviations are highlighted via trendlines that change color when tested, and also have the option to be alerted.
These broadening formations are heavily used with "The Strat" and can add confluence when looking for reversals within higher timeframe points of interest.
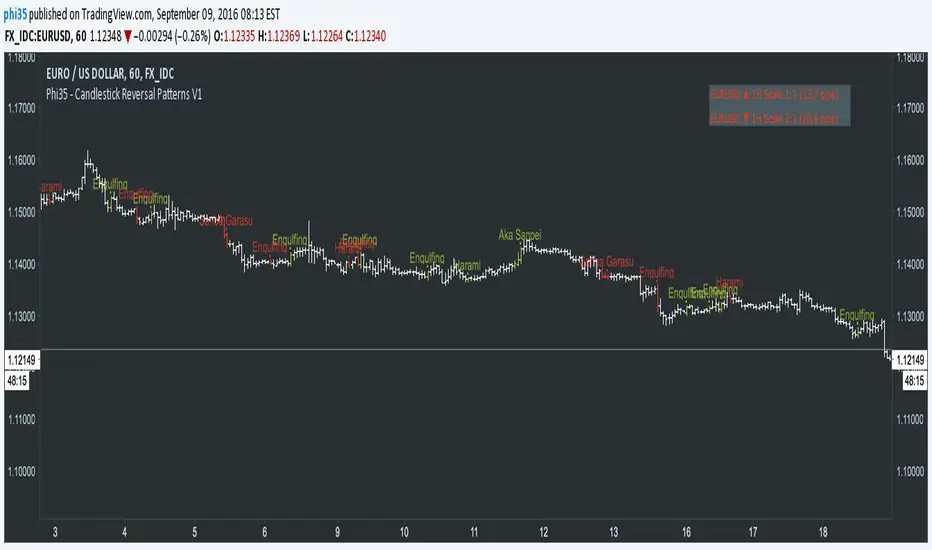
Phi35 - Candlestick Reversal Patterns V1 ©Candlestick Reversal Pattern V1 by Phi35 - 9rd September 2016 ©
Check also my " Candlestick Continuation Pattern " indicator which will follow soon!
Do not modify the code without my permission!
If there is an issue or any suggestions, feel free to contact me on the link below
www.tradingview.com
www.tradingview.com
It seems to work well but still no guarantee on completeness!
RISK WARNING! PAST PERFORMANCE IS NOT NECESSARILY INDICATIVE OF FUTURE RESULTS. IN MAKING AN INVESTMENT DECISION, TRADERS MUST RELY ON THEIR OWN EXAMINATION OF THE ENTITY MAKING THE TRADING DECISIONS!
Wait always for confirmation (next opening price or closing price)!!
RECOGNIZABLE REVERSAL PATTERNS
01.Engulfing
02.Harami
03.Piercing Line
04.Morning Star
05.Evening Star
06.Belt Hold
07.Three White Soldiers
08.Three Black Crows
09.Three Stars in the South
10.Stick Sandwich
11.Meeting Line
12.Kicking
13.Ladder Bottom
Although the Engulfing and Harami Patterns are important but can occur too often and give false signals, I give you the option to turn them completely off.