MACD Divergence MarkFeatures:
Bright & Dark theme option. Choose the type that you can see clearly.
Customizable MACD length parameters.
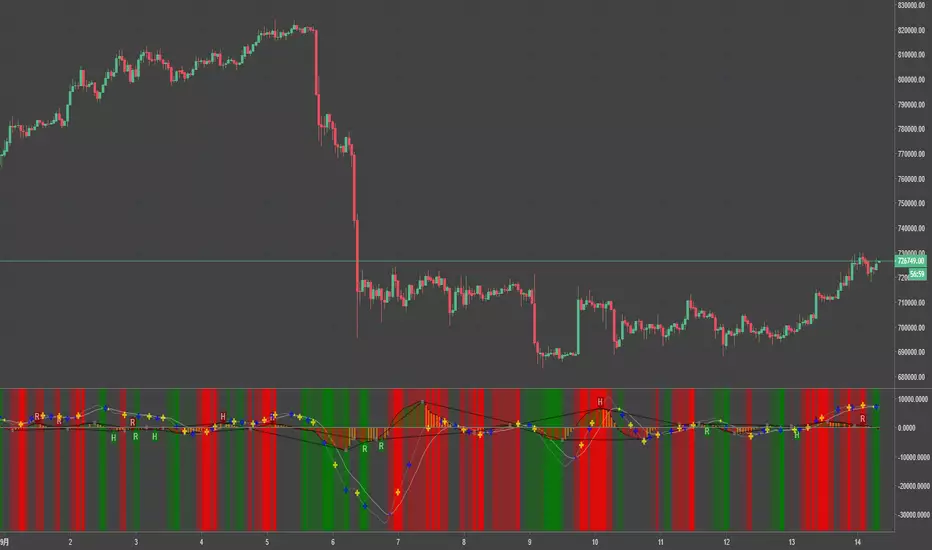
Mark all the MACD Divergence signals on your chat!
Getting Started:
Replace your MACD indicator with this one.
Contributing:
You can report bugs or issues under this page.
Any advice would be helpful for improving this indicator's accuracy.
Acknowledgements:
Macd-v


Gunbot Deluxe Tuners BE [Alerts]Revision 18
Gunbot Deluxe Tuners BE Alerts is part of the official Gunthy version of Gunbot Deluxe Tuners.
It is the companion Alerts script for the Gunbot Deluxe Tuners BE (Black Edition) backtesting and optimizing script.
This Alerts script allows user to automatically send alerts directly to Gunbot through the Gunbot TradingView addon.
Available only to verified Gunbot owners. No exceptions. Anyone interested in obtaining this script must contact either their official Gunbot reseller or me privately.
No public requests or donations for access to this script will be granted. No exceptions.
NOTICE: By requesting access to this script you acknowledge that you have read and understood that this is for research purposes only and neither I or Gunthy are responsible for any financial losses you may incur by using this script!

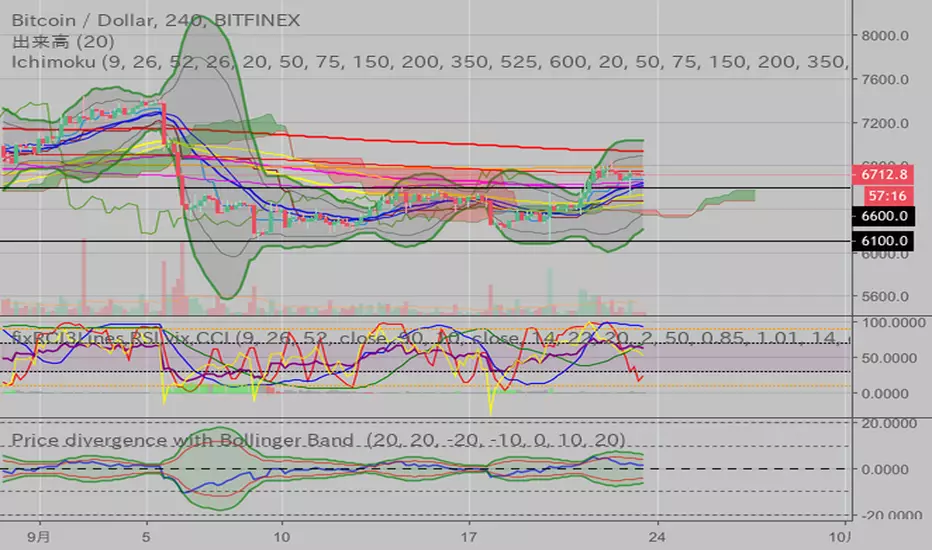
Price divergence with Bollinger Band This script showers Price divergence
from Base-SMA(default:20SMA) to close-price and Bollinger Band(±2σ,±3σ).
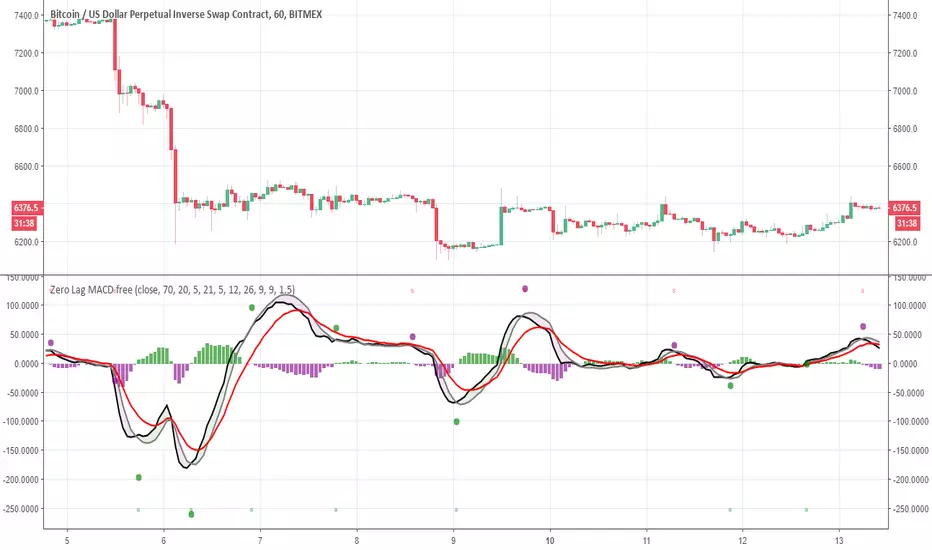
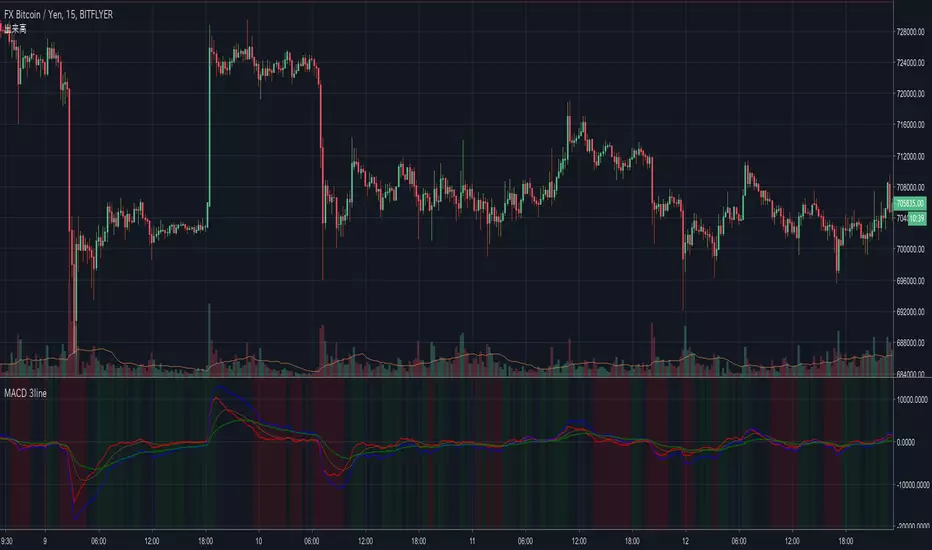
9 x TimeFrames: MACD + Histogram, Logarithmic***Up to 9 MACD's with fixed timeframes***
-Simply enter your MACD settings, and which timeframes you would like to see.
-Settings stick regardless of viewing resolution (within reason)
-Enter 0 to disable if you want less than 9 MACD's
***Logarithmic option for consistency over long timeframes***
***Layered histogram, can be disabled, adjusted vertically***


DiNapoli MACD PredictorMACD Predictor is a useful indicator that paints dynamic support and resistance levels which are unknown to most of traders.
This version of the indicator includes the following options:
Price Projection of Next Candle
Stop Grabbers visual indication
Short Line mode to declutter the chart
Normal/Dark mode
Visual labelling of the line
Thickness of the lines
This indicator is meant to be used by a private group of traders.

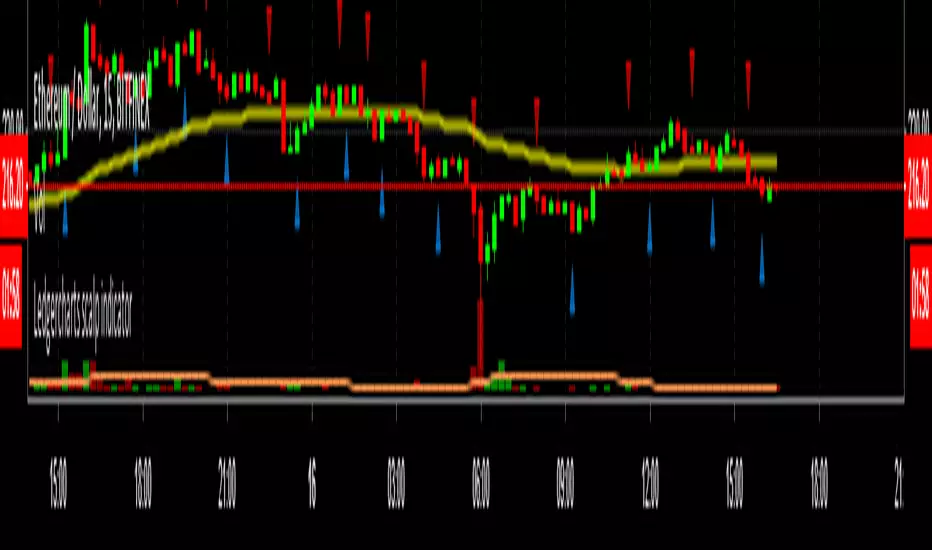
Ledgercharts scalp indicatorI'm using this indicator for finding scalp opportunities with high volume crypto coins. To be used in combination with support & resistance levels and/or other indicators.
Works best on a 15-minute timeframe.
DISCLAIMER:
This script is not intended as financial advice and is for educational purposes only. Do your own research by verifying the accuracy of the information and know that your decisions are your own.
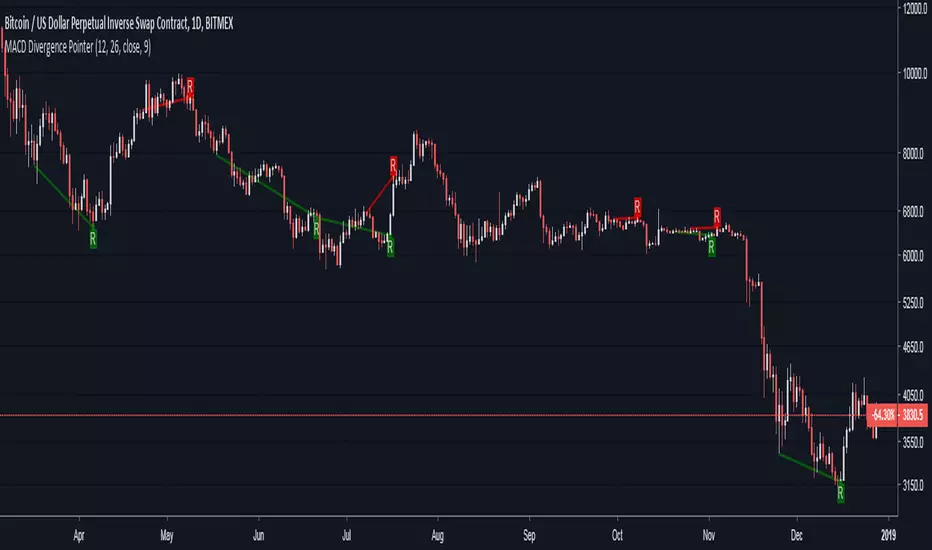
MACD Divergence PointerThis script points regular and optionally hidden types of bullish and bearish MACD divergences on the chart by drawing the divergence lines and optionally labels.
Hidden divergence is disabled by default, it can be enabled over settings window.
Regular divergence is enabled by default, it can be disabled over settings window.
There is an option to display the price channel additionally.
MACD settings are exactly same with the embedded MACD indicator's
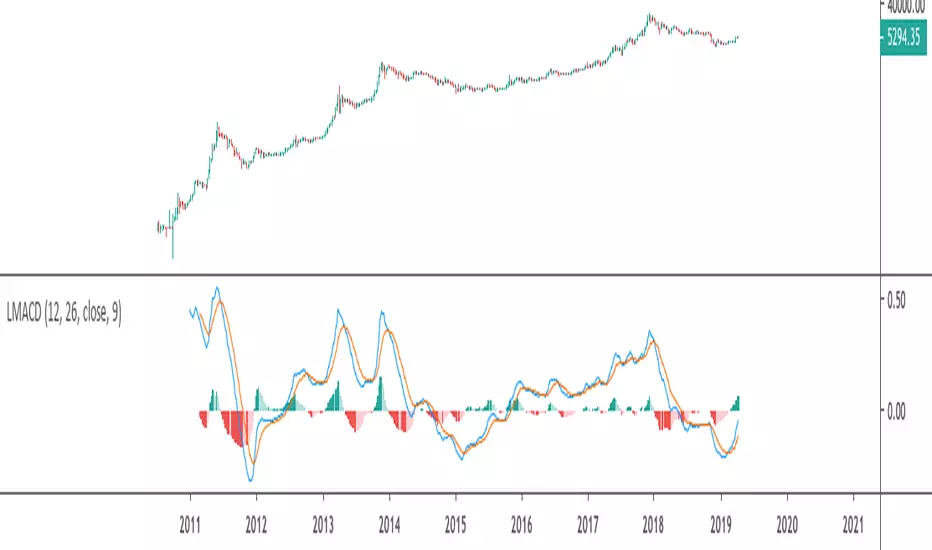
Price Normalised Moving Average Convergence DivergencePrice EMA's difference is Divided by Slower EMA thus making price values irrelevant and giving EMA's difference in relative (proportional) terms