Trade The Matric / MACD-RSI Hybrid Candles**"MACD-RSI Hybrid Candles"** is a **custom TradingView Pine Script (v6)** indicator that **replaces your chart’s default candles** with **dynamically colored, intensity-adjusted candles** based on **combined MACD and RSI signals**.
It’s a **visual fusion** of:
- **MACD Histogram** → Momentum & Trend Strength
- **RSI** → Overbought/Oversold & Trend Confirmation
- **Dynamic Transparency** → Visualizes **signal strength**
The result? **At-a-glance confirmation of bullish/bearish phases** — no need to check subcharts.
---
## OVERVIEW: What This Indicator Does
| Feature | Purpose |
|-------|--------|
| **Replaces price candles** | Entire chart becomes a **live MACD-RSI signal map** |
| **Colors based on dual confirmation** | Only strong when **both** MACD and RSI agree |
| **Transparency = momentum intensity** | Brighter = stronger signal |
| **Labels & Alerts** | Highlights **phase changes** (bullish/bearish shifts) |
---
## USER INPUTS (Customizable)
| Input | Default | Description |
|------|--------|-----------|
| `fastLen` | 12 | MACD Fast EMA |
| `slowLen` | 26 | MACD Slow EMA |
| `signalLen` | 9 | MACD Signal Line |
| `rsiLen` | 14 | RSI Period |
| `showLabels` | true | Show "Bullish Phase" / "Bearish Phase" labels |
> Standard settings — tweak for sensitivity.
---
## CORE CALCULATIONS
### 1. **MACD**
```pinescript
macdLine = ta.ema(close, fastLen) - ta.ema(close, slowLen)
signalLine = ta.ema(macdLine, signalLen)
hist = macdLine - signalLine
```
- `hist > 0` → **Bullish momentum**
- `hist < 0` → **Bearish momentum**
### 2. **RSI**
```pinescript
rsi = ta.rsi(close, rsiLen)
```
- `rsi > 50` → **Bullish bias**
- `rsi < 50` → **Bearish bias**
---
## DUAL CONFIRMATION LOGIC
| Condition | Meaning |
|--------|--------|
| `bullCond = macdBull and rsiBull` | **MACD hist > 0** AND **RSI > 50** → **Confirmed Bullish** |
| `bearCond = macdBear and rsiBear` | **MACD hist < 0** AND **RSI < 50** → **Confirmed Bearish** |
| Otherwise | **Neutral / Conflicted** |
> Only **strong, aligned signals** get bright colors.
---
## DYNAMIC INTENSITY & TRANSPARENCY (Key Feature)
```pinescript
maxHist = ta.highest(math.abs(hist), 100)
intensity = math.abs(hist) / maxHist
transp = 90 - (intensity * 80)
```
### How It Works:
1. Finds **strongest MACD histogram value** in last 100 bars
2. Compares **current histogram** to that peak → `intensity` (0 to 1)
3. **Transparency scales from 90 (faint) → 10 (bright)**
| Intensity | Transparency | Visual Effect |
|---------|--------------|-------------|
| 0% (weak) | 90 | Almost transparent |
| 50% | 50 | Medium |
| 100% | 10 | **Vivid, bold candle** |
> **Brighter candle = stronger momentum relative to recent history**
---
## CANDLE COLOR LOGIC
| Condition | Candle & Wick Color | Transparency |
|--------|---------------------|------------|
| **Confirmed Bullish** (`bullCond`) | **Lime Green** | Dynamic (10–90) |
| **Confirmed Bearish** (`bearCond`) | **Red** | Dynamic (10–90) |
| **Neutral / Conflicted** | **Gray** | Fixed 80 (faint) |
> **Wicks and borders match body** → full candle takeover
---
## VISUAL OUTPUT
### 1. **Custom Candles**
```pinescript
plotcandle(open, high, low, close, color=barColor, wickcolor=barColor, bordercolor=barColor)
```
- **Replaces default chart candles**
- **No original candles visible**
### 2. **Labels (Optional)**
- **"Bullish Phase"** → Green label **below low** when:
- MACD histogram **crosses above zero**
- AND RSI **> 50**
- **"Bearish Phase"** → Red label **above high** when:
- MACD histogram **crosses below zero**
- AND RSI **< 50**
> Up to **500 labels** (`max_labels_count=500`)
---
## ALERTS (Built-In)
| Alert | Trigger |
|------|--------|
| **Bullish MACD-RSI Signal** | `ta.crossover(hist, 0) and rsi > 50` |
| **Bearish MACD-RSI Signal** | `ta.crossunder(hist, 0) and rsi < 50` |
> Message: *"MACD crossed above zero with RSI > 50 — Bullish phase."*
---
## HOW TO READ THE CHART
| Visual | Market State | Interpretation |
|-------|-------------|----------------|
| **Bright Lime Candles** | **Strong Bullish Momentum** | High conviction — trend accelerating |
| **Faint Lime Candles** | **Weak Bullish** | Momentum present but not strong |
| **Bright Red Candles** | **Strong Bearish Momentum** | Downtrend with power |
| **Faint Red Candles** | **Weak Bearish** | Selling pressure, but fading |
| **Gray Candles** | **Conflicted / Choppy** | MACD and RSI disagree — avoid |
| **"Bullish Phase" Label** | **New Uptrend Starting** | Entry signal |
| **"Bearish Phase" Label** | **New Downtrend Starting** | Short signal |
---
## TRADING STRATEGY (Example)
### **Long Entry**
1. Wait for **"Bullish Phase" label**
2. Confirm **bright lime candles** (intensity > 50%)
3. Enter on **pullback to support** or **breakout**
4. **Stop Loss**: Below recent swing low
5. **Take Profit**: Trail with EMA or at resistance
### **Short Entry**
1. Wait for **"Bearish Phase" label**
2. Confirm **bright red candles**
3. Enter on **rally to resistance**
> **Best in trending markets** — avoid choppy ranges.
---
## UNIQUE FEATURES
| Feature | Benefit |
|-------|--------|
| **Dual Confirmation** | Avoids false MACD signals in overbought/oversold zones |
| **Dynamic Transparency** | Shows **relative strength** — not just direction |
| **Full Candle Replacement** | Clean, uncluttered chart |
| **Phase Labels** | Marks **exact trend change points** |
| **Built-in Alerts** | No extra setup needed |
---
## LIMITATIONS
| Issue | Note |
|------|------|
| **Lagging by design** | MACD & RSI are reactive |
| **Repainting?** | **No** — all on close |
| **No volume filter** | Add separately for better accuracy |
| **Labels can clutter** | Toggle off in choppy markets |
| **Intensity uses 100-bar lookback** | May lag in very long trends |
---
## BEST USE CASES
| Market | Timeframe | Style |
|-------|----------|------|
| Stocks, Forex, Crypto | 15m, 1H, 4H | Swing / Trend Following |
| **Avoid**: Sideways markets | Yes | High noise = many gray candles |
---
## COMPARISON TO STANDARD MACD/RSI
| Feature | This Indicator | Standard MACD + RSI |
|-------|----------------|---------------------|
| Visual | **Candles = signal** | Subchart lines |
| Confirmation | Built-in dual logic | Manual |
| Strength | Dynamic brightness | Histogram height |
| Alerts | Phase changes | Need custom |
| Chart Clutter | Low | High (two panels) |
> **This is a "one-panel" momentum dashboard**
---
## SUMMARY: What This Indicator Does
> **"MACD-RSI Hybrid Candles"** turns your **entire price chart into a live momentum heatmap** where:
>
> 1. **Candle color** = **MACD + RSI agreement** (Bullish / Bearish / Neutral)
> 2. **Brightness** = **Momentum strength** vs. recent 100 bars
> 3. **Labels & Alerts** = **Trend phase changes** (zero-line crosses with RSI filter)
>
> It **eliminates subcharts** and gives **instant visual confirmation** of:
> - **Trend direction**
> - **Momentum power**
> - **High-probability entries**
---
**Ideal for traders who want:**
- **No indicator panels**
- **Clear, color-coded signals**
- **Strength at a glance**
- **Automated alerts on trend shifts**
---
**Pro Tip**: Use with **volume** or **support/resistance** for **higher win rate**.
Macdcrossing
Ashpi CVD + MACD AlertMACD Crossing + CVD Support
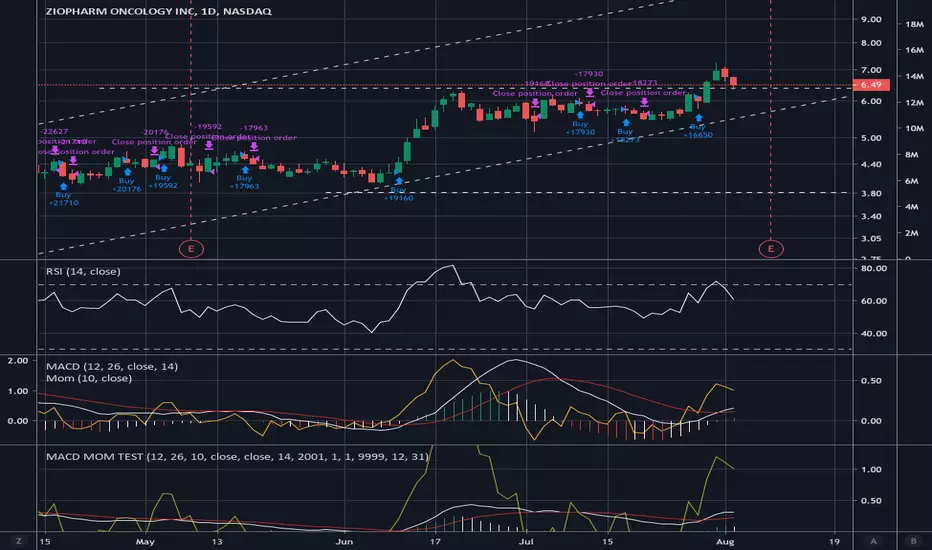
Red arrows signal short entries above the MACD zero line.
Green arrows signal long entries below the zero line.
Blue arrows indicate a re-entry into an existing long trend (crossing above the zero line), typically on pull-backs.
Yellow arrows indicate a re-entry into an existing short trend (crossing below the zero line).
Time-Frame Setup
- Entry on the 15-second chart
- Confirmation on the 30-second chart
- Trade management on the 1-minute chart (or higher)
Always follow the primary trend: RED = Short, GREEN = Long.
Sequence
1. RED signal appears → enter short
2. During the trade, if a GREEN arrow appears on the pull-back → exit trade, or add to position on a YELLOW arrow if the trend continues
The same applies to long trades and BLUE arrows.
Using EMAs (20, 50, 200) can help you spot structural breaks more clearly.
Signal Strength (Delta Distance to Zero Line)
The strength of each signal is enhanced by displaying the distance (delta) to the zero line in the chart:
- Green numbers mean the delta is already above its 10-period moving average (MA10).
- Red numbers mean the delta is below its MA10.
Identifying Sideways Markets
Use a standard MACD as an additional filter to spot ranging phases.
If YELLOW and BLUE arrows occur frequently in succession, it indicates the two MACD lines are moving very close together—trading such conditions should generally be avoided.
MACD Fake Filter [RH]Introducing a new indicator for the TradingView community based on the MACD indicator! This innovative tool goes beyond traditional MACD signals by analyzing positive and negative waves to determine the average height of the waves to filter false cross-over or cross-under signals during the sideways market.
There are two types of waves created by the MACD line, one is a positive wave above the "zero" line and another is a negative wave below "zero" line. Each wave has peaks. This indicator will find the average height of the positive waves' peaks and plot as a green line(by default). Vice-versa it will also find the average height of the negative waves' peaks and plot as a red line(by default).
Example :
This indicator will show labels when the MACD line crosses-under the MACD signal line above the average height of the positive waves.
Vice-versa, the indicator will show labels when the MACD line crosses-above the MACD signal line below the average height of the negative waves.
Example:
Alerts are also available for these types of cross-over and cross-under.
MACD crossover while RSI Oversold/OverboughtThis indicator draws signals on the chart when a Bullish MACD Crossover occurs at the same time RSI is "oversold", and also when Bearish MACD Crossover occurs at the same time RSI is "overbought"
Indicators are drawn on the chart in the following scenarios:
1. Bullish signal
a. MACD bullish crossover occurs on a single bar
b. RSI was below the Oversold threshold (29 by default) within the prior 5 bars
2. Bearish signal
a. MACD bearish crossover occurs on a singnle bar
b. RSI was above the Overbought threshold (71 by default) within the prior 5 bars
MACD MOMENTUM STRATEGYHey,
First of I'm not so familiar with Pine Editor, yet.
But a do need some help with a trick thing I*ve been working on.
As you can see I*ve merge the MACD and the MOMENTUM indicators in the same "chart" this have been working pretty well for me as a trading strategy. But now a chat tho create a real strategy with Pine Editor based on the same data. The thing is that I can't seem tho get the MOMENTUM indicator to and the MACD indicator in the same (different) scale in my strategy as when I merge them.
I suspect this got something to do with my chose of source för the MOMENTUM indicator, but I'm not 100.
I would be grateful for all kinds of feedback and tips for a solutions on this.
Thanks.


