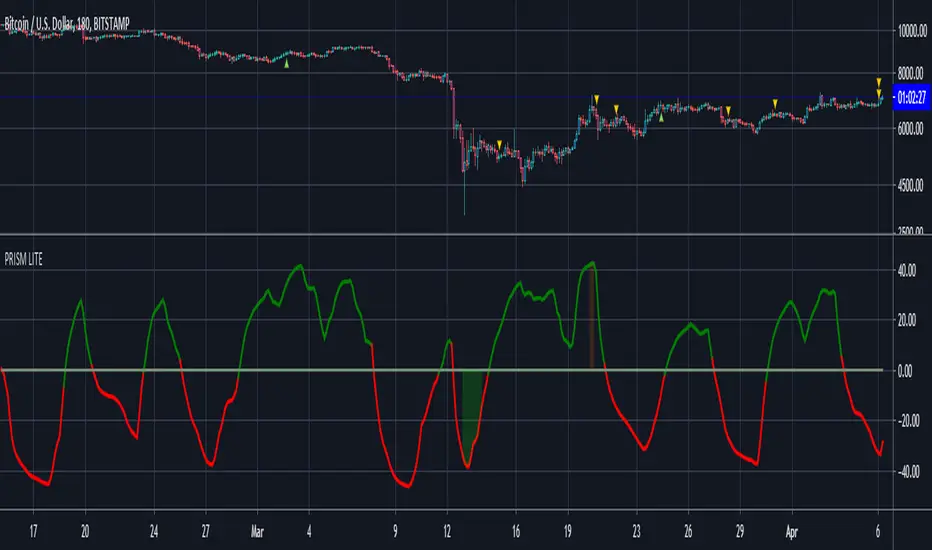
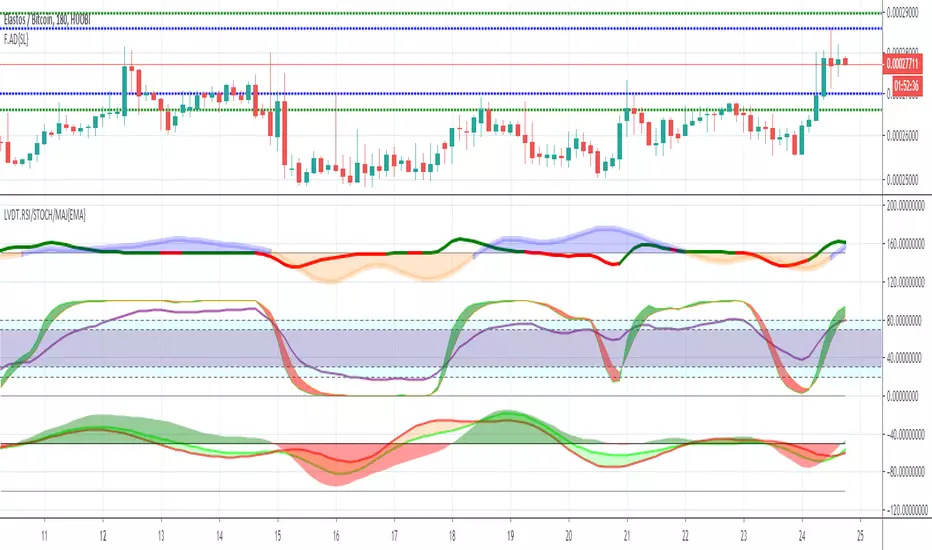
PRISMpSAR derived oscillator with its set of RSI & StochRSI and MAJestic (Momentum, Acceleration, Jerk) Oscillators Set
pSAR and MAJ oscillators can be disabled and hidden.
~ * ~ * ~ * ~ * ~ * ~ * ~ * ~ * ~ * ~ * ~ * ~ * ~ * ~ * ~ * ~ * ~ * ~ * ~ * ~ * ~
Note:
In no way is this intended as a financial/investment/trading advice. You are responsible for your own investment decisions and trades.
Please exercise your own judgement for your own trades base on your own risk-aversion level and goals as an investor or a trader. The use of OTHER indicators and analysis in conjunction (tailored to your own style of investing/trading) will help improve confidence of your analysis, for you to determine your own trade decisions.
~ * ~ * ~ * ~ * ~ * ~ * ~ * ~ * ~ * ~ * ~ * ~ * ~ * ~ * ~ * ~ * ~ * ~ * ~ * ~ * ~
Please check out my other indicators sets and series, e.g.
LIVIDITIUM (dynamic levels),
AEONDRIFT (multi-levels standard deviation bands),
FUSIONGAPS (MA based oscillators),
MAJESTIC (Momentum/Acceleration/Jerk Oscillators),
PRISM (pSAR based oscillator, with RSI/StochRSI as well as Momentum/Acceleration/Jerk indicators),
PDF (parabolic SAR /w HighLow Trends Indicator/Bar-color-marking + Dynamic Fib Retrace and Extension Level)
and more to come.
Constructive feedback and suggestions are welcome.
If you like any of my set of indicators, and it has benefited you in some ways, please consider tipping a little to my HRT fund. =D
cybernetwork @ EOS
37DzRVwodp5UZBYjCKvVoZ5bDdDqhr7798 @ BTC
MPr8Zhmpsx2uh3F5R4WD98MRJJpwuLBhA3 @ LTC
1Je6c1vvSCW7V2vA6RYDt6CEvqGYgT44F4 @ BCH
AS259bXGthuj4VZ1QPzD39W3ut4fQV5giC @ NEO
rDonew8fRDkZFv7dZYe5w3L1vJSE51zFAx @ Ripple XRP
0xc0161d27201914FC0bAe5e350a193c8658fc4742 @ ETH
GAX6UDAJ52OGZW4FVVG3WLGIOJLGG2C7CTO5ZDUK2P6M6QMYBJMSJTDL @ Stellar XLM
xrb_16s8cj8eoangfa96shsnkir3wctdzy76ajui4zexek6xmqssweu85rdjxrt4 @ Nano
~ JuniAiko
(=^~^=)v~
Majestic
Relative Candle Volatility IndexI am not certain if something similar is already available out there. However, here's my own implementation of my simple idea of using the length of the candle-body, or wicks (high-low), to derive a Relative Volatility Index / Oscillator.
In summary: When the R.CVI is significantly positive, it indicates a sudden increase in volatility; whereas, when the R.CVI drops significantly negative, it indicates a sudden decrease in volatility -- in relative to the (just prior) market trend.
If you do wish to copy, modify, and publish an alternate version base on this script, please do not plagiarize and kindly reference/link back to this original script. =D
~ * ~ * ~ * ~ * ~ * ~ * ~ * ~ * ~ * ~ * ~ * ~ * ~ * ~ * ~ * ~ * ~ * ~ * ~ * ~ * ~
Note:
In no way is this intended as a financial/investment/trading advice. You are responsible for your own investment decisions and trades.
Please exercise your own judgement for your own trades base on your own risk-aversion level and goals as an investor or a trader. The use of OTHER indicators and analysis in conjunction (tailored to your own style of investing/trading) will help improve confidence of your analysis, for you to determine your own trade decisions.
~ * ~ * ~ * ~ * ~ * ~ * ~ * ~ * ~ * ~ * ~ * ~ * ~ * ~ * ~ * ~ * ~ * ~ * ~ * ~ * ~
Please check out my other indicators sets and series, e.g.
LIVIDITIUM (dynamic levels),
AEONDRIFT (multi-levels standard deviation bands),
FUSIONGAPS (MA based oscillators),
MAJESTIC (Momentum/Acceleration/Jerk Oscillators),
PRISM (pSAR based oscillator, with RSI/StochRSI as well as Momentum/Acceleration/Jerk indicators),
PDF (parabolic SAR /w HighLow Trends Indicator/Bar-color-marking + Dynamic Fib Retrace and Extension Level)
and more to come.
Constructive feedback and suggestions are welcome.
~ JuniAiko
(=^~^=)v~

FG-DIVERGENCE V4 {50/15-Series} [Buy/Sell]This script is derived from the FUSIONGAPS V4 {50/15-Series} to generate buy/sell signals.
~ * ~ * ~ * ~ * ~ * ~ * ~ * ~ * ~ * ~ * ~ * ~ * ~ * ~ * ~ * ~ * ~ * ~ * ~ * ~ * ~
Note:
In no way is this intended as a financial/investment/trading advice. You are responsible for your own investment decisions and trades.
Please exercise your own judgement for your own trades base on your own risk-aversion level and goals as an investor or a trader. The use of OTHER indicators and analysis in conjunction (tailored to your own style of investing/trading) will help improve confidence of your analysis, for you to determine your own trade decisions.
~ * ~ * ~ * ~ * ~ * ~ * ~ * ~ * ~ * ~ * ~ * ~ * ~ * ~ * ~ * ~ * ~ * ~ * ~ * ~ * ~
Please check out my other indicators sets and series, e.g.
LIVIDITIUM (dynamic levels),
AEONDRIFT (multi-levels standard deviation bands),
FUSIONGAPS (MA based oscillators),
MAJESTIC (Momentum/Acceleration/Jerk Oscillators),
PRISM (pSAR based oscillator, with RSI/StochRSI as well as Momentum/Acceleration/Jerk indicators),
PDF (parabolic SAR /w HighLow Trends Indicator/Bar-color-marking + Dynamic Fib Retrace and Extension Level)
and more to come.
Constructive feedback and suggestions are welcome.
~ JuniAiko
(=^~^=)v~
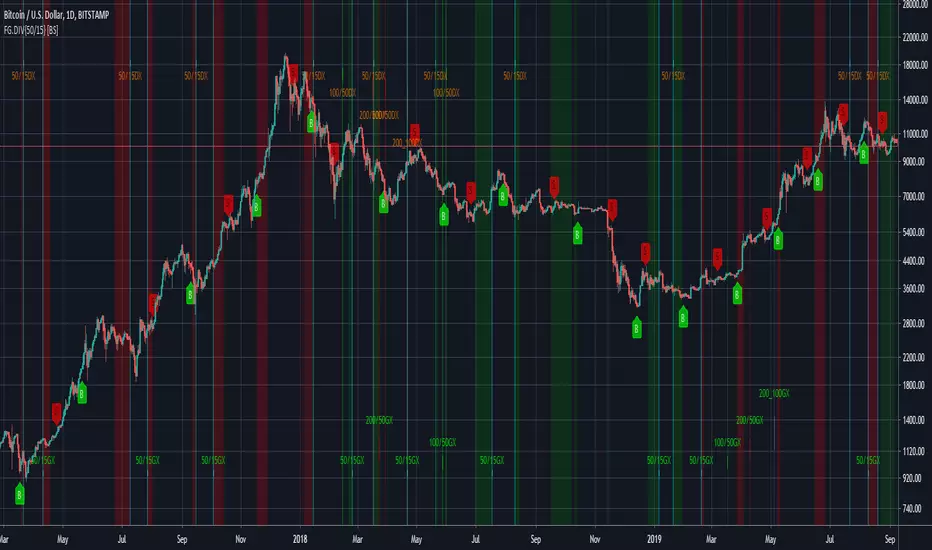
FG-DIVERGENCE V4 {50/15-Series}This script is derived from the FUSIONGAPS V4 {50/15-Series} to generate buy/sell signals.
Green Dot = Buy Signal
Red Dot = Sell Signal
~ * ~ * ~ * ~ * ~ * ~ * ~ * ~ * ~ * ~ * ~ * ~ * ~ * ~ * ~ * ~ * ~ * ~ * ~ * ~ * ~
Note:
In no way is this intended as a financial/investment/trading advice. You are responsible for your own investment decisions and trades.
Please exercise your own judgement for your own trades base on your own risk-aversion level and goals as an investor or a trader. The use of OTHER indicators and analysis in conjunction (tailored to your own style of investing/trading) will help improve confidence of your analysis, for you to determine your own trade decisions.
~ * ~ * ~ * ~ * ~ * ~ * ~ * ~ * ~ * ~ * ~ * ~ * ~ * ~ * ~ * ~ * ~ * ~ * ~ * ~ * ~
Please check out my other indicators sets and series, e.g.
LIVIDITIUM (dynamic levels),
AEONDRIFT (multi-levels standard deviation bands),
FUSIONGAPS (MA based oscillators),
MAJESTIC (Momentum/Acceleration/Jerk Oscillators),
PRISM (pSAR based oscillator, with RSI/StochRSI as well as Momentum/Acceleration/Jerk indicators),
PDF (parabolic SAR /w HighLow Trends Indicator/Bar-color-marking + Dynamic Fib Retrace and Extension Level)
and more to come.
Constructive feedback and suggestions are welcome.
~ JuniAiko
(=^~^=)v~
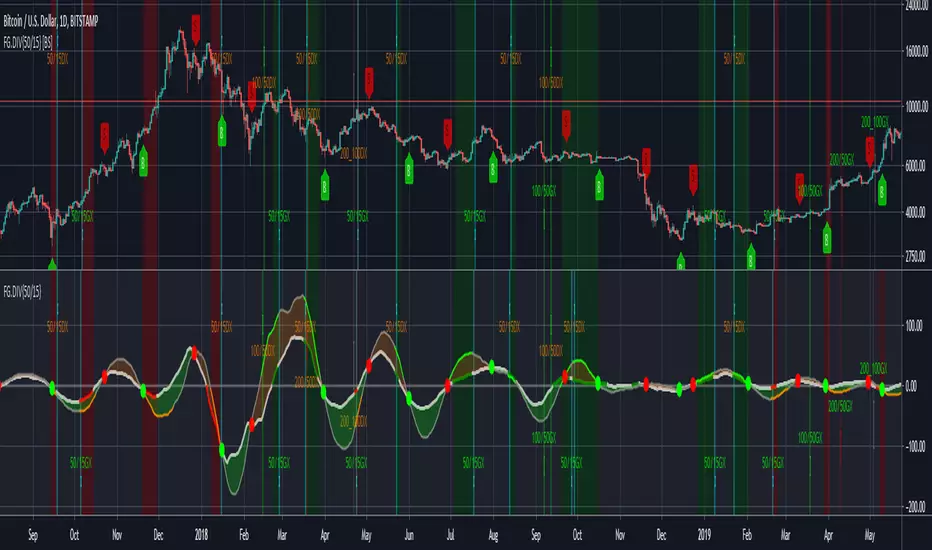
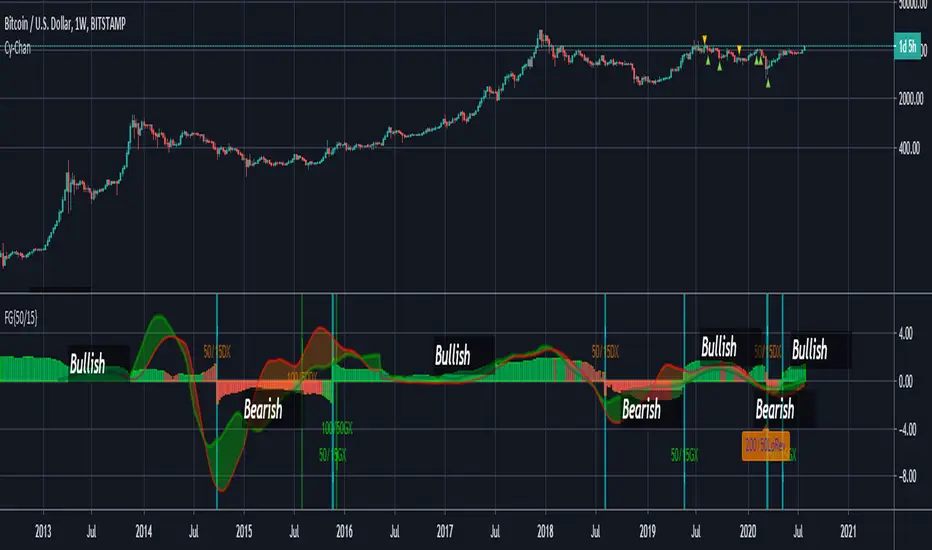
FUSIONGAPS V4 {50/15-Series}Base on the FUSIONGAPS oscillator series, but Only the 50/15 oscillator is plotted, and with Momentum and Acceleration oscillators added.
The thickest line is the FG oscillator: Red/Green coloring indicates if the market is in a Bearish/Bullish period.
The green colored line is the DFG oscillator (DIFFERENTIAL FUSIONGAPS: Price Momentum)
The red colored line is the D2FG oscillator (DOUBLE-DIFFERENTIAL FUSIONGAPS: Price Acceleration)
Indicators:
DeathCrosses ( DX ) and GoldenCrosses ( GX )
Momentum Reversal indicators (D2FG based filter applied to reduce false-positives, but can be manually disabled.)
~ * ~ * ~ * ~ * ~ * ~ * ~ * ~ * ~ * ~ * ~ * ~ * ~ * ~ * ~ * ~ * ~ * ~ * ~ * ~ * ~
Note:
In no way is this intended as a financial/investment/trading advice. You are responsible for your own investment decisions and trades.
Please exercise your own judgement for your own trades base on your own risk-aversion level and goals as an investor or a trader. The use of OTHER indicators and analysis in conjunction (tailored to your own style of investing/trading) will help improve confidence of your analysis, for you to determine your own trade decisions.
~ * ~ * ~ * ~ * ~ * ~ * ~ * ~ * ~ * ~ * ~ * ~ * ~ * ~ * ~ * ~ * ~ * ~ * ~ * ~ * ~
Please check out my other indicators sets and series, e.g.
LIVIDITIUM (dynamic levels),
AEONDRIFT (multi-levels standard deviation bands),
FUSIONGAPS (MA based oscillators),
MAJESTIC (Momentum/Acceleration/Jerk Oscillators),
PRISM (pSAR based oscillator, with RSI/StochRSI as well as Momentum/Acceleration/Jerk indicators),
PDF (parabolic SAR /w HighLow Trends Indicator/Bar-color-marking + Dynamic Fib Retrace and Extension Level)
and more to come.
Constructive feedback and suggestions are welcome.
~ JuniAiko
(=^~^=)v~
PDF {pSAR /w HiLo Trends + Fib Retrace/Extension Levels}parabolic SAR /w HighLow Trends Indicator/Bar-color-marking + Dynamic Fib Retrace and Extension Level
~ * ~ * ~ * ~ * ~ * ~ * ~ * ~ * ~ * ~ * ~ * ~ * ~ * ~ * ~ * ~ * ~ * ~ * ~ * ~ * ~
Note:
In no way is this intended as a financial/investment/trading advice. You are responsible for your own investment decisions and trades.
Please exercise your own judgement for your own trades base on your own risk-aversion level and goals as an investor or a trader. The use of OTHER indicators and analysis in conjunction (tailored to your own style of investing/trading) will help improve confidence of your analysis, for you to determine your own trade decisions.
~ * ~ * ~ * ~ * ~ * ~ * ~ * ~ * ~ * ~ * ~ * ~ * ~ * ~ * ~ * ~ * ~ * ~ * ~ * ~ * ~
Please check out my other indicators sets and series, e.g.
LIVIDITIUM (dynamic levels),
AEONDRIFT (standard deviation bands),
FUSIONGAPS (MA based oscillators),
MAJESTIC (Momentum/Acceleration/Jerk Oscillators),
PRISM (pSAR based oscillator, with RSI/StochRSI as well as Momentum/Acceleration/Jerk indicators),
and more to come.
Constructive feedback and suggestions are welcome.
~ JuniAiko
(=^~^=)v~

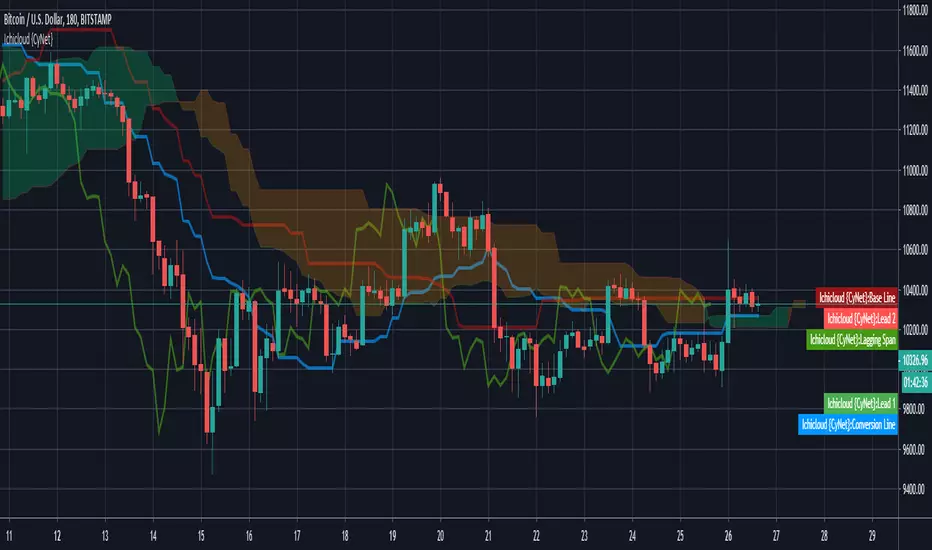
Ichimoku Cloud {Cybernetwork}Ichimoku Cloud with parameters optimized for Crypto.
~ * ~ * ~ * ~ * ~ * ~ * ~ * ~ * ~ * ~ * ~ * ~ * ~ * ~ * ~ * ~ * ~ * ~ * ~ * ~ * ~
Taken from: school.stockcharts.com (Aug 2019)
Bullish Signals:
Price moves above cloud (trend)
Cloud turns from red to green (ebb-flow within trend)
Price Moves above the Base Line (momentum)
Conversion Line moves above Base Line (momentum)
Bearish Signals:
Price moves below cloud (trend)
Cloud turns from green to red (ebb-flow within trend)
Price Moves below Base Line (momentum)
Conversion Line moves below Base Line (momentum)
~ * ~ * ~ * ~ * ~ * ~ * ~ * ~ * ~ * ~ * ~ * ~ * ~ * ~ * ~ * ~ * ~ * ~ * ~ * ~ * ~
Please check out my other indicators sets and series, e.g.
LIVIDITIUM (dynamic levels),
AEONDRIFT (standard deviation bands),
FUSIONGAPS (MA based oscillators),
MAJESTIC (Momentum/Acceleration/Jerk Oscillators),
PRISM (PSAR based oscillator, with RSI/StochRSI as well as Momentum/Acceleration/Jerk indicators),
and more to come.
Constructive feedback and suggestions are welcome.
~ JuniAiko
(=^~^=)v~
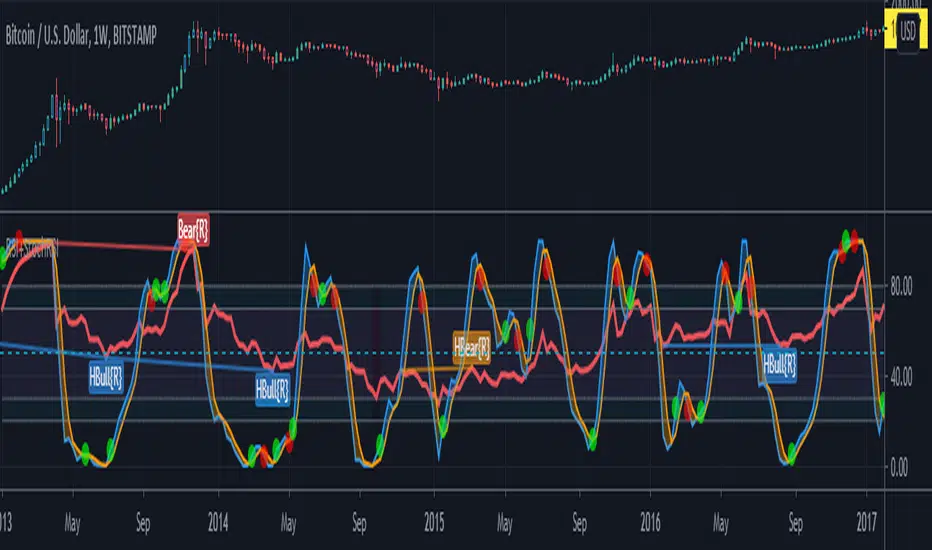

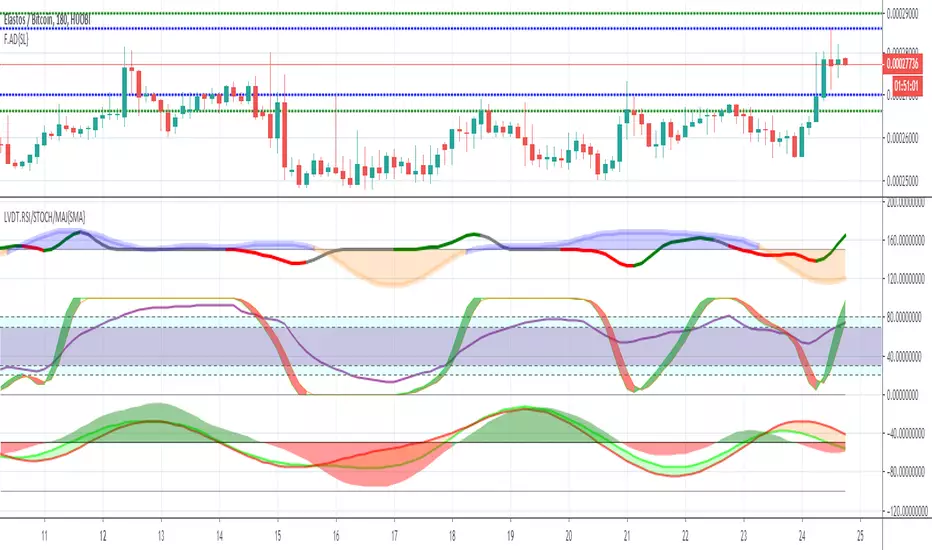
LIVIDITIUM RSI/STOCH/MAJ Oscillator Set {SMA}LVDT RSI oscillator
LVDT STOCHASTIC-RSI oscillator
LVDT MAJ (Momentum/Acceleration/Jerk) oscillators + signals ( Default = Disabled)
~JuniAiko
(=^~^=)v~
LIVIDITIUM RSI/STOCH/MAJ Oscillator Set {EMA}LVDT RSI oscillator
LVDT STOCHASTIC-RSI oscillator
LVDT MAJ (Momentum/Acceleration/Jerk) oscillators + signals ( Default = Disabled)
~JuniAiko
(=^~^=)v~
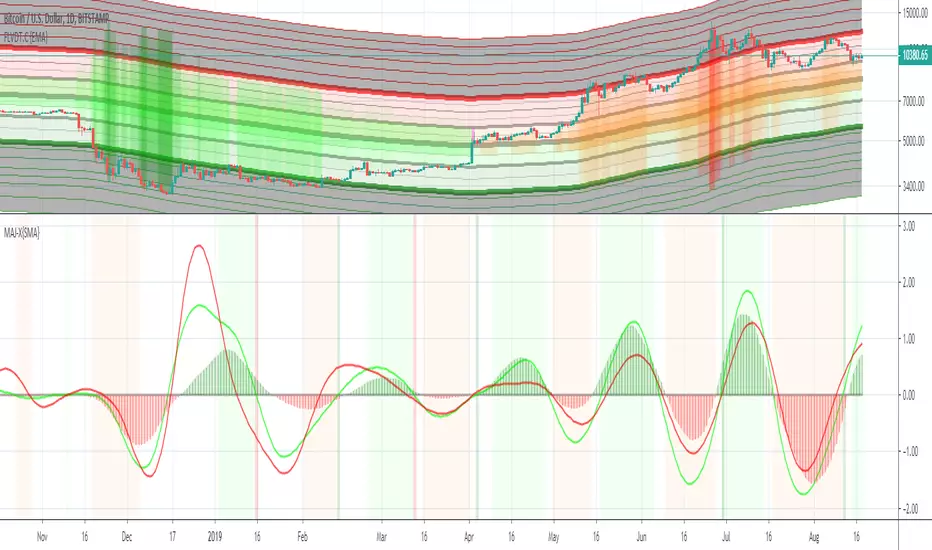
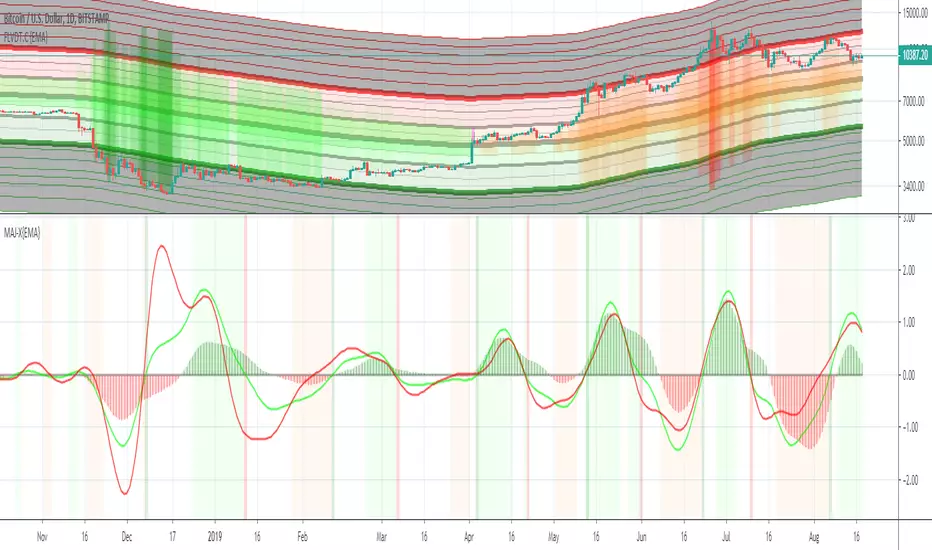
MAJESTIC-X {EMA}The MAJESTIC (MAJ) is a set of M omentum/ A cceleration/ J erk oscillators.
This "X" edition comes with optimized time-frames to be used as a companion with the Fast LIVIDITIUM Channel (FLVDT.C).
The option to switch to custom time-frames is also available in this version.
The filled-histogram is the Momentum oscillator
The lime colored line is the Acceleration oscillator
The red colored line is the Jerk oscillator
The analysis candles-range have been optimized for the following time-frames:
monthly (1M) = 1
3W = 1
2W = 2
weekly (1W) = 4
5D = 6
4D = 8
3D = 10
2D = 15
daily (1D) = 30
240 hr = 80
Note: In no way is the MAJESTIC oscillator intended as a financial/investment/trading advice. You are responsible for your own investment decisions and trades.
Please exercise your own judgement for your own trades base on your own risk-aversion level and goals as an investor or a trader. The use of OTHER indicators and analysis in conjunction (tailored to your own style of investing/trading) will help improve confidence of your analysis, for you to determine your own trade decisions.
~JuniAiko
(=^~^=)v~
MAJESTIC-X {SMA}The MAJESTIC (MAJ) is a set of M omentum/ A cceleration/ J erk oscillators.
This "X" edition comes with optimized time-frames to be used as a companion with the Fast LIVIDITIUM Channel (FLVDT.C).
The option to switch to custom time-frames is also available in this version.
The filled-histogram is the Momentum oscillator
The lime colored line is the Acceleration oscillator
The red colored line is the Jerk oscillator
The analysis candles-range have been optimized for the following time-frames:
monthly (1M) = 1
3W = 1
2W = 2
weekly (1W) = 4
5D = 6
4D = 8
3D = 10
2D = 15
daily (1D) = 30
240 hr = 80
Note: In no way is the MAJESTIC oscillator intended as a financial/investment/trading advice. You are responsible for your own investment decisions and trades.
Please exercise your own judgement for your own trades base on your own risk-aversion level and goals as an investor or a trader. The use of OTHER indicators and analysis in conjunction (tailored to your own style of investing/trading) will help improve confidence of your analysis, for you to determine your own trade decisions.
~JuniAiko
(=^~^=)v~