[HA] Heikin-Ashi Shadow Candles// For overlaying Heikin Ashi candles over basic charts, or for use in it's own panel as an oscillator.
// Enjoy the visual cues of HA candles, without giving up price action awareness.
// Good for learning and comparison.
// Aug 11 2022
Release Notes: * Bugfix: Candle color was based on classic direction not HA direction (did not update cover photo).
// Aug 12 2022
Release Notes: * Implemented true oscillator mode.
Provided as separate plot (styles tab) or mode switch option (Inputs tab). TV gets spazzy with "styles tab" "default hidden" plots, and will reset them if any variables are modified that affect them (i.e. wick color override). Mode switch should be sufficient for both users.
// Aug 21 2022
Republished because of typo in indicator name prevented search.
Indicateur de Momentum (MOM)

Munich's Momentum Wave V2MUNICH'S MOMENTUM WAVE VERSION 2 IS LIVE!!!
There are a few big things to note with this one.
I decided to upload this as an entirely new script due to the number of changes differing from the first version, but as the last one, this will still work on ANY TIMEFRAME, ANY ASSET CLASS, ANY PRICE! .
This momentum wave indicator now will give you data for when trend could turn, and two momentum indicators to help you decide when to take an entry.
First off,
*I have added an alma ma (alma) that will track momentum alongside price action and further lead the indicator consisting of the Munich waves.
* The background feature will track the price using a method derived from the Bollinger bands, after calculations, it will color the background based on the average of the momentum's ema's, the alma ma, and also the alma in comparison to the alma's value pre offset ( the offset is 3, following the basis).
*There are now 5 basis values given from the increase in ema samples.
If anyone has any questions feel free to pm me or comment below. Thank you guys for the support! :)
INDEX:BTCUSD TVC:NDQ AMEX:SPY BITSTAMP:ETHUSD BINANCE:BTCUSDT FX:USDJPY NASDAQ:AAPL

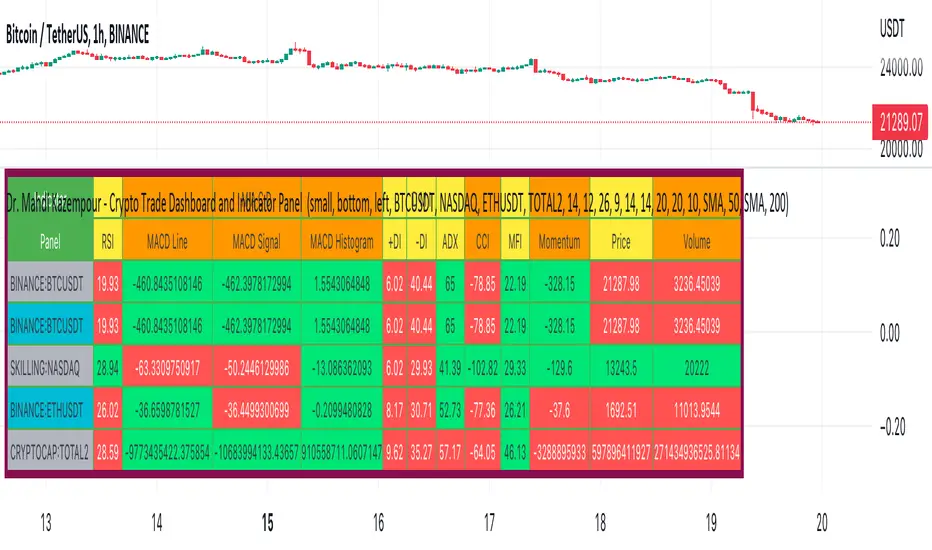
Dr. Mahdi Kazempour - Crypto Trade Dashboard and Indicator PanelA great panel for crypto traders all in one table:
Price, Volume, RSI, MACD, ADI, MOM
1) current symbol
2) BTCUSDT
3) NASDAQ
4) ETHUSDT
5) TOTAL2
München's Momentum WaveMUNICH'S MOMENTUM WAVE:
This momentum tracker has features sampled from Madrid's moving average ribbon but has differentiated many values, parameters, and usage of integers. It is derived using momentum and then creates moving averages and mean lengths to help support the strength of a move in price action, and also has the key mean length that helps determine HL/LH or rejections into trend continuation. This indicator works on ALL TIME FRAMES, ALL ASSET CLASSES ON ALL SETTINGS!!
HOW DO I USE IT?
*First off, I have arranged the input settings into groups based on the parts of the indicator it affects.
*You want to use the aqua/white/yellow (Munich's line) as your leading indicator, this is a combined average of the MoM indicator.
* When using Munich's line you want to look at the relation to the mean line (the flat line that adjusts based on price action. You will often see rejections of this line into trend continuation. I personally have caught perfect LH/HL bounce trades off of this indicator.
* Use the Background and other colored moving averages to help pre-determine moves based on the -3 offset value of Munich's line. This was by design not to create 'accurate' results, but to help predict momentum swings based on sharper moves in price action better than if all values lined up to the current bar.
Cheat Code's Notes:
I hope you guys find this indicator to be useful, this is most likely the best indicator that I have written. Simply for the fact it is useful on any chart, any timeframe with any setting. If you guys have any issues with it, shoot me a pm or drop a comment. Thanks!
-CheatCode1
BINANCE:BTCUSDT BITSTAMP:ETHUSD BITSTAMP:BTCUSD PEPPERSTONE:JPYX TVC:DXY TVC:NDQ AMEX:SPY

Trend Friendly RSITrend Friendly RSI
Unlike the standard RSI, "Trend Friendly RSI" adapts to the trend. RSI and other momentum-based oscillators cannot give a buy signal in uptrends and a sell signal in downtrends because they do not take into account the momentum of the trend and behave as if the price is in a constant sideways trend. "Trend Friendly RSI", on the other hand, takes into account the momentum of the trend of your chosen length and subtracts it from the current momentum, thus giving more realistic buy and sell signals.
use it to identify your long-term investments and trading entry points for hodl. It would be wise to use this indicator for assets that you have done fundamental analysis and are sure of the trend direction. it doesn't know what the price will do, it just shows the points that are suitable for you.
remember this indicator will fail in horizontal trends.

Dap's Oscillator- Short Term Momentum and Trend. BINANCE:BTCUSDT BYBIT:BTCUSDT BYBIT:ETHUSDT BINANCE:ETHUSDT
DAP's OSCILLATOR:
WHAT IS IT?
This Oscillator was created to inspire confidence in the short-term trend of traders. This will work very well with a volatility metric (I recommend BBWP by @The_Caretaker)
WHAT IS IT MADE OF?
1. Consists of a series of equations (mainly the difference between simple to exponential moving averages) and Standard deviations of these moving average differences (length equivalent to the length of sampled ma's)
2. These equations are then boiled down through an averaging process array, after averaging the covariants are equated against the variants of the positive side of the array. This is what is presented as the aqua line.
3. The RC average (yellow) is the sma following the DAP'S Oscillator at a specified length
4. The most important part of this indicator is simply the momentum oscillator represented as a green or red line based on the value relative to the Oscillators.
HOW DO I USE THIS?
As I mentioned before mixed with a volatility metric, it should set you up for a good decision based on short-term trends. I would say to be careful for periods of consolidation, with the consolidation the momentum often meets hands with DAP's Oscillator and can cause fake-outs. You want to spot divergences from the price to the momentum difference, as well as room to work down or upward to secure a good entry on a position.
CHEAT CODE'S NOTES:
I appreciate everyone who has boosted my previous scripts, it means a lot. If you want to translate words to pine script onto a chart, feel free to PM me. I would be happy to help bring an indicator to life. I may take a quick break but will be back shortly to help create more cheat codes for yall. Thanks!
-Cheat Code

Heinkin-Ashi Shadow Candles// Public Domain
// By JollyWizard
// For overlaying Heikin Ashi candles over basic charts, or for use in it's own panel as an oscillator.
// Enjoy the visual cues of HA candles, without giving up price action awareness.
// Good for learning and comparison.

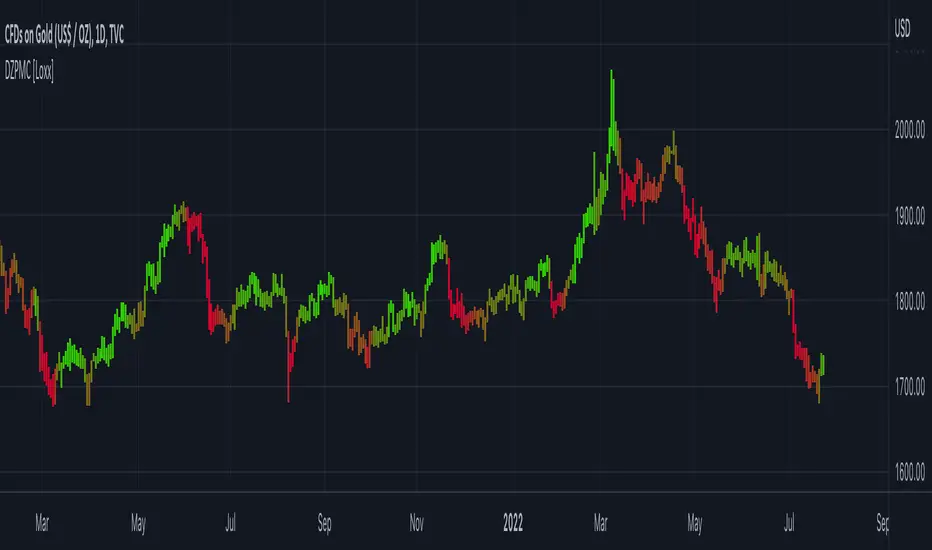
Synthetic EMA Momentum w/ DSL [Loxx]Synthetic EMA Momentum w/ DSL is a momentum indicator that is calculated with 5 different EMAs of increasing period to derive a final momentum value. This helps reduce noise and improve signal quality. Discontinued signal lines are uses to calculate signal values.
What are DSL Discontinued Signal Line?
A lot of indicators are using signal lines in order to determine the trend (or some desired state of the indicator) easier. The idea of the signal line is easy : comparing the value to it's smoothed (slightly lagging) state, the idea of current momentum/state is made.
Discontinued signal line is inheriting that simple signal line idea and it is extending it : instead of having one signal line, more lines depending on the current value of the indicator.
"Signal" line is calculated the following way :
When a certain level is crossed into the desired direction, the EMA of that value is calculated for the desired signal line
When that level is crossed into the opposite direction, the previous "signal" line value is simply "inherited" and it becomes a kind of a level
This way it becomes a combination of signal lines and levels that are trying to combine both the good from both methods.
In simple terms, DSL uses the concept of a signal line and betters it by inheriting the previous signal line's value & makes it a level.
Included:
Loxx's Expanded Source Types
Alerts
Signals
Bar coloring
Related indicators
Smoother Momentum MACD w/ DSL
T3 Velocity

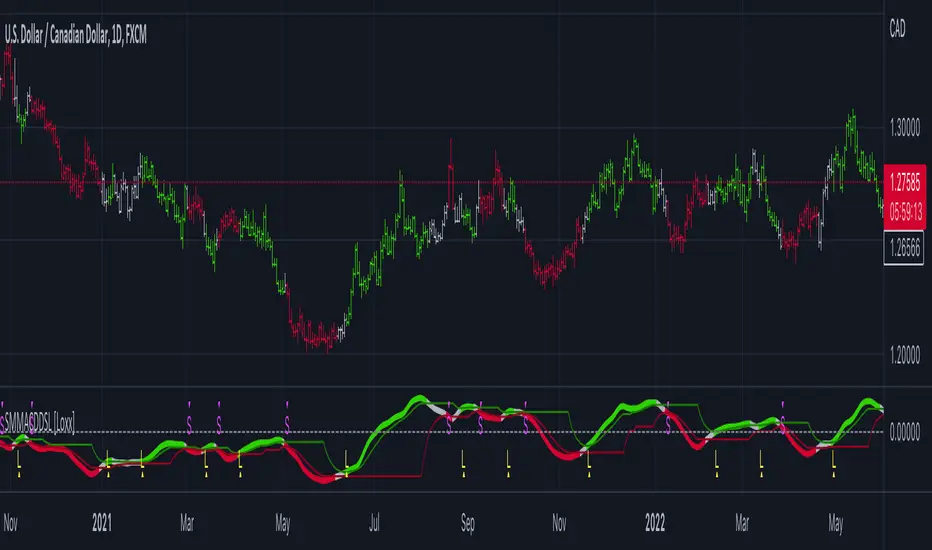
Smoother Momentum MACD w/ DSL [Loxx]Smoother Momentum MACD w/ DSL uses two different EMA calculations to derive momentum and then calculates the MACD between those momentum outputs. This indicator uses a variation of Discontinued Signal Lines for the breakout/breakdown/reversal signals . There are three different signal types: middle, levels, and slope. I've also added alerts and signals. The discontinued signal lines can be smoothed using EMA or Fast EMA.
What are DSL Discontinued Signal Line?
A lot of indicators are using signal lines in order to determine the trend (or some desired state of the indicator) easier. The idea of the signal line is easy : comparing the value to it's smoothed (slightly lagging) state, the idea of current momentum/state is made.
Discontinued signal line is inheriting that simple signal line idea and it is extending it : instead of having one signal line, more lines depending on the current value of the indicator.
"Signal" line is calculated the following way :
When a certain level is crossed into the desired direction, the EMA of that value is calculated for the desired signal line
When that level is crossed into the opposite direction, the previous "signal" line value is simply "inherited" and it becomes a kind of a level
This way it becomes a combination of signal lines and levels that are trying to combine both the good from both methods.
In simple terms, DSL uses the concept of a signal line and betters it by inheriting the previous signal line's value & makes it a level.
Included:
Loxx's Expanded Source Types
Alerts
Signals
Bar coloring
Other momentum indicators
CFB-Adaptive Velocity Histogram
Variety-Filtered, Squeeze Moving Averages
William Blau Ergodic Tick Volume Indicator (TVI)
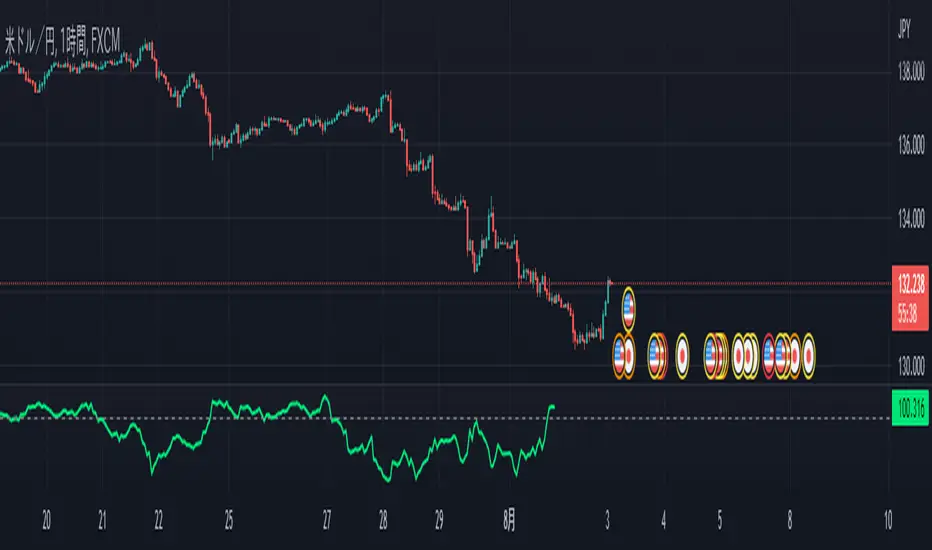
Chiko-Span Momentum_PineScript_Version5This is Momentum indicator based on "Chiko-span" of Ichimoku Kinko-Hyo.
Differ from normal momentum indicator, this indicator is using "close" and "open" as default parameter which is based on 9 week-candle chart Invented by Ichimoku-Sanjin. And, It is located 26 period before to match chiko-span.
(Parameters can change as you like)
The usage is same as normal momentum indicator so please check momentum indicator usage. However, due to use this indicator, it may support to compare momentum of chiko-span movement and to predict effect 5 lines of ichimoku.
For example, when price break out tenkan-sen, you can measure slope or period of chiko-span momentum and compare previously chiko-span momentum. If momentum is stronger than previously price, we can think that price try to out kijun- sen, touch cloud or break out cloud.
I wish, this indicator helps ichimoku users.
RMI TFM:Chart + 3D + 1W + 1M This indicator defaults to;
Period: 20
Look Back For Momentum :5
OverBought: 80
OverSold :20
of a Relative Momentum Index indicator;
1- RMI value according to the candle duration selected in the chart, (black)
2- RMI value according to pure 3D candles with the security() function, (blue)
3- With the security() function, the RMI value according to pure 1W candles, (orange)
4- With the security() function, the RMI value (Gray) according to 1M candles shows.
It also calculates RMI according to the price value you enter manually and shows or hides it according to your preference.

Trend Momentum Divergence (TMD)Shout out to Lazy Bear, Bunghole, and Trading View for script code for this make.
In this study you will have a visual representation of the strength and momentum of a trend and possibilities of where the market is heading. You can use the Blue and White momentum waves to spot divergences in a up oe down trend for potential reversals. When a green dot appears under the lower level with divergence then it is a indication that we should consider looking to buy. If the red dot appears over the upper level with divergence we should be looking to short/sell. The custom MFI indicator determines how much money is flowing into the market. If it is green that means money is flowing into the market and if it shows red it means that money is flowing out of the market. You can spot divergences in the money flow as well as the RSI. The Blue and Green lines from the RCI3line indicator are used for higher timeframe momentum based on current chart timeframe and we can see when they cross over.

Dynamic Zones Polychromatic Momentum Candles [Loxx]Dynamic Zones Polychromatic Momentum Candles is a candle coloring, momentum indicator that uses Jurik Filtering and Dynamic Zones to calculate the monochromatic color between two colors.
What is Jurik Volty used in the Juirk Filter?
One of the lesser known qualities of Juirk smoothing is that the Jurik smoothing process is adaptive. "Jurik Volty" (a sort of market volatility ) is what makes Jurik smoothing adaptive. The Jurik Volty calculation can be used as both a standalone indicator and to smooth other indicators that you wish to make adaptive.
What is the Jurik Moving Average?
Have you noticed how moving averages add some lag (delay) to your signals? ... especially when price gaps up or down in a big move, and you are waiting for your moving average to catch up? Wait no more! JMA eliminates this problem forever and gives you the best of both worlds: low lag and smooth lines.
What are Dynamic Zones?
As explained in "Stocks & Commodities V15:7 (306-310): Dynamic Zones by Leo Zamansky, Ph .D., and David Stendahl"
Most indicators use a fixed zone for buy and sell signals. Here’ s a concept based on zones that are responsive to past levels of the indicator.
One approach to active investing employs the use of oscillators to exploit tradable market trends. This investing style follows a very simple form of logic: Enter the market only when an oscillator has moved far above or below traditional trading lev- els. However, these oscillator- driven systems lack the ability to evolve with the market because they use fixed buy and sell zones. Traders typically use one set of buy and sell zones for a bull market and substantially different zones for a bear market. And therein lies the problem.
Once traders begin introducing their market opinions into trading equations, by changing the zones, they negate the system’s mechanical nature. The objective is to have a system automatically define its own buy and sell zones and thereby profitably trade in any market — bull or bear. Dynamic zones offer a solution to the problem of fixed buy and sell zones for any oscillator-driven system.
An indicator’s extreme levels can be quantified using statistical methods. These extreme levels are calculated for a certain period and serve as the buy and sell zones for a trading system. The repetition of this statistical process for every value of the indicator creates values that become the dynamic zones. The zones are calculated in such a way that the probability of the indicator value rising above, or falling below, the dynamic zones is equal to a given probability input set by the trader.
To better understand dynamic zones, let's first describe them mathematically and then explain their use. The dynamic zones definition:
Find V such that:
For dynamic zone buy: P{X <= V}=P1
For dynamic zone sell: P{X >= V}=P2
where P1 and P2 are the probabilities set by the trader, X is the value of the indicator for the selected period and V represents the value of the dynamic zone.
The probability input P1 and P2 can be adjusted by the trader to encompass as much or as little data as the trader would like. The smaller the probability, the fewer data values above and below the dynamic zones. This translates into a wider range between the buy and sell zones. If a 10% probability is used for P1 and P2, only those data values that make up the top 10% and bottom 10% for an indicator are used in the construction of the zones. Of the values, 80% will fall between the two extreme levels. Because dynamic zone levels are penetrated so infrequently, when this happens, traders know that the market has truly moved into overbought or oversold territory.
Calculating the Dynamic Zones
The algorithm for the dynamic zones is a series of steps. First, decide the value of the lookback period t. Next, decide the value of the probability Pbuy for buy zone and value of the probability Psell for the sell zone.
For i=1, to the last lookback period, build the distribution f(x) of the price during the lookback period i. Then find the value Vi1 such that the probability of the price less than or equal to Vi1 during the lookback period i is equal to Pbuy. Find the value Vi2 such that the probability of the price greater or equal to Vi2 during the lookback period i is equal to Psell. The sequence of Vi1 for all periods gives the buy zone. The sequence of Vi2 for all periods gives the sell zone.
In the algorithm description, we have: Build the distribution f(x) of the price during the lookback period i. The distribution here is empirical namely, how many times a given value of x appeared during the lookback period. The problem is to find such x that the probability of a price being greater or equal to x will be equal to a probability selected by the user. Probability is the area under the distribution curve. The task is to find such value of x that the area under the distribution curve to the right of x will be equal to the probability selected by the user. That x is the dynamic zone.
Included
Loxx's Expanded Source Types
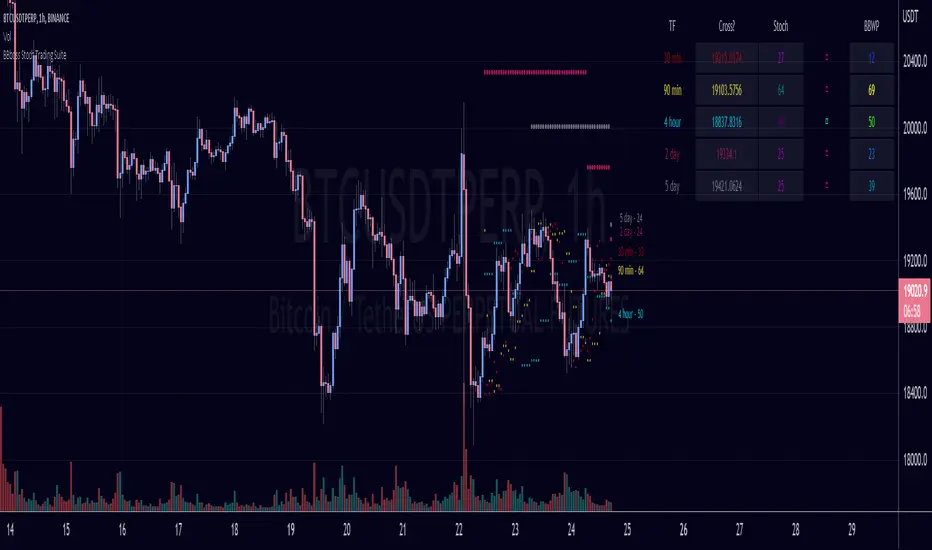
BBboss Stoch Trading SuiteIntroducing the BBboss Stoch Trading Suite
***Note***
This indicator's parameters and settings are specifically used for bitcoin technical analysis.
Best used on the lowest time frame chart. (15m - 1h)
Definitions:
Volatility is a statistical measure of the dispersion of returns for a given security or market index, measured by the standard deviation of logarithmic returns.
Stochastic Oscillator is a momentum indicator comparing a particular closing price of a security to a range of its prices over a certain period of time. The sensitivity of the oscillator to market movements is reducible by adjusting that time period or by taking a moving average of the result. It is used to generate overbought and oversold trading signals, utilizing a 0–100 bounded range of values.
Plotted Components of the Trading Suite:
A) A Table with input selected time frames that show the stochastic and volatility value for each asset.
The first column shows the price needed for the stochastic momentum indicator to reverse or change slope.
The second column plots the stochastic value of the input selected timeframes.
The third column plots the direction of the stochastic oscillator
The fourth column plots the volatility of the selected time frames. 0 being low volatility and 100 being highest volatility with a default lookback period of 255.
B) Ray Lines on price chart to reflecting the price needed for the stochastic momentum indicator to reverse or change slope.
C) Historical Lines on the price chart to see more lines on historical bars
Deeper Concepts :
In finance, “mean reversion” is the assumption that a financial instrument's price will tend to move towards the average price over time.
If we apply that same logic to volatility as represented here by the Bollinger band width percentile, the assumption is that the Bollinger band width percentile will tend to contract from extreme highs, and expand from extreme lows over time corresponding to repeated phases of contraction and expansion of volatility .
It is clear that for most assets there are periods of directional trending behavior followed by periods of “consolidation” ( trading sideways in a range ).
This often ends with a tightening range under reducing volume and volatility ( popularly known as “the squeeze” ).
The squeeze typically ends with a “breakout” from the range characterized by a rapid increase in volume , and volatility when price action again trends directionally, and the cycle repeats.
Note: I have turned off Historical Lines by default because I made this indicator specifically for scalping lower timeframes.
With this indicator, you can visualize the momentum on every timeframe on the table and chart to get a real time view on where to manage your positions.
MACD Potential Divergence - FontiramisuIndicator showing potential momentum divergences on MACD Momentum.
The problem with the classic divergence is that when the signal appears, it is sometimes too late to enter a trade .
The potential divergence corrects this problem by signaling the beginning of a potential divergence .
MACD is a momentum indicator that offers relevant insights with divergences.
Potential divergences are indicated with the letter B and a red color for Bearish Div or Green color for Bullish Div .
Potential divergence is confirmed when the line and the label "Bear"' or "Bull" appear.
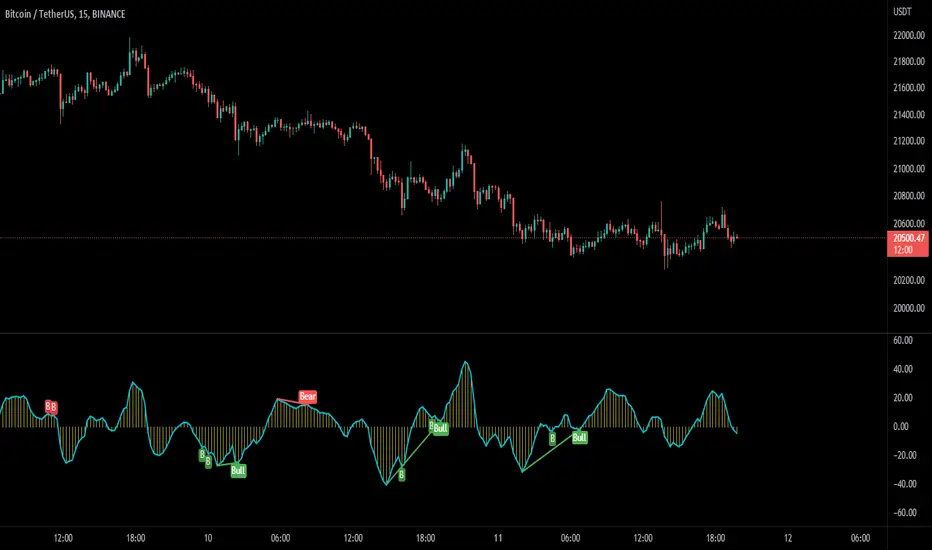
MA SLope Potential Divergence - FontiramisuIndicator showing potential momentum divergences on Moving Average's Slope.
The problem with the classic divergence is that when the signal appears, it is sometimes too late to enter a trade .
The potential divergence corrects this problem by signaling the beginning of a potential divergence .
Moving average slope is a momentum indicator that offers relevant insights with divergences
Potential divergences are indicated with the letter B and a red color for Bearish Div or Green color for Bullish Div .
Potential divergence is confirmed when the line and the label "Bear"' or "Bull" appear.
You can either show fast slope's divergences or slow slope's divergences or slow/fast diff's divergences.

TTM Regression°This oscillator attempts to provide context to John Carter's "TTM Squeeze" indicator.
Similar to my MAR° indicator, statistically significant areas based on the past n candles (Lookback) are calculated to provide context for the y-axis values of the TTM indicator.
Note that Carter's squeeze idea has been dropped in favour of the regression bands, in that they offer a clear visual momentum squeeze condition.
The regression bands identify temporary exhaustion of bullish (purple) and bearish (green) momentum; these could potentially be seen as overbought and oversold indications.
The dotted midlines dictate intra-zones where momentum could reverse to continue the larger trend.
All the latter behave similarly to Support and Resistance zones.
The oscillator can also be normalized over a given interval to show results on a scale between 0 and 100, preserving even more context over time.
You should experiment for yourself to find out what is best for you in terms of scale, and Normalization Period.
Normalization Example: on the left you can observe how the momentum is visualized differently based on the scale, given the rapid momentum to the upside.
// –––. Regular
// –––. Normalized
It's crucial to use this oscillator as confluence only and not to take trades based solely on its indications.
At the moment there are no alerts set for this script, open to suggestions :)

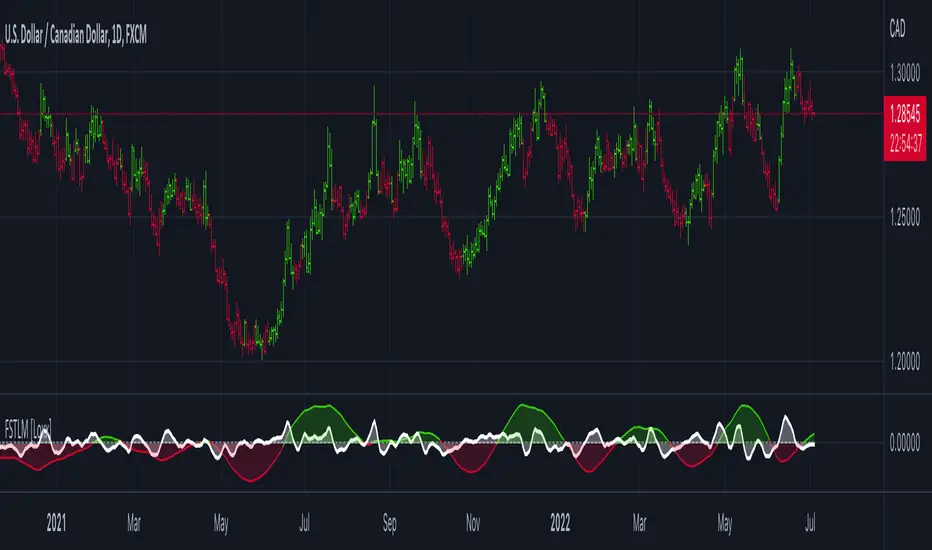
Fast and Slow Trend-Line Momentum [Loxx]Fast and Slow Trend-Line Momentum is a momentum indicator using FATL, SATL, RFTL, & RSTL Digital Filters
What is FTLM-STLM?
Fast Trend Line Momentum (FTLM) and Slow Trend Line Momentum (SLTM) indicators show the rate of price change, FATL and SATL are calculated the similar way as Momentum indicator.
FTLM(bar) = FATL(bar) – RFTL(bar)
STLM(bar) = SATL(bar) – RSTL(bar)
The main difference FTLM from the classic Momentum indicator is the following: it source prices processed by digital filters instead of close prices itself. As a result, FTLM looks smoothed and regular, in contrast with classic Momentum technical indicators.
Included:
-Bar coloring
RAS.V2 Strength Index OscillatorHeavily modified version of my previous "Relative Aggregate Strength Oscillator" -Added high/low lines, alma curves,, lrc bands, changed candle calculations + other small things. Replaces the standard RSI indicator with something a bit more insightful.
Credits to @wolneyyy - 'Mean Deviation Detector - Throw Out All Other Indicators ' And @algomojo - 'Responsive Coppock Curve'
And the default Relative Strength Index
The candles are the average of the MFI ,CCI ,MOM and RSI candles, they seemed similar enough in style to me so I created candles out of each and the took the sum of all the candle's OHLC values and divided by 4 to get an average, same as v1 but with some tweaks. Previous Peaks and Potholes visible with the blue horizontal lines which adjust when a new boundary is established. Toggle alma waves or smalrc curves or both to your liking. This indicator is great for calling out peaks and troughs in realtime, although is best when combined with other trusted indicators to get a consensus.

Multi-timeframe MomentumThe Multi-timeframe momentum indicator is similar in concept to a velocity indicator like rate-of-change, but visualizes smoothed price changes by applying an EMA and linear regression to price difference at every bar. Momentums from 1 minute to 1 quarter are plotted on a single chart using the request.security function. Standard and Fibonacci timeframes are available as well as the ability to hide high-timeframes to keep the chart clean. Like any oscillator, divergence in the momentums can be used to identify price reversals in conjunction with support and resistance. When linear regression is applied, high and low inflection points are used to identify reversals in a manner similar to MACD.
Much love to DumpCap! The script is presented sans secret sauce.

STD Aadaptive, floating RSX Dynamic Momentum Index [Loxx]STD Aadaptive, floating RSX Dynamic Momentum Index is an attempt to improve Chande's original work on Dynamic Momentum Index. The full name of this indicator is "Standard-Deviation-Adaptive, floating-level, Dynamic Momentum Index on Jurik's RSX".
What Is Dynamic Momentum Index?
The dynamic momentum index is used in technical analysis to determine if a security is overbought or oversold. This indicator, developed by Tushar Chande and Stanley Kroll, is very similar to the relative strength index (RSI). The main difference between the two is that the RSI uses a fixed number of time periods (usually 14), while the dynamic momentum index uses different time periods as volatility changes, typically between five and 30.
What is RSX?
RSI is a very popular technical indicator, because it takes into consideration market speed, direction and trend uniformity. However, the its widely criticized drawback is its noisy (jittery) appearance. The Jurk RSX retains all the useful features of RSI, but with one important exception: the noise is gone with no added lag.
Differences
RSX is used instead of RSI for the calculation, producing a much smoother result
Standard deviation is used to adapt the RSX calculation
Floating levels are used instead of fixed levels for OB/OS
Included
-Change bar colors

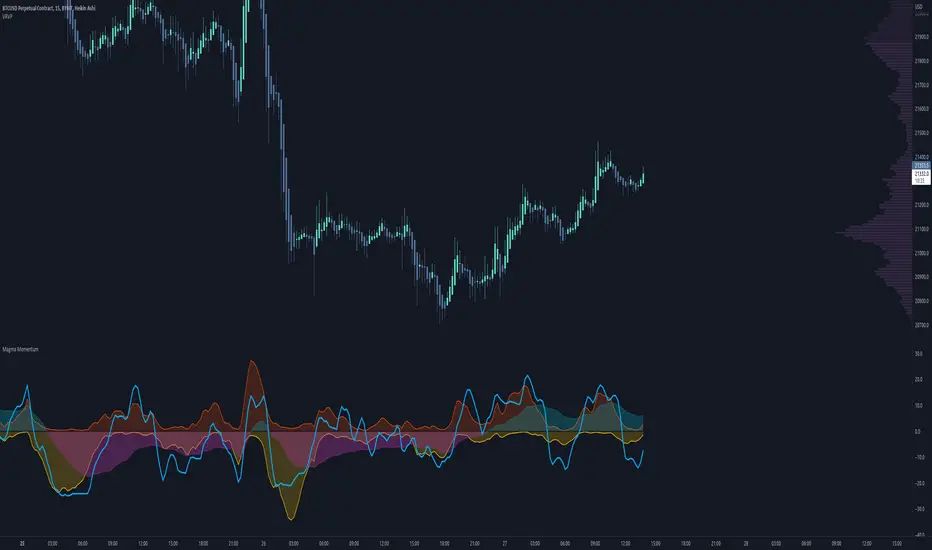
Magma MomentumThis is a simple and easy-to-read momentum indicator that can help you identify divergences and shifts in momentum.
A divergence is when price moves in one direction but the indicator moves in the opposite direction. This typically is a sign of price exhaustion and can indicate that price is about to reverse, at least momentarily.
Here is a comparison with RSI (relative strength index) and some examples of divergences.
Enjoy.
Whale Momentum Wave Oscillator//Credits: @Noldo - Whale Trading System @rumpypumpydumpy - ALMA Ribbons @QuantNomad - Elastic Volume Weighted Moving Average
Composite Indicator, created by taking QuantNomad's EVWMA and using that as input for a variation of rumpypumpydumpy's ALMA Ribbons. Each Ribbon had its sub ribbons summed up and then averaged. The averages were then fed through the ta.rsi and the ta.mom functions giving us our momentum waves. Signal line created from the close value being fed through the ta. ema into the ta.rsi then ta.wma then ta.mom function. Why those in that order? No reason in particular just what I stumbled upon after many variations. I then overlayed Noldo's Whale Trading System to view what "whales" were doing, giving us a good view of when capital is flowing into and out the asset which often contradicts the momentum waves prior to trend changes. Provides a nice visual for how capital is moving along with momentum. Can see when smart money is buying up a big dip or of they seem to still be waiting on the sidelines.
