10>20,p>50 DEMARenders daily EMA, 10, 20 and 50 on any timeframe below 1D
30m timeframe works well.
Use trend of 10 > 20 + price > 50 for long and 10 < 20 + price < 50 for shorts or exits.
Moyennes mobiles

HSI Long & Short: BG + EMA330Strategy: HSI 5-min mean-reversion with EMA10/20 crossover and EMA330 filter.
Background green (EMA10 > EMA20) or red (EMA10 < EMA20).
Long entry: Background turns green AND price below EMA330.
Short entry: Background turns red AND price above EMA330.
Exit long: Background turns red.
Exit short: Background turns green.
No new entries 15:01–16:00 HKT.
Reverses position on signals; 100% equity per trade.

Hosoda ZHosoda’s Clouds is a trend-following strategy designed to trade only long positions in traditionally trending markets with a strong bullish bias: SPY(D); DJI (D); NDX (D); XAUUSD (D); Tesla (D, H4, H1); AAPL (D, H4, H1); GOOG (D, H4); META (D, H4); NVDA (D, H4); AMZN(D, H4).
Strategy Parameters
Initial Capital: $10,000 USD.
Position Size: Risks 10% of your equity per trade.
Commission: 0.1%
Indicators
The strategy combines two main technical tools:
A. Ichimoku Cloud This is the core of the strategy. It calculates the classic lines:
• Tenkan-sen (Fast Line): Average of the highest high and lowest low of the last 9 periods.
• Kijun-sen (Base Line): Average of the last 26 periods.
• Cloud (Senkou Span A and B): Projects future support/resistance.
B. EMA 500 (Trend Filter)
• A 500-period Exponential Moving Average is calculated.
• Function: Serves as a very long-term trend filter. If the price is above the EMA 500, the market is considered bullish in the long term.
Entry Rules
• Bullish Cross (Bull Cross): The fast line (Tenkan) crosses above the base line (Kijun). This is the classic Ichimoku entry signal.
• Trend Filter (Optional):
•If you check the "Enable EMA Filter" box in the options, the system will only buy if the closing price is above the EMA 500.
•If the box is unchecked, it will ignore the EMA and buy based solely on the Ichimoku cross.
Exit Rules
A. Stop Loss (Loss Protection) It is a dynamic Stop Loss based on market structure, not a fixed percentage.
• At the moment of entry, the code looks back 12 bars (configurable in sl_bars_back) and finds the lowest price (low).
• It places the Stop Loss at that minimum level.
• Visual: Draws a dotted red line on the chart showing where your Stop Loss is.
B. Technical Take Profit (Exit due to Weakness) Lets profits run until the trend shows weakness.
• Condition: Closes the trade if the Tenkan line crosses below the bottom of the Cloud .
• This means short-term momentum has been lost and the price has entered or crossed below the cloud.
Statistics Panel
In the top right corner, the code draws a table (Panel) that updates in real-time or at the end of Backtesting. It shows:
• Total P&L: Net profit or loss in dollars.
• Win Rate: Percentage of winning trades.
• Trades: Total number of trades executed.
Summary
1. The script waits for the blue line (Tenkan) to cross over the red line (Kijun).
2. It verifies if the price is above the orange line (EMA 500) (if the filter is active).
3. If so, it BUYS.
4. It immediately places a Stop Loss at the low of the last 12 candles (red dotted line).
5. It keeps the trade open until the Stop Loss is hit or until the Tenkan line drops below the Cloud.
Customizable Settings
• Whether to use the EMA filter or not.
• The EMA length (default is 500).
• The Ichimoku periods (9, 26, 52 are standard).
• How many bars to look back to set the Stop Loss.

Scalping Acciones PRO (Entradas + TP + SL) leo
How to use it correctly
• Timeframe: 1m or 5m
• High-volume stocks (SPY, AAPL, TSLA, NVDA…)
• Take Profit (TP): VWAP or EMA 21
• Stop Loss (SL): low/high of the signal candle
⸻
If you want, in the next message I can:
• 🔧 add automatic Stop Loss and Take Profit
• 🚀 convert it into a strategy (Strategy Tester)
• 🎯 filter only strong reversals (fewer false signals)

Trend Pulse Channel StrategyTrend Pulse Channel Strategy
Overview
The Trend Pulse Channel Strategy is a long-only trend-following strategy designed to capture sustained bullish moves by combining trend strength confirmation with price channel structure.
It focuses on participating in strong directional markets while filtering out low-quality signals during ranging conditions.
⸻
Strategy Logic
The strategy is built on three core components:
1. Trend Strength Filter
• Uses the Average Directional Index (ADX) to confirm that the market is trending.
• Trades are allowed only when trend strength exceeds a predefined threshold.
• This helps avoid choppy, sideways markets.
2. Channel-Based Price Structure
• Price action is evaluated within a smoothed channel framework.
• Entries occur when price aligns with bullish channel direction and momentum.
• Channels help define structure, continuation, and exhaustion zones.
3. Long-Only Bias
• The strategy takes long positions only.
• Designed for assets with a natural bullish tendency over time (stocks, indices, major crypto).
⸻
Entry Conditions (Long)
A long trade is triggered when:
• ADX confirms sufficient trend strength.
• Price holds bullish structure within the channel.
• Momentum aligns with the dominant trend direction.
⸻
Exit Conditions
Positions are closed when:
• Trend strength weakens.
• Price loses channel support.
• Momentum shows signs of exhaustion or reversal.
⸻
Risk & Execution Notes
• Percentage-based position sizing.
• Commission and slippage included for realistic backtesting.
• Optimized to reduce over-trading.
⸻
Recommended Usage
Markets:
• Stocks
• Indices
• Cryptocurrencies
Timeframes:
• 15-minute and higher
• Performs best on 1H, 4H, and Daily
⸻
Intended Audience
• Trend followers
• Swing traders
• Position traders
Not suitable for:
• Range-bound scalping
• Counter-trend strategies
⸻
Disclaimer
This strategy is provided for educational and research purposes only.
Always forward-test and apply proper risk management before live trading.


Relative Outperformance + EMA Trend Filter (Long Only)Relative Outperformance based on underlying and EMA based trend filtering

225 SMA CrossoverWell-known strategy from Zahlengraf from the Mauerstrassenwetten subreddit for you to test yourself.
You can change the length of the SMA and whether to trade long, short or both directions.

Buy the dips StrategyThis strategy getting in long position only after the price drop- Buy the dips
The % of the drop is Determined by SMA for the first trade
The inputs of SMA and % of the drop can be adjust from the User
After that Strategy start taking safe trades if not take profit from the first trade
The safe trades are Determined by step down deviation % and by quantity
There is no Stop loss is not for one with small tolerance to getting under
if any question ask

Trend Core Strategy v1.0 - GUMROADLog Regression Channel Pro Strategy
This is a trend-following pullback strategy built for TradingView (Pine Script v6).
It uses logarithmic regression channels to define the market’s primary trend, and looks for low-risk pullback entries within strong trending conditions.
Momentum and trend strength filters are applied to avoid ranging or weak markets.
This strategy is designed to be used when the market is clearly trending, not during choppy or sideways price action.
Best Used When
Strong uptrend or downtrend is present
Price is pulling back toward the regression channel
Volatility is sufficient (ADX confirms trend strength)
Suitable for 1H / 4H timeframes
Commonly used on BTC, ETH, and major crypto pairs
Key Characteristics
Non-repainting logic
Volatility-based risk management (ATR)
Designed for realistic backtesting
No martingale, no grid, no over-optimization
Gumroad Disclaimer (3 Lines)
This strategy is provided for educational purposes only and is not financial advice.
Trading involves risk, and losses may occur.
You are fully responsible for your own trading decisions.

Ace Algo [Anson5129]🏆 Exclusive Indicator: Ace Algo
📈 Works for stocks, forex, crypto, indices
📈 Easy to use, real-time alerts, no repaint
📈 No grid, no martingale, no hedging
📈 One position at a time
----------------------------------------------------------------------------------------
Ace Algo
A trend-following TradingView strategy using a confluence of technical indicators and time-based rules for structured long/short entries and exits:
----------------------------------------------------------------------------------------
Parameters Explanation
Moving Average Length
Indicates the number of historical data points used for the average price calculation.
Shorter = volatile (short-term trends); longer = smoother (long-term trends, less noise).
Default: 20
Entry delay in bars
After a trade is closed, delay the next entry in bars. The lower the number, the more trades you will get.
Default: 4
Take Profit delay in bars
After a trade is opened, delay the take profit in bars. The lower the number, the more trades you will get.
Default: 3
Enable ADX Filter
No order will be placed when ADX < 20
Default: Uncheck
Block Period
Set a block period during which no trading will take place.
----------------------------------------------------------------------------------------
Entry Condition:
Only Long when the price is above the moving average (Orange line).
Only Short when the price is below the moving average (Orange line).
* Also, with some hidden parameter that I set in the backend.
Exit Condition:
When getting profit:
Trailing Stop Activates after a position has been open for a set number of bars (to avoid premature exits).
When losing money:
In a long position, when the price falls below the moving average, and the conditions for a short position are met, the long position will be closed, and the short position will be opened.
In a short position, when the price rises above the moving average, and the conditions for a long position are met, the short position will be closed, and the long position will be opened.
----------------------------------------------------------------------------------------
How to get access to the strategy
Read the author's instructions on the right to learn how to get access to the strategy.

Estrategia Momentum Seguro (EMS) Entry and exit signals, this indicator helps or suggests where to enter, exit, or place a stop loss.

Kairos Bands [v1.1]Overview
The Kairos Bands Strategy is a highly modular trading system designed to identify high probability entry points based on volatility exhaustion and momentum shifts... It is built with a proprietary core algorithm that detects when price has extended too far from its mean, but it is wrapped in a Confluence Cloud that allows the user to filter these signals through nine different secondary indicators...
This is not just a static strategy... It is a framework that allows you to build your own edge by toggling specific filters on and off to match current market conditions...
1... The Chameleon Feature (Trend or Reversal)
One of the most powerful features of Kairos Bands is the Inverse Trades logic...
Reversal Mode (Default): By default, the strategy looks for price exhaustion... It buys when the market is oversold and sells when the market is overbought... This is ideal for ranging markets or catching tops and bottoms...
Trend Following Mode (Inversed): By checking the Inverse Trades box in the settings, the logic flips completely... A Buy signal becomes a Sell and vice versa... This transforms the strategy into a breakout or trend following system, entering trades in the direction of the momentum rather than against it...
2... The Confluence Cloud
While the core trigger is based on proprietary volatility calculations, the user has full control over how strictly those trades are filtered... You can toggle any of the following 9 momentum filters independently for both Long and Short setups...
RSI (Relative Strength Index)
Stochastic Oscillator
CCI (Commodity Channel Index)
Williams %R
MFI (Money Flow Index)
CMO (Chande Momentum Oscillator)
Fisher Transform
Ultimate Oscillator
ROC (Rate of Change)
For example, you can require RSI and MFI to agree with the main signal for Longs, but only require Stochastic for Shorts... This allows for granular tuning...
3... Trend Bias & Time Management
To further refine entries, the strategy includes:
EMA Trend Filter: An optional dual EMA system (Fast vs Slow) that forces the strategy to only trade in the direction of the dominant trend...
Precision Time Filtering: You can define exact start and end times (down to the minute) for entries...
No Trade Zone (NTZ): A specific time window where the strategy is forbidden from holding positions... If a trade is open when the NTZ begins, it is immediately force closed to avoid volatility events or market closes...
4... Risk Management
The strategy moves away from vague percentage based stops and uses precision point based targeting...
Fixed Points: Set your Take Profit and Stop Loss in exact price points...
Signal Skipping: An optional feature to cool down the strategy after a trade closes, forcing it to skip a set number of subsequent signals to avoid over trading...
5... Professional Analytics Dashboard
The visual overlay provides a detailed Heads Up Display (HUD) containing institutional grade metrics...
Strategy Grade: An automatic A through F grading system based on the Win Rate Differential (how much better the strategy performs compared to a breakeven coin flip)...
Streak Analysis: Tracks the maximum and average consecutive wins and losses to help you understand the psychological drawdown risk...
Rolling PnL: A secondary dashboard tracks your hypothetical Net PnL over the last 7 trading days and the last 12 months, giving you a clear view of short term and long term performance...

Hybrid Trend-Following Inside Bar BreakoutHybrid Trend-Following Inside Bar Breakout Strategy
The Hybrid Trend-Following Inside Bar Breakout Strategy is a rule-based trading system designed to capture strong directional moves while controlling risk during uncertain market conditions. It combines trend-following, price action, and volatility-based risk management into a single robust framework.
Core Concept
The strategy trades inside bar breakouts only in the direction of the dominant market trend. Inside bars represent periods of consolidation, and when price breaks out of this consolidation in a trending market, it often leads to impulsive moves with favorable risk–reward characteristics.
Key Components
1. Trend Filter
Uses 50 EMA and 200 EMA to define the market trend.
Bullish bias: 50 EMA above 200 EMA
Bearish bias: 50 EMA below 200 EMA
This filter prevents counter-trend trades and improves trade quality.
2. Volatility Filter
Compares fast ATR (14) with slow ATR (50).
Trades are taken only when volatility is expanding or above a minimum threshold.
This avoids low-volatility, choppy market conditions.
3. Inside Bar Breakout
An inside bar forms when the current candle’s high is lower than the previous candle’s high and the low is higher than the previous candle’s low.
A trade is triggered only when price breaks above or below the inside bar range in the direction of the trend.
4. Candle Quality Filter
Requires a minimum body-to-range ratio, ensuring that the breakout candle has strong momentum and is not driven by weak wicks.
Risk Management & Trade Management
Stop Loss (SL)
Placed using ATR-based dynamic stops, adapting to current market volatility.
Prevents tight stops in volatile conditions and wide stops in calm markets.
Partial Profit Taking
50% of the position is exited at 1.5R, locking in profits early.
This reduces psychological pressure and improves equity stability.
Trailing Stop
After partial profit is taken, the remaining position is managed with an ATR-based trailing stop.
Allows the strategy to capture large trend moves while protecting gains.
Cooldown Mechanism
After a losing trade, the system enters a cooldown period and skips a fixed number of bars.
This helps avoid revenge trading and overtrading during unfavorable market phases.
Why This Strategy Works
Trades only high-probability breakouts in trending markets
Adapts automatically to changing volatility
Combines price action precision with systematic risk control
Designed for consistent performance over long historical periods

EMA 5/9 Angle + Candle Strength (SL=Open, TP=RR)EMA 5 / EMA 9 cross
Cross must have ~30° angle (approximated using slope → atan)
Entry candle must be bullish/bearish and also be Normal / 2nd Most / Most based on body-size percentile
Entry = close of signal candle
SL = open of signal candle
TP = 1:2 RR (editable input)

[Backtest Crypto] Cross MAThis script is designed for testing the moving average crossover strategy.
Script settings:
Select testing range
Indicator settings: Select moving average type (EMA, SMA, WMA, SMMA, HMA) and period
Trade management: Select risk-to-reward ratio, stop-loss defined as min/max for a certain number of candles (you can set a desired number), option to partially lock in a position by moving the stop-loss to breakeven, trailing stop, or close a position on an opposite signal.
Option to limit the stop-loss by ATR to prevent it from becoming too large during volatile movements.
===============================================================
Скрипт предназначен для тестирования стратегии пересечение скользящих средних.
Настройки скрипта:
Выбор диапазона тестирования
Настройки индикатора: выбор типа скользящей (EMA, SMA, WMA, SMMA, HMA) и периода
Сопровождение сделки: выбор соотношения риска к прибыли, стоп-лосс определяется как мин/мах за определенное количество свечей (можно устанавливать желаемое количество), возможность частичной фиксации позиции с переносом стоп-лосса в безубыток, трейлинг-стоп, или закрытие позиции по противоположному сигналу.
Возможность ограничения стоп-лосса по ATR, чтобы при волатильных движениях он не был слишком большим.

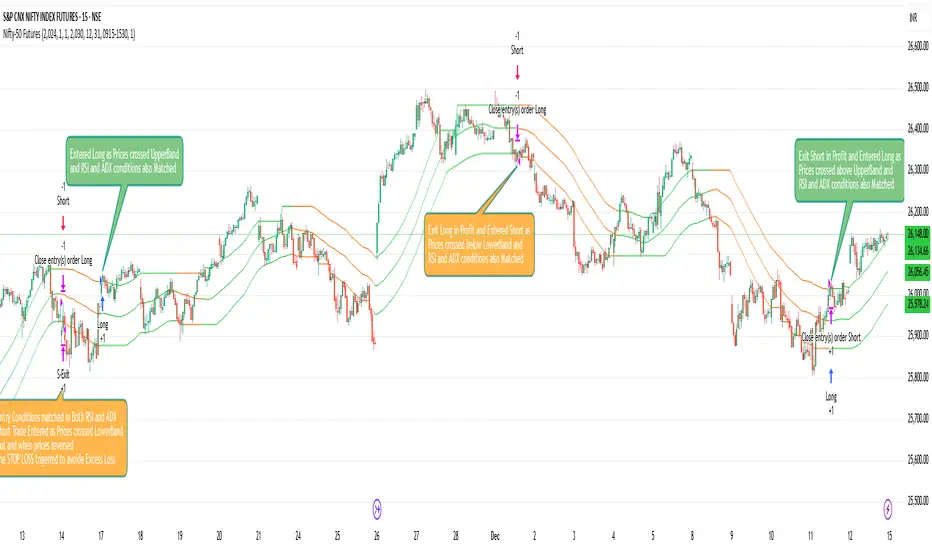
Nifty-50 Futures Trading Ideas/ Strategyb]Nifty-50 Futures Trading Ideas is a trend-following strategy designed for study and backtesting .
The strategy identifies directional bias using a structured price-based approach and applies ADX + DI and RSI filters to validate trend strength.
It includes inbuilt risk-management logic such as Stop-Loss, Take-Profit, ATR-based exits, separate maximum loss per trade (₹) for long and short positions, and optional date/session filters.
This script is provided for educational and analytical purposes only and is not a trading signal or investment recommendation.
Velocity SwingtraderThe intended objective of this indicator to gauge trend and momentum and find trades that are at the beginning of a trend change for longer periods of time (days, weeks, months).

Scalping EMA + Pinbar Strategy (London & NY only, BE @ 1R)The scalping trading system uses two types of indicators:
EMA 10, EMA 21, EMA 50
Pinbar Indicator
Rules for entering a buy order:
If the closing price is above the EMA 50, the trend is uptrend and only buy orders should be considered.
The EMA 10 and EMA 21 lines must simultaneously be above the EMA 50.
The price must correct down at least 50% of the area created by the EMA 10 and EMA 21, or correct further down.
A Type 1 Pinbar candle (marked by the Pinbar indicator) must appear; this Pinbar candle must react to at least one of the three EMA lines (EMA 10, EMA 21, EMA 50) and close above the EMA 50.
This Pinbar candle must have a Pinbar strength value (marked by the Pinbar indicator) less than 2 to be considered valid. Check if the closing price of this pinbar candle is higher than the 50-day EMA and if the 10-day and 21-day EMAs are also higher than the 50-day EMA. If so, the conditions have been met and you can begin trading.
Place a buy stop order 0.1 pip higher than the highest price of the pinbar candle, and a stop loss order 0.1 pip lower than the lowest price of the pinbar candle. Set the take profit at 3R.
If the price moves past the previously set stop loss, cancel the pending order.
When the price moves 1R, move the stop loss back to the entry point.
The next trade can only be executed after the previous trade has moved the stop loss back to the entry point.
Rules for placing sell orders:
If the closing price is below the 50-day EMA, the trend is bearish, and only sell orders should be considered. The 10-day and 21-day EMAs must both be below the 50-day EMA.
The price must correct downwards by at least 50% of the area formed by the 10-day and 21-day EMAs, or even further.
A Type 1 pinbar candle (marked by the Pinbar indicator) must appear. This pinbar candle must react to at least one of the three EMAs (EMA 10, EMA 21, EMA 50) and close below the EMA 50.
This pinbar is valid if its strength (indicated by the Pinbar indicator) is less than 2. Verify that the closing price of this pinbar candle is below the EMA 50 and that both the EMA 10 and EMA 21 are below the EMA 50. If all conditions are met, the trade can be executed.
(This appears to be a separate entry rule and not part of the previous text.) Place a sell stop order 0.1 pip below the lowest point of the pinbar candle, and a stop loss order 0.1 pip above the highest point of the pinbar candle. Set the take profit point at 3R.
If the price moves past the previously set stop-loss point, cancel the pending order.
When the price moves 1R, move the stop-loss point back to the entry point.
The next trade can only be executed after the previous trade has moved the stop-loss point back to the entry point.

AlphaGen ME V.15.12AlphaGen ME V.15.10 is an ATR-based trend-following strategy with dynamic trailing stops and EMA filter, designed for automated Crypto perpetual trading.
Core Logic:
• ATR Trailing Stops: Dynamically adjusts stop-loss using ATR(10) × 3.0 multiplier
• 200 EMA Trend Filter: Optional Only takes longs above EMA, shorts below EMA
• Reversal System: Flips positions when trend changes (filter-aware)
• MACD Acceleration Exit: Optional momentum-based profit taking
Position Sizing Modes:
• Simple % of Equity (default 90%) - Safe leverage control
• Risk % of Equity - Fixed risk per trade
• Fixed Contract Size - Consistent lot sizing
Webhook Integration:
Routes signals directly to AlphaGen-AI for execution on:
• Hyperliquid DEX
• AsterDEX
Requirements:
• AlphaGen-AI Pro subscription for webhook routing
• Hyperliquid or AsterDEX Wallets
• TradingView alerts configured with passphrase
Risk Disclosure: Trading involves substantial risk. Past performance does not guarantee future results. Only trade with capital you can afford to lose.

Sinals 15m - RSI 7 e 9This strategy is designed to capture continuation moves on the 15-minute chart by combining trend filters, momentum indicators, and strong-candle confirmation. The core idea is to enter trades shortly after EMA crossovers that signal direction, as long as momentum and candle strength support the move.

[SM-021] Gaussian Trend System [Optimized]This script is a comprehensive trend-following strategy centered around a Gaussian Channel. It is designed to capture significant market movements while filtering out noise during consolidation phases. This version (v2) introduces code optimizations using Pine Script v6 Arrays and a new Intraday Time Control feature.
1. Core Methodology & Math
The foundation of this strategy is the Gaussian Filter, originally conceptualized by @DonovanWall.
Gaussian Poles: Unlike standard moving averages (SMA/EMA), this filter uses "poles" (referencing signal processing logic) to reduce lag while maintaining smoothness.
Array Optimization: In this specific iteration, the f_pole function has been refactored to utilize Pine Script Arrays. This improves calculation efficiency and rendering speed compared to recursive variable calls, especially when calculating deep historical data.
Channel Logic: The strategy calculates a "Filtered True Range" to create High and Low bands around the main Gaussian line.
Long Entry: Price closes above the High Band.
Short Entry: Price closes below the Low Band.
2. Signal Filtering (Confluence)
To reduce false signals common in trend-following systems, the strategy employs a "confluence" approach using three additional layers:
Baseline Filter: A 200-period (customizable) EMA or SMA acts as a regime filter. Longs are only taken above the baseline; Shorts only below.
ADX Filter (Volatility): The Average Directional Index (ADX) is used to measure trend strength. If the ADX is below a user-defined threshold (default: 20), the market is considered "choppy," and new entries are blocked.
Momentum Check: A Stochastic RSI check ensures that momentum aligns with the breakout direction.
3. NEW: Intraday Session Filter
Per user requests, a time-based filter has been added to restrict trading activity to specific market sessions (e.g., the New York Open).
How it works: Users can toggle a checkbox to enable/disable the filter.
Configuration: You can define a specific time range (Default: 09:30 - 16:00) and a specific Timezone (Default: New York).
Logic: The strategy longCondition and shortCondition now check if the current bar's timestamp falls within this window. If outside the window, no new entries are generated, though existing trades are managed normally.
4. Risk Management
The strategy relies on volatility-based exits rather than fixed percentage stops:
ATR Stop Loss: A multiple of the Average True Range (ATR) is calculated at the moment of entry to set a dynamic Stop Loss.
ATR Take Profit: An optional Reward-to-Risk (RR) ratio can be set to place a Take Profit target relative to the Stop Loss distance.
Band Exit: If the trend reverses and price crosses the opposite band, the trade is closed immediately to prevent large drawdowns.
Credits & Attribution
Original Gaussian Logic: Developed by @DonovanWalll. This script utilizes his mathematical formula for the pole filters.
Strategy Wrapper & Array Refactor: Developed by @sebamarghella.
Community Request: The Intraday Session Filter was added to assist traders focusing on specific liquidity windows.
Disclaimer: This strategy is for educational purposes. Past performance is not indicative of future results. Please use the settings menu to adjust the Session Time and Risk parameters to fit your specific asset class.

EMA + ATR Semi-Auto strategy -Kohei Matsumura-EMAとATRを自動調節するストラテジー
This is an EMA- and ATR-based trading strategy that adapts its parameters according to recent market behavior and performance characteristics.
The strategy dynamically adjusts trend sensitivity and risk management settings to maintain robustness across varying market conditions, while operating strictly on confirmed price data.
