Portfolio Simulator & BacktesterMulti-asset portfolio simulator with different metrics and ratios, DCA modeling, and rebalancing strategies.
Core Features
Portfolio Construction
Up to 5 assets with customizable weights (must total 100%)
Support for any tradable symbol: stocks, ETFs, crypto, indices, commodities
Real-time validation of allocations
Dollar Cost Averaging
Monthly or Quarterly contributions
Applies to both portfolio and benchmark for fair comparison
Model real-world investing behavior
Rebalancing
Four strategies: None, Monthly, Quarterly, Yearly
Automatic rebalancing to target weights
Transaction cost modeling (customizable fee %)
Key Metrics Table
CAGR: Annualized compound return (S&P 500 avg: ~10%)
Alpha: Excess return vs. benchmark (positive = outperformance)
Sharpe Ratio: Return per unit of risk (>1.0 is good, >2.0 excellent)
Sortino Ratio: Like Sharpe but only penalizes downside (better metric)
Calmar Ratio: CAGR / Max Drawdown (>1.0 good, >2.0 excellent)
Max Drawdown: Largest peak-to-trough decline
Win Rate: % of positive days (doesn't indicate profitability)
Visualization
Dual-chart comparison - Portfolio vs. Benchmark
Dollar or percentage view toggle
Customizable colors and line width
Two tables: Statistics + Asset Allocation
Adjustable table position and text size
🚀 Quick Start Guide
Enter 1-5 ticker symbols (e.g., SPY, QQQ, TLT, GLD, BTCUSD)
Make sure percentage weights total 100%
Choose date range (ensure chart shows full period - zoom out!)
Configure DCA and rebalancing (optional)
Select benchmark (default: SPX)
Analyze results in statistics table
💡 Pro Tips
Chart data matters: Load SPY or your longest-history asset as main chart
If you select an asset that was not available for the selected period, the chart will not show up! E.g. BTCUSD data: Only available from ~2017 onwards.
Transaction fees: 0.1% default (adjust to match your broker)
⚠️ Important Notes
Requires visible chart data (zoom out to show full date range)
Limited by each asset's historical data availability
Transaction fees and costs are modeled, but taxes/slippage are not
Past performance ≠ future results
Use for research and education only, not financial advice
Let me know if you have any suggestions to improve this simulator.
Multiasset

Multi-Asset Cross Timeframe Divergence Ind. (MACDI) // AlgoFyreThe Multi-Asset Cross Timeframe Divergence Indicator (MACDI) identifies divergences in momentum like RSI across multiple assets and timeframes. It visually highlights lagging correlated asset momentum divergences, helping traders spot inefficiencies and potential trade opportunities in the following asset.
🔶 KEY FEATURES
🔸Average Momentum Trendline for Each Timeframe
The Average Momentum Trendline feature calculates the average momentum of multiple assets over specified timeframes. It uses smoothed values to determine the momentum trend for each timeframe on the average aggregated momentum of both assets. This trendline helps traders identify the overall direction of the market momentum, providing a clearer picture of potential price movements.
🔸Real-time Divergence Indication and Alert Table
The Real-time Divergence Indications and Alert Table feature visualizes detected divergences between the momentum values of the two assets across different timeframes. It identifies both bullish and bearish divergences, signaling lagging reversals in the the following asset and potential trading opportunities. When a divergence is detected, the system generates real-time visual indications on the chart and in an overview table for traders to act promptly. The alert table provides a comprehensive overview of all detected divergences, making it easier for traders to monitor and respond to market changes.
🔸Color and Size Based Labels on Price Chart based on Divergence Type
The Color and Size Based Labels feature visually represents divergences directly on the price chart. Bullish and bearish divergences are marked with distinct colors and sizes, making them easily identifiable at a glance. Larger labels indicate higher timeframes and thus generally more significance.
🔶 INSTRUCTION GUIDELINES
🔸Identify Divergence Clusters
The more divergences align, the higher the probability of a potential trend reversal in the asset. When multiple multi-timeframe divergences occur in both lower and higher timeframes within a local cluster, the probability of a reversal increases. This is valid for both for bullish and bearish divergences.
🔸Spot Low Probability Divergences
To further increase the probability, analyze the current state of the average momentum trendline. For a bullish reversal, a relatively low level of the average momentum trendline is preferred, whereas for a bearish reversal, a relatively high level is preferred.
🔶 INDIVIDUAL CONFIGURATION
🔸Leading Asset
This input allows the user to select the leading asset for the divergence analysis.
🔸Following Asset
This input allows the user to select the following asset for the divergence analysis.
🔸Higher Timeframe
This input sets the higher timeframe for the analysis.
🔸Lower Timeframe
This input sets the lower timeframe for the analysis.
🔸Show RSI Divergence
This input enables or disables the display of RSI divergence signals.
🔸RSI Length
This input sets the length of the RSI calculation.
🔸RSI Source
This input sets the source data for the RSI calculation (e.g., close price).
🔸RSI Smoothing Length
This input sets the length of the smoothing applied to the RSI values.
🔸Smoothing Method
This input sets the method used for smoothing the RSI values.
🔶 CONCLUSION
The Multi-Asset Cross Timeframe Divergence Indicator (MACDI) is a powerful tool for identifying momentum divergences across multiple assets and timeframes. Its visual cues and customizable table make it easy to use and interpret, providing valuable insights for trading decisions.

Trade-o-Scope: Multi-Asset Price TrackerTrade-o-Scope team presents the "Multi-Asset Price Tracker" indicator.
"Multi-Asset Price Tracker" is designed to help analyze price changes across multiple assets within time intervals you define.
Motivation:
Most screeners on the market track price changes over predefined periods, like 1H\4H\12H\1D\3D\7D\etc. Typically, they compare initial and current prices.
But what if you want to analyze assets' performance over arbitrary historical intervals?
Perhaps you want to spot which assets dropped most within 7 hours after a specific industry announcement? Or do you want to check which asset grew the most in January last year?
This is where the "Multi-Asset Price Tracker" shines. It lets you define arbitrary intervals and track price changes for selected assets.
Overview and functionality:
Define arbitrary time intervals in history for analyzing price changes.
Create up to 10 lists, each with up to 40 symbols to track. Populate lists with data from text files, Excel, or CSV. Lists are just multiline text strings, each line representing an individual symbol.
Switch between lists, with one active list at a time.
Specify up to 3 fixed symbols for additional analysis alongside active list symbols. You may use them as reference points to compare price changes of the symbols in the List.
Customize table appearance and position.
Set sorting criteria and direction for displayed values.
View the results in a table on the chart.
How it works:
"Multi-Asset Price Tracker" will track the symbol's price during the interval you define.
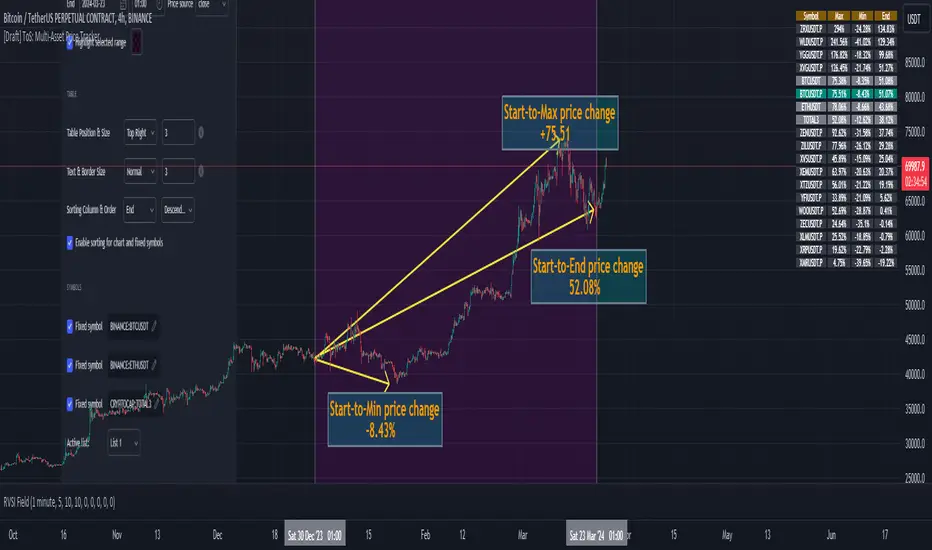
The indicator identifies each symbol's Start, Max, Min, and End prices during the interval. It then calculates relative changes: Start-to-Max, Start-to-Min, and Start-to-End.
The list of relative changes is ordered by the column chosen in settings and displayed on the chart.
List example (up to 10 Lists):
BINANCE:WLDUSDT.P
BINANCE:WOOUSDT.P
BINANCE:XEMUSDT.P
...
...
(up to 40 symbols per List)
Calculation example:
Symbol Start-price = $100
Symbol Max-price = $150
Symbol Min-price = $75
Symbol End-price = $110
Start-to-Max = 100% * (Max-price - Start-price) / Start-price = 100% * ($150 - $100) / $100 = 50%
Start-to-Min = 100% * (Min-price - Start-price) / Start-price = 100% * ($75 - $100) / $100 = -25%
Start-to-End = 100% * (End-price - Start-price) / Start-price = 100% * ($110 - $100) / $100 = 10%
Chart example:
In the provided chart, you can observe an example with a table generated by the indicator, along with manually added arrows and labels explaining the calculation process for an individual symbol from the list.
How to use:
1) Add "Multi-Asset Price Tracker" indicator to the chart
2) The indicator will ask you to define the start and the end of the interval using the mouse on the chart.
Voila! You'll see the table with sorted relative price changes based on default list values and settings.
3) Customize the indicator's settings:
Define the interval Start and End datetime.
Optionally, change the interval Start and End by clicking on the indicator name and dragging the vertical mark at the edges of the interval to a new position.
Define the Start and End price sources.
Choose a color to highlight the interval on the chart's background.
Set the table position, size, text size, and border size.
Specify the column for sorting and its direction.
Choose whether to sort chart symbols and fixed symbols together with list symbols or display them at the top of the table irrespective of their relative price change.
Enable fixed symbols if needed, and define up to 3 fixed symbols.
Define symbol lists, with up to 10 lists and 40 symbols each.
Select which List to make active - symbols from the active list will be calculated and displayed.
Supertrend Multiasset Correlation - vanAmsen Hello traders!
I am elated to introduce the "Supertrend Multiasset Correlation" , a groundbreaking fusion of the trusted Supertrend with multi-asset correlation insights. This approach offers traders a nuanced, multi-layered perspective of the market.
The Underlying Concept:
Ever pondered over the term Multiasset Correlation?
In the intricate tapestry of financial markets, assets do not operate in silos. Their movements are frequently intertwined, sometimes palpably so, and at other times more covertly. Understanding these correlations can unlock deeper insights into overarching market narratives and directional trends.
By melding the Supertrend with multi-asset correlations, we craft a holistic narrative. This allows traders to fathom not merely the trend of a lone asset but to appreciate its dynamics within a broader market tableau.
Strategy Insights:
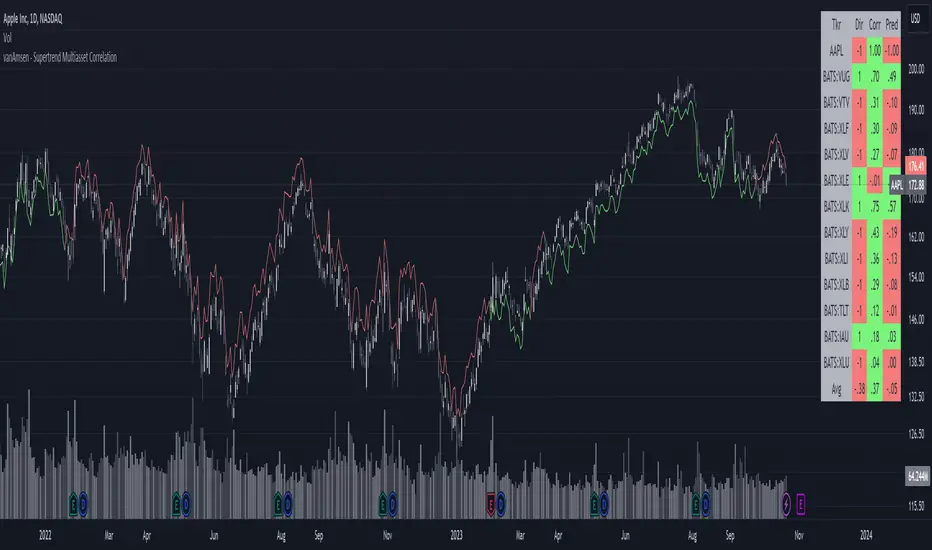
At the core of this indicator is its strategic approach. For every asset, a signal is generated based on the Supertrend parameters you've configured. Subsequently, the correlation of daily price changes is assessed. The ultimate signal on the selected asset emerges from the average of the squared correlations, factoring in their direction. This indicator not only accounts for the asset under scrutiny (hence a correlation of 1) but also integrates 12 additional assets. By default, these span U.S. growth ETFs, value ETFs, sector ETFs, bonds, and gold.
Indicator Highlights:
The "Supertrend Multiasset Correlation" isn't your run-of-the-mill Supertrend adaptation. It's a bespoke concoction, tailored to arm traders with an all-encompassing view of market intricacies, fortified with robust correlation metrics.
Key Features:
- Supertrend Line : A crystal-clear visual depiction of the prevailing market trajectory.
- Multiasset Correlation : Delve into the intricate interplay of various assets and their correlation with your primary instrument.
- Interactive Correlation Table : Nestled at the top right, this table offers a succinct overview of correlation metrics.
- Predictive Insights : Leveraging correlations to proffer predictive pointers, adding another layer of conviction to your trades.
Usage Nuances:
- The bullish Supertrend line radiates in a rejuvenating green hue, indicative of potential upward swings.
- On the flip side, the bearish trajectory stands out in a striking red, signaling possible downtrends.
- A rich suite of customization tools ensures that the chart resonates with your trading ethos.
Parting Words:
While the "Supertrend Multiasset Correlation" bestows traders with a rejuvenated perspective, it's paramount to embed it within a comprehensive trading blueprint. This would include blending it with other technical tools and adhering to stringent risk management practices. And remember, before plunging into live trades, always backtest to fine-tune your strategies.
Multi-Asset Month/Month % change 10yr Averages10 Year Averages of Month-on-Month % change: Shows current asset, and 3x user input assets
-For comparing seasonal tendencies among different assets.
-Choose from a variety of monthly average measures as source: sma(close, length), sma(ohlc4, length); as well as sma's of vwap, vwma, volume, volatility. (sma = simple moving average).
-Averages based on month cf previous month: i.e. Feb % = Feb compared to Jan; Jan % = Jan compared to prev year's Dec. Average of the last 10yrs of these values is the printed value.
-Plot on current year (2023), or previous year (2022). If Plotting on current year, and a month of year has not yet occured, a 9yr average will be printed.
/// notes ///
-daily bars in month is a global setting; so choose assets which have similar trading days per month. i.e. Crypto: length = 30 (days per month); Stocks/FX/Indices: length = 21 (days per month).
-only plots on Daily timeframe.
10yr Avgs; Plotting with Year = 2022; using sma(close, 21) as source for average M/M change

Cuban's Asset ScreenerCuban's Asset Screener is a tool designed to view the health of the entire market in a single charting window, using a multi-timeframe, real-time heatmapped asset screener built natively within Tradingview.
You can use this tool to aggregate and display critical information required to identify your favorite trade ideas using other Cuban's Edge tools. Although the screener currently uses pre-built lists for over 200+ Binance and Bybit Futures pairs, the tool comes with custom watchlist support, allowing you to add as many additional assets as your screen and browser will support.
Currently tracking range positions and a custom cross asset delta function from Cuban's Pair Trading Index, the screener has an in-built sorting function which orders assets by similar market structure and colors them relative to their performance against the user's comparison asset -- their current chart ticker.
Cuban's Asset Screener is also valuable as a tool to monitor performance of your portfolio against any benchmark asset, by using the 'Asset Redenomination' option within the settings. This allows the user to redenominate the entire screener easily using their current chart ticker.
In order to setup the Asset Screener, the user will need to select an 'Asset List' and a 'Screen Location' value. This will load the screener into a set position on screen, from right to left. In order to add additional assets, multiple instances of the asset screener will need to be loaded on screen.
With this indicator, users get the option to adjust the following:
range positioning lookback
asset redenomination for range positioning
asset sorting order
screen location
multi-timeframe support
live pricing for PTI values
in-built asset lists for 200+ assets
TO DO:
add market filters to the coloring
add tradfi asset lists
