WASDE DatesOverview
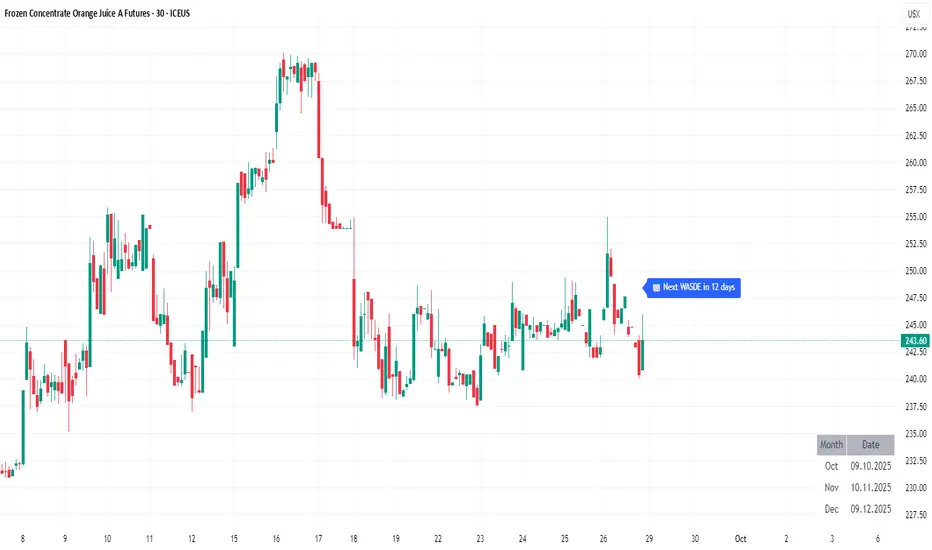
WASDE Dates — a small, focused event indicator that displays confirmed USDA WASDE release dates for 2025 on the chart and marks each release day. The indicator is designed to be a lightweight timing tool for traders who want clean visual reminders and optional alerts around USDA WASDE publications.
Features
• Shows official WASDE release dates for 2025 in a compact chart table.
• Draws on-chart markers and a dotted vertical line on WASDE release days.
• Two alert conditions you can enable in TradingView: "WASDE Day Alert" and "WASDE 24h Reminder".
• Simple table position control (Top/Bottom, Left/Right) in the indicator settings.
• Minimal, self-contained code — no external data feeds or permissions required.
How to use
1. Apply the indicator to any chart and timeframe.
2. Use the indicator settings to choose table position.
3. Enable Alerts (if desired) via TradingView Alerts → choose “WASDE Day Alert” or “WASDE 24h Reminder”.
4. This version contains 2025 confirmed dates only — verify dates for live trading and enable alerts as needed.
Design & rationale
This indicator is intentionally not a technical trading signal. It is an event scheduler focused on clarity and low overhead: combine it with your existing setup to avoid being surprised by WASDE publications and to quickly inspect price action around these event dates.
Limitations & disclaimer
• This script shows **confirmed 2025** WASDE dates only. It does not provide trading advice or entry/exit signals. Use at your own risk.
• Double-check official USDA publishing times before executing trades.
• No external links or contact information are included in this description to comply with TradingView publishing rules.
Feature outlook (V2)
Planned V2 (future release): enhanced countdown (days → hours/minutes), optional inclusion of estimated 2026 dates marked as (TBC), and an invite-only/protected advanced version with reaction overlays (T+1/T+3) and extended alert options. V2 will be announced on this script page when ready.
Changelog
v1 — public release: 2025 confirmed dates, release markers, alerts, table position control.
ACTUALITÉS
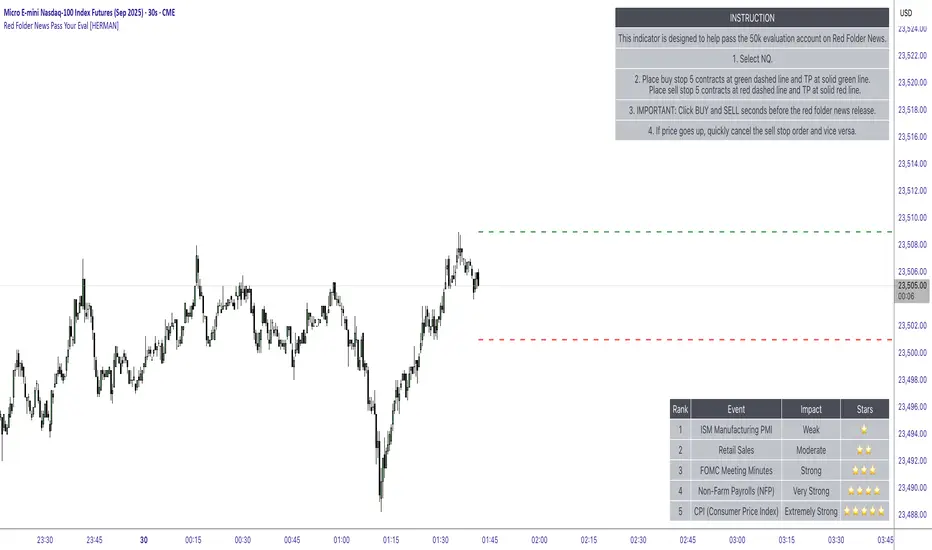
Red Folder News Pass Your Eval [HERMAN]Red Folder News Levels
This indicator provides visual reference levels around high-impact economic news events (commonly called “red folder” news) to help traders prepare for potential market volatility.
It is strictly educational and informational and does not place trades or guarantee any results.
What This Indicator Does:
-Plots dynamic price reference levels above and below the current market price.
-Displays Take Profit (TP) reference levels a fixed distance from the entry levels.
Shows optional on-chart tables:
Instruction Table – summarizes how to interpret the plotted levels.
Red Folder News Table – lists key economic events (CPI, NFP, FOMC, ISM, etc.) and ranks them by typical market impact.
Visual Elements on the Chart:
-Green Dashed Line → Upper reference level (potential long-side zone).
-Solid Green Line → Take-profit reference above the green dashed line.
-Red Dashed Line → Lower reference level (potential short-side zone).
-Solid Red Line → Take-profit reference below the red dashed line.
These levels update dynamically with each new bar, allowing you to see real-time visual guides around market-moving news releases.
Settings & What They Do:
-Entry Settings
-Manual Entry Offset (pts)
Distance in points above and below the current price to place the dashed reference levels.
Example: 4.0 means the green/red dashed lines appear 4 points above and below the current market price.
Instruction Table
Show Instruction Table (true/false)
If enabled, displays a step-by-step usage table on the top-right of the chart.
Explains how to interpret the visual levels in a simple flow.
Red Folder News Table
Show Red Folder News Table (true/false)
If enabled, displays a reference list of high-impact economic events on the bottom-right of the chart.
Events are ranked by market impact (⭐ to ⭐⭐⭐⭐⭐).
Theme Settings
Table Theme (Dark/Light)
Switch between a dark or light theme for all on-chart tables.
Adjusts the background and text colors to improve visibility depending on your chart style.
Note: The TP distance is fixed at 32 points and is automatically calculated from the entry lines.
How to Use (Educational Only)
Add the indicator to your chart and set your preferred Manual Entry Offset.
Check the Red Folder News Table to know which events typically generate higher volatility.
Observe the visual levels before high-impact economic releases.
Use them purely as reference zones for your own manual analysis and risk management.
⚠️ Disclaimer:
This script is for educational and informational purposes only.
It does not execute trades, provide financial advice, or guarantee performance.
Always trade responsibly and use your own judgment and risk management.
This description:
✅ Explains logic, visuals, and settings
✅ Avoids buy/sell instructions and profit promises
✅ Meets TradingView House Rules
Economic Event Timer & Alerts [AlgoXcalibur]Stay ahead of market-moving news with this real-time event tracker and countdown alert system.
This essential algorithm displays critical scheduled events that may influence sudden spikes in market volatility, helping you stay aware and reduce exposure to unpredictable moves before they even happen. Featuring a captivating on-chart display with event titles, adjustable time zone, real-time countdowns, and live alert notifications — you’ll always know what’s ahead — so you can prepare, not react.
🧠 Algorithm Logic
The Economic Event Timer & Alerts system delivers critical market awareness through an array of integrated functions. At its core, a live countdown table provides real-time updates on the day’s scheduled economic events, with dynamic, color-coded countdowns that ensure fast and easy interpretation at a glance. Complementing the table, Countdown Alerts notify you 30 minutes, 10 minutes, and 1 minute prior to each event—giving you clear, timely reminders without the need to constantly monitor your chart. The adjustable time zone input supports ET, CT, MT, PT, or UTC, so the displayed time-of-event aligns with your trading session. Rigorously refined, the algorithm updates the table daily—and clearly displays No Scheduled Events Today to provide certainty and reassurance on days without scheduled events. Packaged in a minimalist, unobtrusive design, the tool remains visually clean and focused for serious traders.
Updated automatically for hassle-free peace of mind.
⚙️ Features
• Time Zone Selector: Easily toggle between time zones to match your trading session.
• Countdown Alerts: Enable real-time notifications to keep you informed and aware of events without having to monitor the chart.
• Update & Expiration Awareness Feature:
This innovative feature includes a simple visual and alert system that prompts you when it’s time to reload the indicator & recreate alerts — ensuring your alerts are always tied to the latest data update.
🔄 Update Available
On the final day of current event data, the indicator will:
• Display Update Available on the indicator’s table
• Send an alert at 4:00 PM ET reminding you to reload & recreate alerts
You can load the updated version anytime that day.
⛔ Expired
If not reloaded, the next day the indicator will:
• Display an EXPIRED banner on the indicator’s table
• Send a Data Expired alert every day at 8:30 AM ET that prompts you to recreate alerts, until you do or disable the alert.
This prevents missing event alerts unknowingly.
Why is this feature necessary?
Even though the indicator is updated when necessary (typically every 2–4 weeks) to provide upcoming event data automatically, TradingView alerts do not auto-update —they stay tied to the version of the script that was active when the alert was created.
This thoughtful refinement is designed to ensure your alerts remain synced to current events and ready for when it matters most.
🚨 Protect Your Capital
At AlgoXcalibur, we understand that the best way to be profitable is to avoid unnecessary risk.
Dedicated to empowering traders with insight that matters, we designed this tool to transform inconvenient economic calendars into effortless, essential information—displayed directly on your chart. Whether you’re managing open positions or timing new trades, knowing when impactful events are about to hit is crucial to being proactive, protecting capital, and trading with confidence. This is not a technical analysis indicator—this is a risk management tool that provides traders with a fundamental edge.
Built for traders who value risk management, market awareness, and algorithm automation.
🔐 To get access or learn more, visit the Author’s Instructions section.

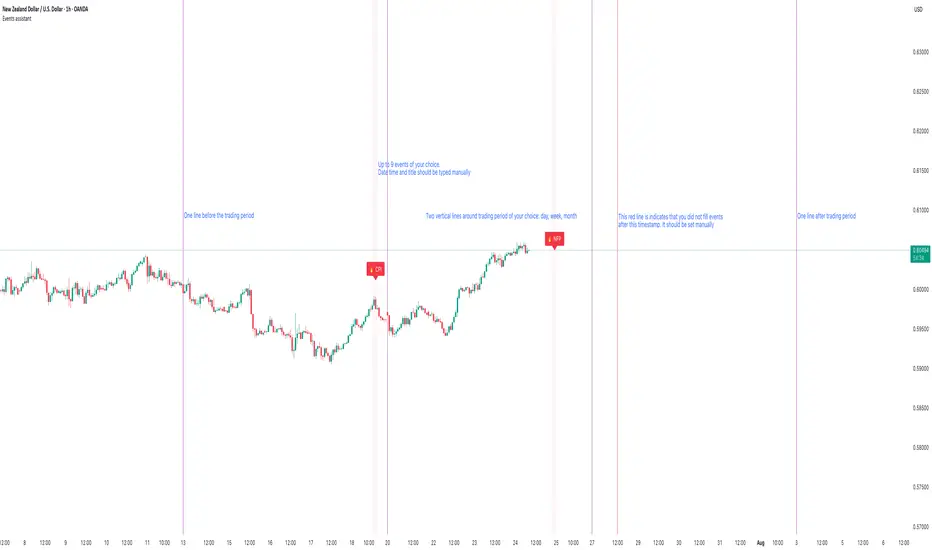
Events assistantThis script gives an ability to manually add events to your charts. There is no option to define events for different pairs. I trade only 2-3 pairs and it helps me a lot. It also draws vertical lines that separate trading period of your selection: daily, weekly and monthly. It is also possible to strictly define trading period. I use trading period every time during backtesting so it is easy to know when to start and when to finish. It also helps to remember that I already written down trading news during selected period.
BTC_News_2025Library "BTC_News_2025"
This library contains the tooltips used in the script "Bitcoin History Events (BTC Story)"
V1 News from January to May
tt_020125()
tt_070125()
tt_200125()
tt_270125()
tt_300125()
tt_030225()
tt_260225()
tt_240225()
tt_020325()
tt_030325()
tt_090325()
tt_110325()
tt_190325()
tt_280325()
tt_310325()
tt_020425()
tt_060425()
tt_090425()
tt_150425()
tt_190425()
tt_220425()
tt_050525()
tt_080525()
tt_130525()
tt_200525()
tt_220525()
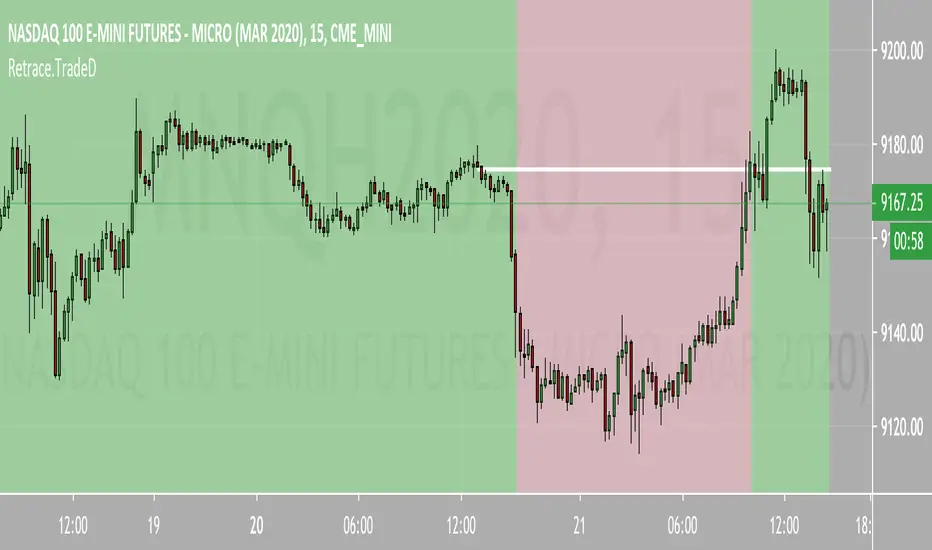
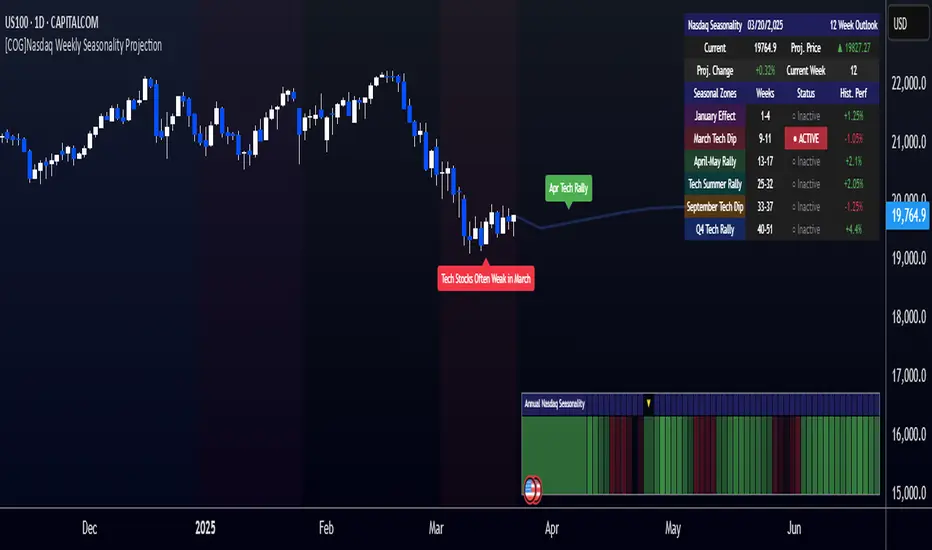
[COG]Nasdaq Weekly Seasonality ProjectionNasdaq Weekly Seasonality Projection
This indicator provides a visualization of Nasdaq seasonality patterns based on historical weekly performance data. It projects price movements for up to 26 weeks ahead, highlighting key seasonal periods that have historically affected tech stocks.
Key Features:
Projects price movements based on historical Nasdaq weekly seasonality patterns
Highlights six key seasonal periods: January Effect, March Lows, April-May Strength, Tech Summer Rally, September Dip, and Q4 Tech Rally
Customizable forecast length from 1-26 weeks with quick timeframe selection buttons
Optional moving average smoothing for more gradual projections
Detailed statistics table showing projected price and percentage change
Seasonality mini-map showing the full annual pattern with current position
Customizable colors and visual elements
How to Use:
Apply to Nasdaq indices or tech-focused instruments (daily timeframe or higher recommended)
Set your desired forecast length (1-26 weeks)
Monitor highlighted seasonal zones that have historically shown consistent patterns
Use the projection line as a general guideline for potential price movement
Settings:
Forecast length: Configure from 1-26 weeks or use quick select buttons (1M, 3M, 6M, 1Y)
Visual options: Customize colors, backgrounds, label sizes, and table position
Display options: Toggle statistics table, period highlights, labels, and mini-map
This indicator is designed as a visual guide to help identify potential seasonal tendencies in Nasdaq and tech stocks. Historical patterns are not guarantees of future performance, but understanding these seasonal biases can provide valuable context for your trading decisions.
Note: For optimal visualization, use on Daily timeframe or higher. Intraday timeframes will display a warning message.
Tweet/X Post Timestamp - By LeviathanThis script allows you to generate visual timestamps of X/Twitter posts directly on your chart, highlighting the precise moment an X post/tweet was made. All you have to do is copy and paste the post URL.
◽️ Use Cases:
- News Trading: Traders can use this indicator to visually align market price actions with news or announcements made on X (formerly Twitter), aiding in the analysis of news impact on market volatility.
- Behavioral Analysis: Traders studying the influence of social media on price can use the timestamps to track correlations between specific posts and market reactions.
- Proof of Predictions: Traders can use this indicator to timestamp their market forecasts shared on X (formerly Twitter), providing a visual record of their predictions relative to actual market movements. This feature allows for transparent verification of the timing and accuracy of their analyses
◽️ Process of Timestamp Calculation
The calculation of the timestamp from a tweet ID involves the following steps:
Extracting the Post ID:
The script first parses the input URL provided by the user to extract the unique ID of the tweet or X post. This ID is embedded in the URL and is crucial for determining the exact posting time.
Calculating the Timestamp:
The post ID undergoes a mathematical transformation known as a right shift by 22 bits. This operation aligns the ID's timestamp to a base reference time used by the platform.
Adding Base Offset:
The result from the right shift is then added to a base offset timestamp (1288834974657 ms, the epoch used by Twitter/X). This converts the processed ID into a UNIX timestamp reflecting the exact moment the post was made.
Date-Time Conversion:
The UNIX timestamp is further broken down into conventional date and time components (year, month, day, hour, minute, second) using calculations that account for leap years and varying days per month.
Label Placement:
Based on user settings, labels displaying the timestamp, username, and other optional information such as price changes or pivot points are dynamically placed on the chart at the bar corresponding to the timestamp.

News AlertIntention Of This Indicator
This indicator allows you to enter daily news release times, and it will warn you before and after that news release time ( to help you stay out of trading news )
This indicator is not intended to display news releases automatically. You must manually enter the time you wish to display news in the inputs
This indicator Draw / Displays the following
A line displaying where the news release is going to happen ( only according to your time input settings )
A box that surrounds the news release ( only according to your time input settings )
A table in the bottom right corner that shows you when there is Active News ( only according to your time input settings )
Inputs
Inputs to change the aesthetics ( colours etc. )
Numeric inputs to modify the placement News / Area
Toggles to activate or deactivate features
Disclaimer
This indicator does not guaranteed to work for every instrument ( always test before use! )
This indicator is not guaranteed to be accurate, or error free.
You must manually enter the news time inputs, this indicator does not automatically show you when there is a news release

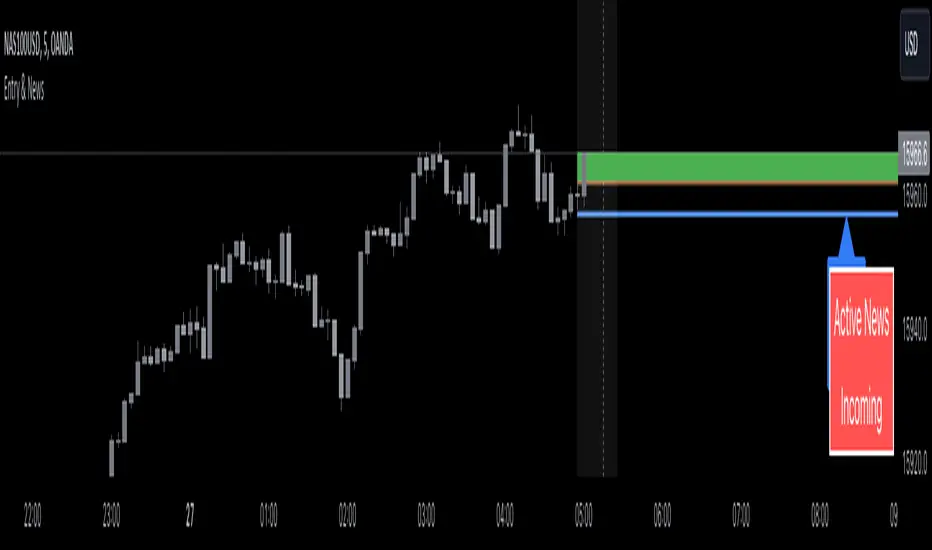
Entry Assistant & News AlertIntention Of This Indicator
This indicator is intended to be used as an assistant in combination with a technical strategy.
This indicator has several functions intended to assist you at entering positions.
This indicator is intended to be used with strategies that place Stop Losses above / below candles, and entries at the BOC ( Break Of The Previous Candle , For Longs it is when price goes above the previous candles high, For Shorts it is when price goes below the previous candles low)
This indicator allows you to enter daily news release times, and it will warn you before and after that news release time ( to help you stay out of trading news )
This indicator Draw / Displays the following
A line below ( for Longs ) / above ( for Shorts ) the current candle, with an additional pip value for extra space ( this displays where to place your Stop Loss )
A label displaying the price of the Stop Loss line, to assist in placing the Stop Loss
A line displaying where the BOC is ( based off of going Long or going Short )
A box that appears when the BOC has occurred ( entry signal )
A line displaying where the news release is going to happen ( only according to your time input settings )
A box that surrounds the news release ( only according to your time input settings )
A table in the bottom right corner that shows you when there is Active News ( only according to your time input settings )
Inputs
Inputs to change the aesthetics ( colours etc. )
Numeric inputs to modify the placement / spacing of the Stop Loss / Entry signal / News
Toggles to activate or deactivate features
Disclaimer
This indicator does not guaranteed to work for every instrument ( always test before use! )
It is not at all intended to be a signal indicator on its own, but rather only to give a signal when used with specific technical strategies that us BOC entries.
This indicator is not guaranteed to be accurate, or error free.
This indicator is not signalling winning entries or high probability entries.
You must manually enter the news time inputs, this indicator does not automatically show you when there is a news release
This is a combination indicator of my Entry Assistant and my News Alert indicator, both can be found and used separately.
CalendarCadLibrary "CalendarCad"
This library provides date and time data of the important events on CAD. Data source is csv exported from www.fxstreet.com and transformed into perfered format by C# script.
HighImpactNews2015To2023()
CAD high impact news date and time from 2015 to 2023

CalendarGbpLibrary "CalendarGbp"
This library provides date and time data of the important events on GBP. Data source is csv exported from www.fxstreet.com and transformed into perfered format by C# script.
HighImpactNews2015To2019()
GBP high impact news date and time from 2015 to 2019
HighImpactNews2020To2023()
GBP high impact news date and time from 2020 to 2023

CalendarJpyLibrary "CalendarJpy"
This library provides date and time data of the important events on JPY. Data source is csv exported from www.fxstreet.com and transformed into perfered format by C# script.
HighImpactNews2015To2023()
JPY high impact news date and time from 2015 to 2023
CalendarUsdLibrary "CalendarUsd"
This library provides date and time data of the important events on USD. Data source is csv exported from www.fxstreet.com and transformed into perfered format by C# script.
HighImpactNews2015To2019()
USD high impact news date and time from 2015 to 2019
HighImpactNews2020To2023()
USD high impact news date and time from 2020 to 2023

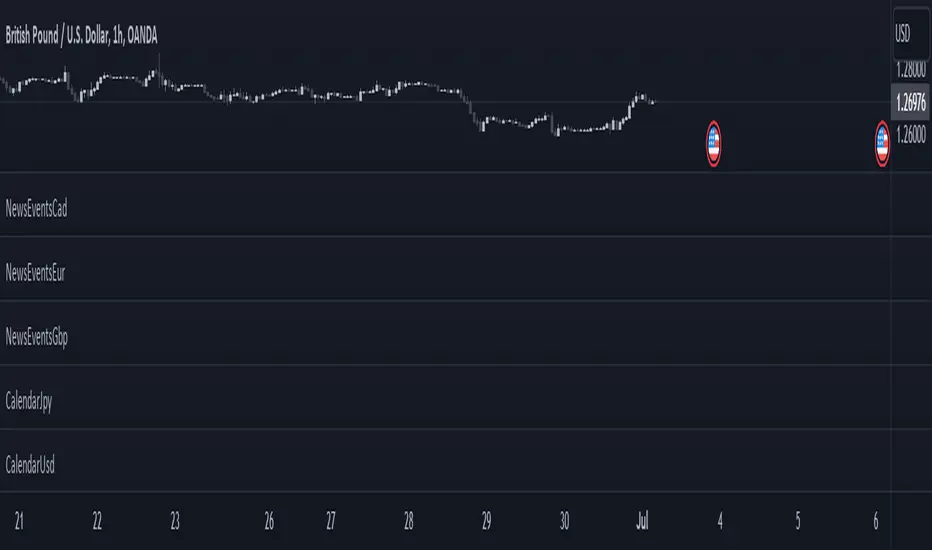
NewsEventsGbpLibrary "NewsEventsGbp"
This library provides date and time data of the high imact news events on GBP. Data source is csv exported from www.fxstreet.com and transformed into perfered format by C# script.
gbpNews2015To2019()
GBP high imact news date and time from 2015 to 2019
gbpNews2020To2023()
GBP high imact news date and time from 2020 to 2023

NewsEventsEurLibrary "NewsEventsEur"
This library provides date and time data of the high imact news events on EUR. Data source is csv exported from www.fxstreet.com and transformed into perfered format by C# script.
eurNews2015To2019()
EUR high imact news date and time from 2015 to 2019
eurNews2020To2023()
EUR high imact news date and time from 2020 to 2023

NewsEventsJpyLibrary "NewsEventsJpy"
This library provides date and time data of the high imact news events on JPY. Data source is csv exported from www.fxstreet.com and transformed into perfered format by C# script.
jpyNews2015To2023()
JPY high imact news date and time from 2015 to 2023

NewsEventsCadLibrary "NewsEventsCad"
This library provides date and time data of the high imact news events on CAD. Data source is csv exported from www.fxstreet.com and transformed into perfered format by C# script.
cadNews2015To2023()
CAD high imact news date and time from 2015 to 2023
NewsEventsUsdLibrary "NewsEventsUsd"
This library provides date and time data of the high imact news events on USD. Data source is csv exported from www.fxstreet.com and transformed into perfered format by C# script.
usdNews2015To2019()
USD high imact news date and time from 2015 to 2019
usdNews2020To2023()
USD high imact news date and time from 2020 to 2023
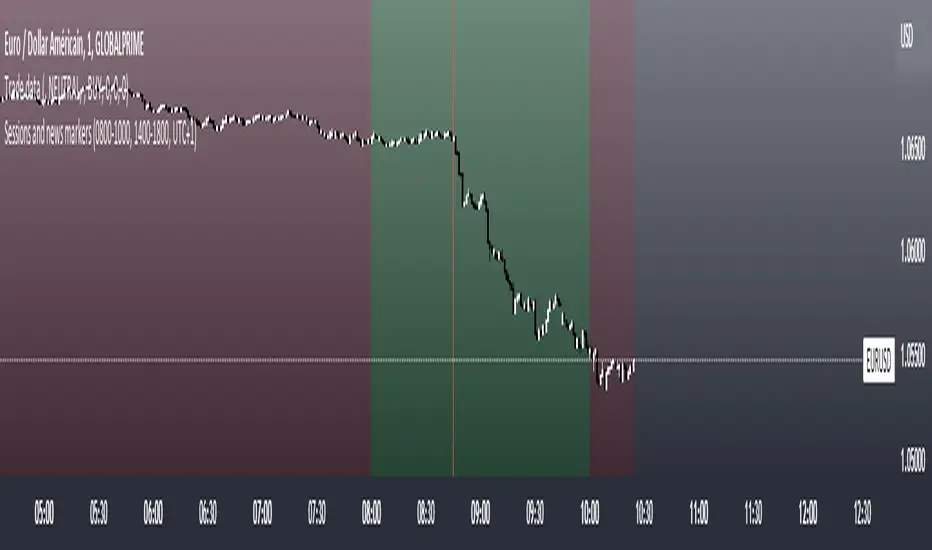
Sessions and news markersHello,
I use this script daily so I thought it might help some of you guys out!
WHAT IS THE SCRIPT
This script can show two custom trading sessions and up to three specific dates and hours to keep in mind while trading (for example a news release).
WHY USE THE SCRIPT
My trading plan tells me to trade from 08:00am to 10:00am (GMT+1) and not to let open trades during a high impact news release, this script allows me to show my trading session and mark the news releases on the chart before trading so I don't forget about them while in the heat of trading.
HOW TO USE THE SCRIPT
It is very straightforward:
How to set up the TRADING SESSIONS:
- Tick the trading sessions that you want to use (one or two)
- Specify the trading hours
- Choose the color of the trading sessions
- Choose the color to fill outside of the trading sessions
- Choose the time zone (GMT, GMT+1, UTC, UTC+2...)
How to set up the NEWS MARKERS:
- Tick the news markers you want to use (up to three)
- Specify the date and hours of the news
- Choose the color of the news markers
- No need to choose the time zone, it will use the timezone of the chart
PS: As you can see in the settings, each session and news marker can have their own color
I hope this helps you out as much as it helps me! If you have any recommendations I would be glad to hear them :)
High Impact NewsDo you have a difficult time remembering high-impact news events throughout the trading week? Now there is an indicator that allows the user to put labels directly on their charts at specific times in the future so news events won’t sneak up on the user.
Description
The “High Impact News” TradingView indicator by Infinity Trading gives the user complete control of three labels that can be set to any time and day of the trading week, even in the future. Each label can be displayed at a specific time, on a unique day of the week, and with custom text. Also, each label has a choice of over 20 emojis to display on the chart along with user-defined text. The text color and size can be independently adjusted.
The position of the labels on the chart can be easily moved up or down with 5 built-in presents: Current Week High, Current Day High, Current Price, Current Day Low, and Current Week Low. Additionally, each label has a separate buffer that allows the users to move the label up or down in increments of five. All of these user-controls ensure the labels are exactly where the user wants them on their charts.
Limitations
This indicator displays labels in the future. TradingView sets a limit of 500 bars/candles in the future you can interact on. This TradingView limit means that labels can only be drawn 500 candles in the future on any timeframe. On larger timeframes this is not a problem and one trading week can easily display any labels. But on smaller timeframes labels multiple days in the future will exceed the 500 candle limit. When a label exceeds the 500 candle limit the indicator will have a temporary error. THIS IS NOT A PROBLEM. Simply go back to a higher timeframe or wait until the label is within 500 candles. All of your Settings will be saved! This is just a limit placed by TradingView that cannot be overwritten.
Important Notice
As stated above, this indicator draws labels in the future on your charts. To achieve future labels, this indicator draws labels in the present and shifts them to the right (which is the future) certain number of bars. Please be aware of the following characteristics of this indicator:
Labels will not appear until after midnight EST on Monday of each trading week
Labels will not appear over the weekends
Labels set to “Monday” won’t appear until midnight EST on Monday (or later)
Labels set to “Tuesday” through “Friday” won’t appear until the time specified in the Settings on Monday. For example, a FOMC label set to 2pm EST on Wednesday will not appear on the chart until 2pm EST on Monday
On 1-Hour or 2-Hour charts, please note that labels with a non-hour time will be shifted slightly so they appear on the chart. For example, a label at 8:15 am on the 5-min chart will be adjusted to 8:00 am on the 1-Hour chart so the label will appear
The above characteristics are a result of having to draw the labels at a specified time (of the trading week) and then calculating how many bars it takes to get the label to the correct time in the future.

NewsTrader from Boris SchlossbergThis forex news trading indicator helps you to pick the highest probability post-news trades with the best possible entries. It is designed to trade major events like Central Bank rate decisions, Non-Farm payrolls, and other economic data.