Open Close Cross Alert R6 by JustUncleLThis revision of this indicator is an Open Public release. The indicator alert based on JayRogers "Open Close Cross Strategy R2" and is used in conjunction with the revised "Open Close Cross Strategy R5".
Description:
This indicator alert created for TradingView alarm sub-system (via the alertcondition() function, which currently does not work in a "Strategy" script). Also this indicator plots the Difference Factor between the Close and Open Moving Averages, this gives a good indication of strength of move. Also included in this release is optional Divergence finder with variable width channel.
Open-close

Open Close Cross Strategy R5 revised by JustUncleLThis revision is an open Public release, with just some minor changes. It is a revision of the Strategy "Open Close Cross Strategy R2" originally published by @JayRogers.
*** USE AT YOUR OWN RISK ***
JayRogers : "There are drawing/painting issues in pinescript when working across resolutions/timeframes that I simply cannot fix here.. I will not be putting any further effort into developing this until such a time when workarounds become available."
NOTE: Re-painting has not been observed with the default set up, nor with Alternate resolution multiplier up to 5.
Description:
Strategy based around Open-Close Moving Average Crossovers optionally from a higher time frame.
Setup:
I have generally found that setting the strategy resolution to 3-5x that of the chart you are viewing tends to yield the best results, regardless of which MA option you may choose (if any) BUT can cause a lot of false positives - be aware of this. JustUncleL: using one of the Smoothed MA helps reduce false positives.
Don't aim for perfection. Just aim to get a reasonably snug fit with the O-C band, with good runs of green and red. JustUncleL: using SMMA (8 to 10) gives a good fit.
Option to either use basic open and close series data, or pick your poison with a wide array of MA types.
Optional Stop Loss and Target Profit for damage mitigation if desired (can be toggled on/off)
Positions get taken automatically following a crossover - which is why it's better to set the resolution of the script greater than that of your chart, so that the trades get taken sooner rather than later.
If you make use of the stops/target profit, be sure to take your time tweaking the values. Cutting it too fine will cost you profits but keep you safer, while letting them loose could lead to more draw down than you can handle.
Revsion R5 Changes by JustUncleL
Corrected cross over calculations, sometimes gave false signals.
Corrected Alternate Time calculation to allow for Daily,Weekly and Monthly charts.
Open Public release.
Revision R4 By JustUncleL
Change the way the Alternate resolution in selected, use a Multiplier of the base Time Frame instead, this makes it easy to switch between base time frames.
Added TMA and SSMA moving average options. But DEMA is still giving the best results.
Using "calc_on_every_tick=false" ensures results between back testing and real time are similar.
Added Option to Disable the coloring of the bars.
Updated default settings.
R3 Changes by JustUncleL:
Returned a simplified version of the open/close channel, it shows strength of current trend.
Added Target Profit Option.
Added option to reduce the number of historical bars, overcomes the too many trades limit error.
Simplified the strategy code.
Removed Trailing Stop option, not required and in my option does not work well in Trading View, it also gives false and unrealistic performance results in back testing.
R2 Changes by @JayRogers:
Simplified and cleaned up plotting, now just shows a Moving Average derived from the average of open/close.
Tried very hard to alleviate painting issues caused by referencing alternate resolution.

Open Close Daily LineThis will place circles on your chart for the opening daily price. If price is above, the circles are green. If price is below, the circles are red. I wanted to be able to see the opening price a bit easier while in smaller time frames.
I decided to add the previous daily closing line to the original script. Basically looking for good support / resistance

_CM_High_Low_Open_Close_Weekly-IntradayUpdated Indicator - Plots High, Low Open, Close
For Weekly, Daily, 4 Hour, 2 Hour, 1 Hour Current and Previous Sessions Levels.
Updated Adds 4 Hour, 2 Hour, 1 Hour levels for Forex and Intra-Day Traders.

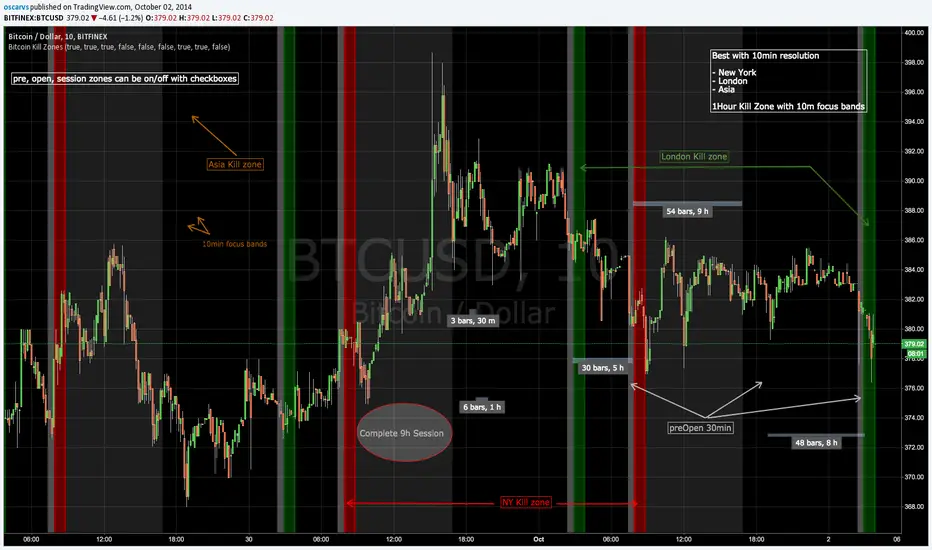
Bitcoin Kill ZonesGRAB THE LASTEST VERSION HERE:
*********************
This indicator shows when the candle is entering New York, London or Asia Kill Zone (open market).
gray: 30min before market opens.
red, green, orange: First 1 hour with 10min focus bands.
silver: complete 30min session market until close.
FIX NOTE:
Set this hours for Asia to fix the 1 hour difference:
2330-0000
0000-0010
0010-0050
0050-0100
0100-0900
* this is beta, in planning to mark dynamically ranges before/after open/close session and use some Fibs to have some ripple effect indicator
Updated code: github.com