First Opening Price of the YearOverview
This indicator identifies and plots the opening price of the first trading session of the calendar year. The "Yearly Open" is a significant psychological level for traders and institutions, often serving as a major pivot point for the entire year's trend.
How it Works
The script utilizes Pine Script v5's persistent variables to track the year change.
Detection: It compares the current bar's year (year) with the previous bar's year (year ).
Storage: When a discrepancy is found (indicating a new year has started), the script captures the open price of that specific bar.
Persistence: Using the var keyword, this price is stored in memory and carried forward for every subsequent bar of the year without being recalculated.
Visualization: The price is plotted as a series of blue crosses (style_cross) to clearly mark the level on the chart.
Chart Analysis & Examples
The following examples demonstrate how this simple level dictates market structure across different assets:
Historical Pivot Points (S&P 500):
This chart demonstrates how the Yearly Open acts as a critical pivot. Notice in 2022 how price struggled around the open before dropping, while in 2023 and 2024, the yearly open provided a solid base for the subsequent rallies.
Trend Confirmation (Bitcoin):
In strong trending markets, the Yearly Open serves as a trailing support. As seen in this Bitcoin example, price maintaining its position above the blue line confirms a sustained bullish bias for the year, acting as a "floor" for the trend.
Market Structure & Bias (Gold):
This example highlights the "Line in the Sand" concept. The indicator clearly marks the starting point of the year, allowing traders to instantly gauge if the asset is net positive or negative year-to-date. It filters out the noise and focuses on the macro direction.
How to Use
Traders can use this indicator to determine the higher-timeframe bias:
Bullish Bias: When the current price is trading above the blue crosses, the market is considered to be positive relative to the start of the year.
Bearish Bias: When the current price is trading below the blue crosses, the market is negative relative to the start of the year.
Settings
This script is "plug and play" and requires no manual input adjustments. It automatically detects the timeframe and year changes based on the chart data provided.
Disclaimer
This tool is for informational purposes only and DOES NOT constitute financial advice. Always manage your risk appropriately.
Openingprice

Candle Opens by HAZED🎯 Candle Opens by HAZED - Multi-Timeframe Open Levels Indicator
📊 Overview
This powerful indicator displays multiple timeframe opening prices on your chart, providing crucial reference levels that institutional traders and algorithms frequently monitor. Track up to 7 different timeframe opens simultaneously, from 1-hour to yearly, with advanced visualization features including dynamic coloring, heatmap analysis, and real-time status tracking.
✨ Key Features
📈 Multi-Timeframe Support:
- 1H, 4H, Daily, Weekly, Monthly, Quarterly, and Yearly opens
- Each timeframe can be individually enabled/disabled
- Automatic visibility adjustment based on chart timeframe
🎨 Dynamic Visual System:
- Smart Color Coding: Lines automatically change color based on price position (green above, red below)
- Customizable Styling: Adjust line thickness, transparency, and colors
- Intelligent Line Positioning: Choose between equal-length or staggered lines for better visibility
- Enhanced Labels: Display timeframe only or include price with colored background
🌈 Advanced Heatmap:
- Background coloring shows overall market sentiment across all timeframes
- Gradient or solid color modes
- Instantly see when multiple timeframes align bullish or bearish
📊 Status Table Dashboard:
- Real-time overview of all active opens
- Shows current price position relative to each open
- Simplified view when all timeframes align
- Customizable position and font style
⚙️ Professional Tools:
- Alert system for new open levels
- Extended hours session support
- Price discovery mode for EOD/intraday discrepancies
- Left/right line extensions for enhanced visibility
💡 Trading Applications
Support & Resistance:
Opening prices act as natural support/resistance levels. Price often reacts at these levels, providing entry/exit opportunities.
Trend Confirmation:
When price is above multiple opens (especially higher timeframes), it confirms bullish momentum. The opposite indicates bearish pressure.
Mean Reversion:
Price tends to revert to significant opens, particularly daily and weekly levels. Use these as targets for counter-trend trades.
Breakout Trading:
Monitor when price breaks above/below clustered opens for potential continuation moves.
Risk Management:
Use opens as logical stop-loss levels or position sizing references based on distance from key opens.
🔧 Indicator Settings
Timeframes Section:
- Toggle each timeframe on/off
- Customize individual colors
Visual Style Section:
- Dynamic Colors: Auto-color based on price position
- Line Thickness: 1-4 pixels
- Transparency: 0-80%
- Extension Length: How far lines extend right
- Label Style: Plain or enhanced with price
Heatmap Section:
- Enable/disable background coloring
- Adjust transparency
- Choose gradient or solid zones
Status Table Section:
- Position on chart
- Font selection
Advanced Section:
- Enable alerts for new opens
- Price discovery mode
- Extended hours inclusion
]📈 Best Practices
1. Timeframe Selection:
- For intraday: Focus on 1H, 4H, and Daily
- For swing trading: Daily, Weekly, Monthly
- For position trading: Monthly, Quarterly, Yearly
2. Color Coding:
- Enable dynamic colors for instant sentiment reading
- Use heatmap for overall market bias
3. Confluence Zones:
- Pay special attention when multiple opens cluster
- These zones often produce stronger reactions
4. Alignment Signals:
- When all timeframes show same color = strong trend
- Mixed colors = potential consolidation or reversal zone
🎯 Pro Tips
- Volume Confirmation: Combine with volume indicators to confirm reactions at open levels
- Multiple Instruments: Compare opens across correlated assets for divergences
- News Events: Opens often act as magnets after major news releases
- Options Trading: Weekly and monthly opens align with options expiry levels
- Algorithmic Levels: Many algorithms use these opens for entries/exits
🔄 Updates in Version 8.3
- Added 1H and 4H timeframe support
- Enhanced dynamic color system
- Implemented heatmap visualization
- Added real-time status table
- Optimized performance for smoother operation
- Improved label styling options
- Better yearly timeframe detection
⚡ Performance Optimizations
This indicator uses advanced Pine Script v6 features for optimal performance:
- Efficient object reuse instead of recreation
- Smart calculation loops
- Minimal repainting
- Optimized for real-time updates
📝 Notes
- Works on all markets (stocks, forex, crypto, futures)
- Best on timeframes lower than the opens you're tracking
- Lines automatically hide when their timeframe is lower than chart timeframe
- Past opens are not displayed (indicator shows current opens only)
🙏 Credits & Support
Created by HAZED | Version 8.3
Optimized for TradingView Pine Script v6
For questions, suggestions, or bug reports, please comment below.
If you find this indicator useful, please consider leaving a like and a follow!
Remember: No indicator is perfect. Always use proper risk management and combine multiple confirmation signals in your trading decisions.

LA - Opening Price based Previous day Range PivotThis "LA - Opening Price based Previous day Range Pivot" indicator is a custom technical analysis tool designed for Trading View charts. It plots support and resistance levels (often referred to as pivots or ranges) based on the current opening price combined with the previous period's trading range. The "previous period" can be daily, weekly, or monthly, making it a multi-timeframe tool. These levels are projected using Fibonacci-inspired multipliers to create potential breakout or reversal zones.
The core idea is inspired by concepts like the Opening Range Breakout (ORB) strategy or Fibonacci pivots, but it's customized here to use a dynamic range calculation (the maximum of several absolute price differences) rather than a simple high-low range. This makes it more robust for volatile markets. Levels are symmetric above (resistance) and below (support) the opening price, helping traders identify potential entry/exit points, stop-losses, or targets. This will be useful when there is a gap-up/down as in Nifty/Sensex .
Purpose of the Indicator:
To visualize potential support/resistance zones for the current trading session based on the opening price and historical range data. This helps traders anticipate price movements, such as breakouts above resistance or bounces off support
Use Cases:
Intraday Trading: On lower timeframes (e.g., 5-min or 15-min charts), it shows daily levels for short-term trades.
Swing Trading: On higher timeframes (e.g., hourly or daily), it displays weekly/monthly levels for longer holds.
Range Identification: The filled bands highlight "zones" where price might consolidate or reverse.
Conditional Display: Levels only appear on appropriate timeframes (e.g., daily levels on intraday charts <60min), preventing clutter.
Theoretical Basis: It builds on pivot point theory, where the opening price acts as a central pivot. Multipliers (e.g., 0.618 for Fibonacci golden ratio) project levels, assuming price often respects these ratios due to market psychology.
How Calculations Work
Let's dive into the math with examples. Assume a stock with:
Current daily open (cdo) = $100
Previous daily high (pdh) = $105, low (pdl) = $95, close (pdc) = $102, close 2 days ago (pdc2) = $98
Step 1: Dynamic Range Calculation (var_d2):
This is the max of:
|pdh - pdc2| = |105 - 98| = 7
|pdl - pdc2| = |95 - 98| = 3
|pdh - pdl| = |105 - 95| = 10 (previous day range)
|pdh - cdo| = |105 - 100| = 5
|pdl - cdo| = |95 - 100| = 5
|pdc - cdo| = |102 - 100| = 2
|pdc2 - cdo| = |98 - 100| = 2
Max = 10 (so range = 10). This ensures the range accounts for gaps and extended moves, not just high-low.
Step 2: Level Projections:
Resistance (above open): Open + (Range * Multiplier)
dre6 = 100 + (10 * 1.5) = 115
dre5 = 100 + (10 * 1.27) ≈ 112.7
... down to dre0 = 100 + (10 * 0.1) = 101
dre50 = 100 + (10 * 0.5) = 105 (midpoint)
Support (below open): Open - (Range * Multiplier)
dsu0 = 100 - (10 * 0.1) = 99
... up to dsu6 = 100 - (10 * 1.5) = 85
Without Indicator
With Indicator
Pros and Cons
Pros:
Multi-Timeframe Flexibility: Seamlessly integrates daily, weekly, and monthly levels, useful for aligning short-term trades with longer trends (e.g., intraday breakout confirmed by weekly support).
Dynamic Range Calculation: Unlike standard pivots (just (H+L+C)/3), it uses max of multiple diffs, capturing gaps/volatility better—great for stocks with overnight moves.
Customizable via Inputs: Users can toggle levels, adjust multipliers, or change timeframes without editing code. Inline inputs keep the UI clean.
Visual Aids: Filled bands make zones obvious; conditional colors highlight "tight" vs. "wide" ranges (e.g., for volatility assessment).
Fibonacci Integration: Levels based on proven ratios, appealing to technical traders. Symmetric supports/resistances simplify strategy building (e.g., buy at support, sell at resistance).
No Repainting: Uses historical data with lookahead, so levels are fixed once calculated—reliable for back-testing.
Cons:
Chart Clutter: With all toggles on, 50+ plots/fills can overwhelm the chart, especially on mobile or small screens. Requires manual disabling.
Complexity for Beginners: Many inputs and calculations; without understanding fib ratios or range logic, it might confuse new users.
Performance Overhead: On low timeframes (e.g., 1-min), fetching higher TF data multiple times could lag, especially with many symbols or back-tests.
Assumes Volatility Persistence: Relies on previous range projecting future moves; in low-vol markets (e.g., sideways trends), levels may be irrelevant or too wide/narrow.
No Alerts or Signals: Purely visual; no built-in buy/sell alerts or crossover conditions—users must add separately.
Hardcoded Styles/Colors: Limited customization without code edits (e.g., can't change line styles via inputs).
Also, not optimized for non-stock assets (e.g., forex with 24/7 trading).
In summary, this is a versatile pivot tool for range-based trading based on Opening price, excelling in volatile markets but requiring some setup. If you're using it, start with defaults on a daily chart and toggle off unnecessary levels.

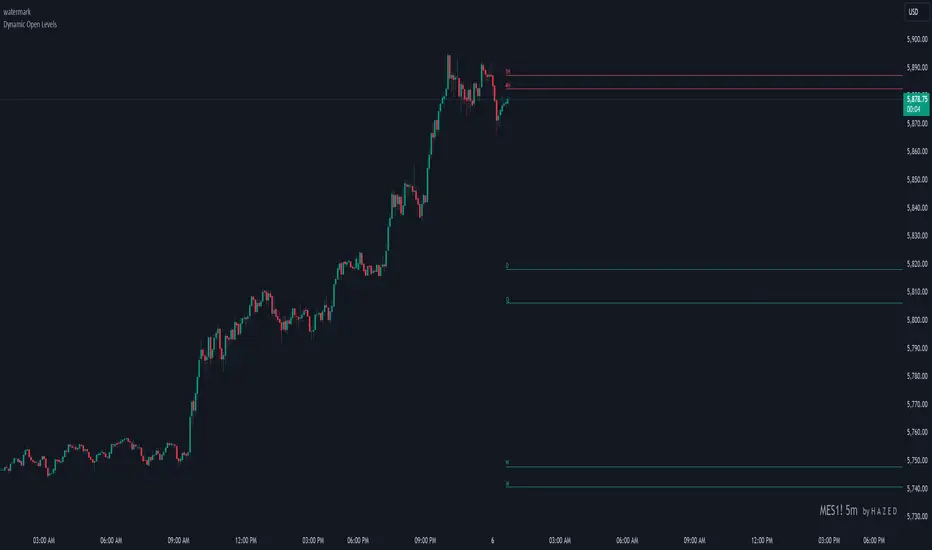
Dynamic Open Levels# Dynamic Open Levels Indicator v1.0
Release Date: November 5, 2024
Introducing the Dynamic Open Levels indicator on TradingView! This tool helps traders visualize and analyze key opening price levels across multiple timeframes, making your market analysis more effective.
---
### Key Features
- Multiple Timeframes : Yearly, Quarterly, Monthly, Weekly, Daily, 4H, and 1H levels available.
- Visibility Controls : Easily toggle visibility for each timeframe to suit your trading style.
- Line Customization : Set custom thickness and colors for lines, making charts easy to interpret.
- Monthly: Purple
- Weekly: Blue
- Daily: Green
- 4H: Red
- 1H: Orange
- Dynamic Coloring : Lines adjust color based on market conditions—teal for bullish (`rgb(34, 171, 148)`) and coral for bearish (`rgb(247, 82, 95)`).
### Labels & Customization
- Real-Time Labels : Each level is labeled for easy identification (e.g., Y for Yearly, Q for Quarterly).
- Label Settings : Customize opacity, text color, size, and position for clarity without cluttering your chart.
- Sizes : Choose from tiny, small, normal, large, to huge.
- Offset : Set labels from 1 to 10 to position them precisely.
- Color Management : Organize all colors under a dedicated Line Colors group for easy adjustments.
### Advanced Plotting & Performance
- Real-Time Updates : Levels are updated dynamically with the latest open prices.
- Extended Lines : Lines extend to the right, offering a consistent reference for future price movement.
- Optimized Performance : Handles up to 500 lines efficiently to maintain smooth performance.
---
### Installation Instructions
1. Add to Chart :
- Go to the Indicators section in TradingView.
- Search for Dynamic Open Levels and add it to your chart.
2. Customize Settings :
- Line Thickness : Adjust to suit your preference.
- Visibility : Toggle timeframes like Yearly, Monthly, Weekly, etc., as needed.
- Labels : Configure opacity, text color, size, and offset under the Label Settings group.
---
### Documentation & Support
For guidance on using the Dynamic Open Levels indicator, visit our Documentation (#). If you need assistance, check out our Support Channel (#).
---
Thank you for choosing Dynamic Open Levels . Stay tuned for future updates that will continue to improve your trading experience!
H A Z E D
Key Times & Opening Prices [Olitrades]This indicator plots key time's (opening prices) with the possibility of vertical separators. It was initially created to utilize on the indices futures market, utilizing ICT logic.
These opening prices are often utilized to determine if price is currently at a premium or a discounted value.
The default times include:
Daily Open (18:00 PM)
Midnight (00:00 AM)
Settlement (15:00 PM)
7:30 AM
8:30 AM
9:30 AM (Equities Open)
10:00 AM (Morning 4h Candle Open)
14:00 PM (Afternoon 4h Candle Open)
Along with up to three custom time slots.
All times used in the indicator are Eastern Standard time (New York local time) and will automatically adjust no matter your time zone.
Historical
When in historical mode, the indicator will keep the previous levels so you can easily visualize them and their relation to price.
You can also choose how many past levels you want to see. This allows you to back test only specific days/weeks.
Other Inputs
The indicator contains an adjustable offset, to modify how far the line extends depending on the current timeframe.
Each one of the above-mentioned levels can be turned on and off, including the custom times. You can also choose between plotting just the opening price, a vertical line separator, or both! All of these lines have adjustable styles (dotted, dashed or solid) and width.
They also have custom cut offs. You may choose specific cut off times for custom time slots (when to stop extending the lines), as well as for AM (before noon) default levels and PM (after noon) default levels.
The indicator also allows to show text labels next to these lines, which is set by default but can be turned off. Custom times also include custom text options.

ICT opening price lineShows you the opening price of a certain time of day. I will show as line starting from the time selected and ending a few bars into the future. Available times are the ones ICT said are relevant for framing a premium and discount using opening prices: 00:00, 8:30 and 13:30. To show all 3 you have to add the indicator 3 times.
The script offers some customization on how the line should look line and if you want a label telling the time of it after the line.

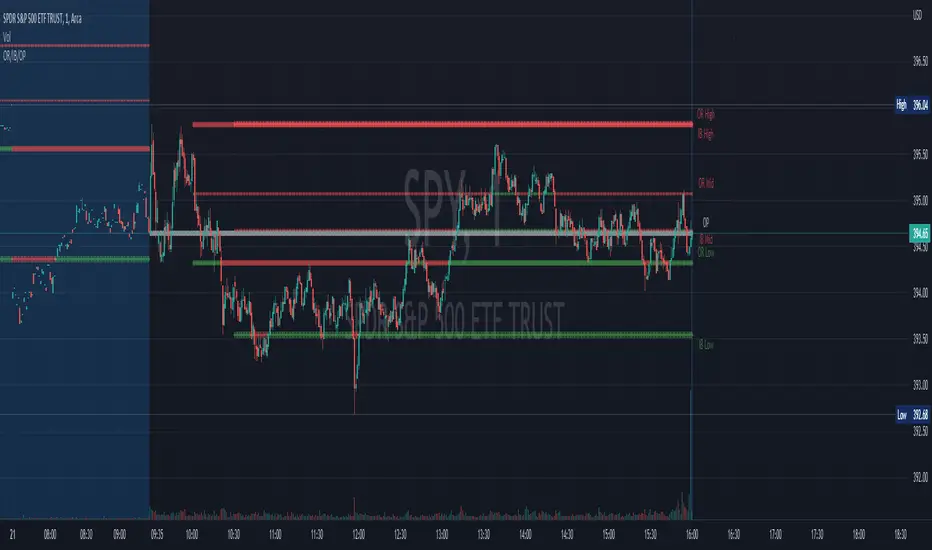
Opening Range, Initial Balance, Opening PriceThis script draws Opening Range, Initial Balance and Opening Price with options to show mid levels.
By default, lines changes color depending on whether closing price is above or below the lines. Red if price is below, green if price is above.
Colors and line styles are all configurable.
Options to change label positions.
Some definitions:
Opening Range - The opening range is high and low for a given period after the market opens. This period is generally the first 30 or 60 minutes of trading
Initial Balance - WRT to TPO profile chart, the Initial Balance is the price range resulting from the market’s trade during the first two 30 minute periods of the regular trading hours session.
Why is this useful?
The first hour of the trading day is the most active and dynamic period. The price range defined by this period of trading creates some key support / resistance levels for the rest of the day. Example below: