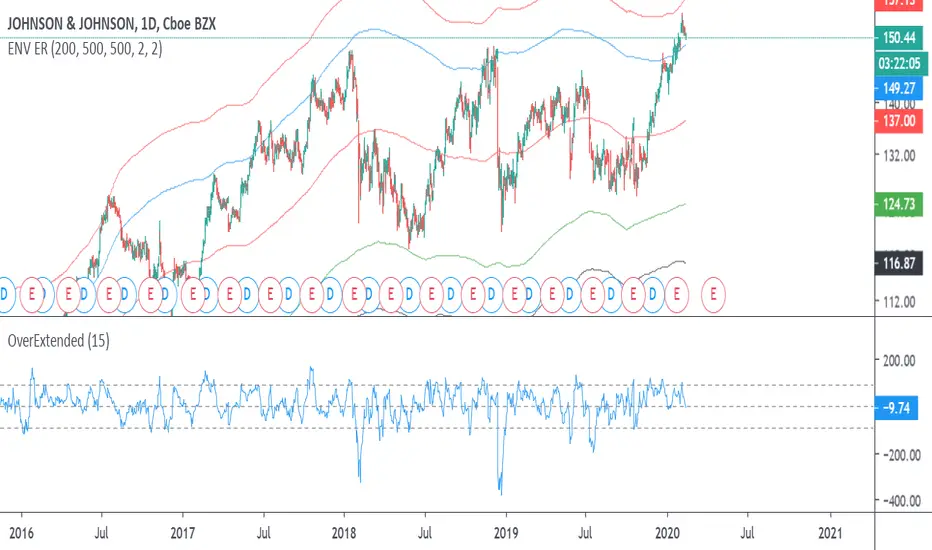
Overextension Oscillator [by DanielM]The Overextension Oscillator is an indicator that detects when a market move has extended significantly beyond its typical range, signaling potential areas for a correction or reversal. Unlike traditional oscillators that rely on fixed overbought/oversold levels, this tool dynamically adjusts its thresholds based on historical swing high and swing low movements.
By analyzing all swing points on the chart, the indicator determines the expected range of price movements and identifies when the price extends beyond normal levels. Since every asset has different price behavior and volatility, swing lengths may vary from asset to asset, ensuring that overextension is measured relative to each market's historical price behavior.
How It Works
1️⃣ Swing Detection & Data Collection
The indicator scans all available swing highs and swing lows on the chart to gather a complete dataset of past price fluctuations.
It records the percentage differences between swings to determine how much price typically moves in a given market.
2️⃣ Overextension Calculation
Using the stored swing data, the indicator calculates:
Average Swing Difference – Measures the average percentage difference between swings.
Average Move Percentage – Determines the typical magnitude of price moves within a trend cycle.
These values are used to create dynamic overextension thresholds that adjust based on historical data.
3️⃣ Price Distance & Overextension Measurement
The indicator calculates the distance between the current price and the closest historical swing point. If this distance exceeds the predefined threshold based on past swings, the move is considered overextended. The greater the deviation, the higher the probability of a pullback or short-term reversal.
4️⃣ Buy/Sell Signal Generation
A Buy signal is generated when the price has dropped below an overextended threshold relative to a past swing low.
A Sell signal is generated when the price has risen beyond an overextended threshold relative to a past swing high.
These signals indicate that the price has reached a level where it historically tends to slow down or reverse.
Overextended

LOKEN (v4) BULLISH SMART MONEYThis indicator is based on Smart Money MCDX
(Pine editor @v4)
Indicator built for cryptocurrencies.
Best for day trading.
The coin seems overbought but still pump? Check this indicator
This indicator help you see when institutional buyer enter/exit trade and is a good combination with RSI + Stochastic RSI .
This indicator focus on buying activity by big players and is built for LONG or SPOT, shorter can still use it to determine when to exit short (if smart money appear on a significant TF you may not enter/stay in a short).
Banker plot show strong buyer activities (appear generally when RSI already overbought but still increasing).
It appear as a Histogram with a color code to better see the fading strength of the institutional activity :
Light Blue Bar = Institutional presence ( bullish )
Green Bar = Pump candle (very bullish ), (Banker > Banker MA)
Orange Bar = Retest candle = natural decline after a growth (Banker < Banker MA)
Black Bar = Down candle = progressive exit of institutional leads to this candle, you must have TP before.
Red Bar = Dump candle = steep decline, the institutional take profit hard. You better be out before that one.
Hot-Money plot show momentum and react fast to price action.
It appear as a filled zone (red or green) depending on the plot position compared to its average.
In a downtrend you may only see this one.
Key-Signals:
"Bullish signal 𓃓" = open a long
"Sell signal 💲" = close the long
I recommend you don't keep all the signals enabled at first.
(feel free to ask me the use of the other signals)
It seemed to me that SMART MONEY MCDX was counter-intuitive and archaic,
So i made this one for personal use,
I'm happy if this indicator helps you,
Have a good trade

Dual Mean Reversion Channel (adjusted lower band)This is a public and open-source lighter version compared to the "Overextended Price Channel" which is provided complimentaty to the Trend Insight System.
Introduction :
Channels are very useful tools to assess overextended price, volatility and upcoming retracement or impulsive moves (such as Bollinger Band squeezes). It is an indispensable addition to any trader using Mean Reversion theory for a scalp-trade or swing-trade.
This script contains :
- 2 channels Keltner-style, using the True Range for volatility
- customizable volatility (channel width) and smoothing period
- a standard selection of moving average ; SMA, EMA, VWMA
- an embedded readjustment of the lower bands to avoid the drop on a logarithmic scale (see explanation below)
Why another channel indicator ?
I have found most conventional channels to be either not based on "proper" volatility (e.g. standard deviation of price action for Bollinger Band), or the bottom channel to be ill adapted to the logarithmic scale and plunges to 0 on some high volatility periods, messing with readability on logarithmic auto-scaled chart.
Also, I find the channels to be most useful when superimposed with another one of longer length; especially a pair of channels with a 50 and 200 period moving average respectively. Mean Reversion traders that mostly trade the 50 and 200 SMA/EMA know what I am talking about as having a channel helps to have a better visual for a proper of entry and exit point.
Disclaimer :
This indicator was originally intended to be used along with the Trend Insight System to improve performance, and the default configuration mostly backtested on BTCUSD.
Please use with caution, proper risk management and along with your favorite oscillator, candlestick reading and signals system.
Some explanation :
Based on Mean Reversion paradigm, everything has a tendency to revert back to the mean :
- when the price enters the upper channel, it is supposed to be (or start getting) overbought as the market is getting overheated, thus prone to correction,
- on the other hand, when the price enters the lower channel, it is supposed to be (or getting) oversold and the market looks favorable for a buy-in.
Depending on the trading style used, a trader will usually either wait until the price leaves the channel towards the mean before taking action (conservative style) or you will set limit orders inside the channel as you expect a reversion to the mean (more agressive/risky style).
With two channels, more complex (and maybe precise) rules can be built to optimize one's trading strategy.
Important notes :
In the end, sticking with 50/200 length and a single setting on volatility might be wiser, be wary of overoptimization which is risky at best and counter productive at worst (according to legendary traders such as Mark Douglas). Even if, needless to say, the volatility needs to be adjusted between a nascent and volatile market (such as crypto) compared to standard call markets that are much less volatile.
End notes :
It will always be considered a work in progress to help bring out the best of trading with channels, any comment and suggestion are welcomed.