• Produits
  • Communauté
  • Marchés
  • Courtiers
  • Plus
Commencez
  • Communauté
  • /Indicateurs et stratégies
  • /Oversold-oscillators

Oversold-oscillators

RSI Multi TF strategy The RSI is a very popular indicator that follows price activity. It calculates an average of the positive net changes, and an average of the negative net changes in the most recent bars, and it determines the ratio between these averages. The result is expressed as a number between 0 and 100. Commonly it is said that if the RSI has a low value, for example, 30 or under, the symbol is oversold. And if the RSI has a high value, 70 for example, the symbol is overbought. 
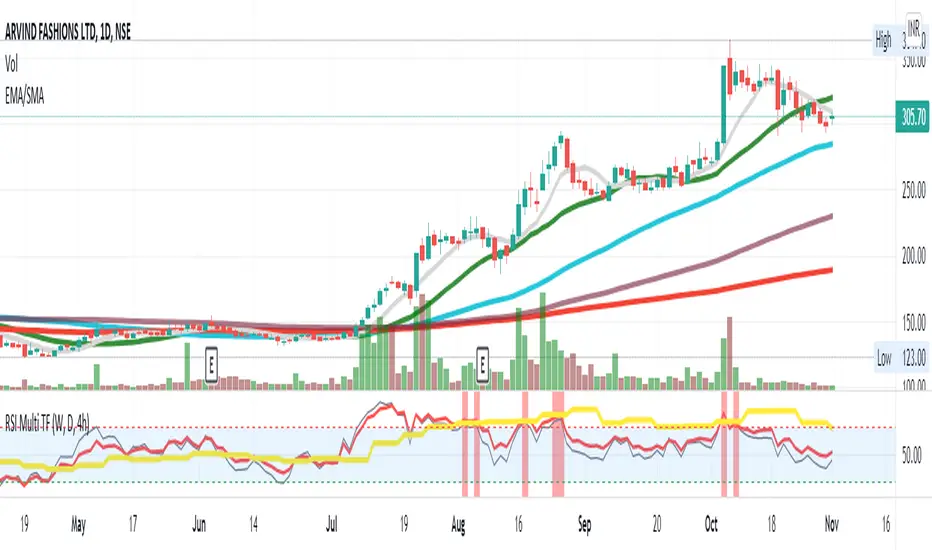
Plots 3 RSI (Weekly, Daily, 4h) at the same time, regardless of the Chart Timeframe. Highlights in green (or red) if all RSI is oversold (or overbought). Can trigger custom oversold and overbought alerts when all 3 lines grey(4h), yellow(weekly), and red(daily) go in the oversold or overbought zone. The strongest the curves break the barrier the strongest the alert (vertical red and green bars) shows.
Indicateur Pine Script®
par anaryan
Overbought Oversold IndicatorOverbought Oversold Indicator
Indicateur Pine Script®
par ceyhun
Mis à jour
5252
Colored Williams %RThis script is the same as Williams %R except that on green days we plot green and red on red days. If a bar opens and closes the same, we plot black.
Indicateur Pine Script®
par worldsapart89

Sélectionnez les données de marché fournies par ICE Data Services. Sélectionnez les données de référence fournies par FactSet. Copyright © 2025 FactSet Research Systems Inc.Copyright © 2025, American Bankers Association. Base de données CUSIP fournie par FactSet Research Systems Inc. Tous droits réservés. Documents déposés auprès de la SEC et autres documents fournis par Quartr.© 2025 TradingView, Inc.

Plus qu'un produit
  • Supercharts
Screeners
  • Actions
  • ETFs
  • Obligations
  • Crypto coins
  • Paires CEX
  • Paires DEX
  • Pine
Cartes thermiques
  • Actions
  • ETFs
  • Crypto
Calendriers
  • Economie
  • Bénéfices
  • Dividendes
Plus de produits
  • Courbes de rendement
  • Options
  • Flux d'actualités
  • Pine Script®
Apps
  • Mobile
  • Desktop
Communauté
  • Réseau social
  • Mur d'Amour
  • Parrainer un ami
  • Règlement
  • Modérateurs
Idées
  • Trading
  • Éducation
  • Choix de la rédaction
Pine script
  • Indicateurs & stratégies
  • Wizards
  • Freelancers
Outils & Abonnements
  • Fonctionnalités
  • Tarifications
  • Données boursières
Trading
  • Vue d'ensemble
  • Courtiers
Offres spéciales
  • Contrats à terme de CME Group
  • Contrats à terme Eurex
  • Paquet d'actions US
Au sujet de l'entreprise
  • Qui nous sommes
  • Mission spatiale
  • Blog
  • Carrières
  • Kit media
Merch
  • Boutique TradingView
  • Cartes de tarot pour les traders
  • Le C63 TradeTime
Politiques & Sécurité
  • Conditions d'utilisation
  • Clause de non-responsabilité
  • Politique de confidentialité
  • Politique en matière de cookies
  • Déclaration d'accessibilité
  • Conseils de sécurité
  • Programme de chasse aux bugs
  • Page du statut
Solutions pour les entreprises
  • Widgets
  • Bibliothèques de graphiques
  • Lightweight Charts™
  • Graphiques avancés
  • Plateforme de trading
Opportunités de croissance
  • Publicité
  • Intégration de courtiers
  • Programme de partenariat
  • Programme éducatif
Communauté
  • Réseau social
  • Mur d'Amour
  • Parrainer un ami
  • Règlement
  • Modérateurs
Idées
  • Trading
  • Éducation
  • Choix de la rédaction
Pine script
  • Indicateurs & stratégies
  • Wizards
  • Freelancers
Solutions pour les entreprises
  • Widgets
  • Bibliothèques de graphiques
  • Lightweight Charts™
  • Graphiques avancés
  • Plateforme de trading
Opportunités de croissance
  • Publicité
  • Intégration de courtiers
  • Programme de partenariat
  • Programme éducatif
Look FirstLook First