Cantillon Clean Moving Averages [Free]Overview Standard Moving Averages are static. The Cantillon Clean MA is dynamic. It automatically changes color based on price interaction, giving you an instant visual read on the trend health of the Short (20), Medium (50), and Long (200) term flows.
Features
Dynamic Coloring: Green when Bullish, Red when Bearish.
Smart Weighting: Uses Exponential Moving Averages (EMA) to react faster than standard SMAs.
Crossover Signals: Subtle "X" markers when the short-term trend flips.
Want the Real Institutional Trend? Moving averages lag. To track the True Institutional Cost Basis (Anchored VWAP) and statistical reversal points, you need the Cantillon Terminal .
Indicateurs et stratégies

MSP Multi-Timeframe Trend & Momentum DashboardMulti-Timeframe Trend, Momentum, and Bias Dashboard
This indicator provides a multi-timeframe overview by evaluating several technical conditions across multiple timeframes simultaneously.
Its purpose is to help traders assess alignment or divergence between higher and lower timeframes before making trading decisions.
Rather than generating standalone signals, the dashboard summarizes trend, momentum, participation, and trend-strength metrics into a compact visual table.
What the Indicator Evaluates (Per Timeframe)
Each selected timeframe is analyzed independently using:
Trend context
Price position relative to fast and slow moving averages
Momentum
RSI position relative to user-defined thresholds
Directional confirmation
MACD line relative to its signal line
Participation
Current volume compared to its recent average
Trend strength
ADX value to distinguish trending from non-trending conditions
These components are combined to form a directional bias assessment for each timeframe.
Dashboard Overview
The dashboard displays:
Directional bias per timeframe
Aggregate bias across all selected timeframes
Momentum and trend readings
Relative volume strength
Trend-strength values
Alignment status when multiple timeframes agree
This allows users to quickly identify whether market conditions are aligned, mixed, or conflicting across timeframes.
Visual Encoding
Cells within the table are color-coded to improve readability:
Bullish bias
Bearish bias
Neutral or mixed conditions
Color intensity reflects relative strength, helping distinguish weak alignment from stronger confluence.
Optional chart-level visuals can highlight periods of broad alignment or disagreement across timeframes.
Customization Options
Users may adjust:
Timeframes included in the dashboard
Thresholds for momentum, volume, and trend strength
Table size, position, and visual appearance
Alert conditions based on alignment criteria
These settings allow the indicator to be adapted to different instruments, timeframes, and trading styles.
Intended Use
Style: Multi-timeframe analysis and confirmation
Markets: Forex, crypto, equities, index futures
Purpose:
Assess higher-timeframe bias
Improve directional context before entries
Avoid trades against broader trend conditions
The indicator is most useful as a contextual filter, rather than a standalone decision tool.
Important Notes
This script is provided for educational and analytical purposes only.
It does not predict price movement and should be used alongside independent analysis and appropriate risk controls.


Cantillon Risk Calculator [Free]Overview Stop guessing your position size. The Cantillon Risk Calculator is a lightweight utility that instantly tells you exactly how many units (Contracts/Coins) to buy based on your account size and risk percentage.
How to Use
Open Settings.
Enter your Account Size (e.g., $10,000) and Risk % (e.g., 1%).
Type in your Stop Loss price.
The table instantly shows your Position Size.
Looking for High Probability Setups? Risk management is only half the battle. To find where to enter using Institutional Order Blocks and Sigma Bands, you need the Cantillon Terminal .


@tom_w777 Turtles Systems with 2N marks//// @tom_w777
//// 2 systems from the Turtles trading system, including S1 and S2 2N marks for the drawbacks to enter an existing trend
//// data to program it taken from the book : "the complete turtle trader" from Michael W. COVEL
/////////

Long Position (Manual Setup)BINANCE:BTCUSDT
This script is for long position setup manually....
Just enter the following data ......
1. higher entry price
2. lower entry price
3. stop loss price
4. targets ( up to 5 targets)
5- extra targets ( up to 3 extra targets)
then you will have the long position draw in the chart with the trade summary including risk and reward percentage.

SMA MAD Trend [Alpha Extract]A sophisticated trend identification system that combines Simple Moving Average with Mean Absolute Deviation methodology to create adaptive Super Trend-style bands with advanced strength filtering and gradient visualization. Utilizing ADX-based trend strength validation and slope analysis for signal quality enhancement, this indicator delivers institutional-grade trend detection with dynamic ATR-based ribbon visualization and comprehensive strength measurement. The system's dual-filter architecture eliminates false signals during weak or choppy market conditions while maintaining sensitivity to genuine trend establishment and reversal events.
🔶 Advanced SMA-MAD Band Construction
Implements innovative Mean Absolute Deviation calculation around Simple Moving Average baseline to create volatility-adaptive bands with ratcheting logic for trend persistence. The system calculates MAD by measuring absolute price deviations from the mean, then applies configurable multipliers to generate upper and lower bands that adjust to changing market conditions while preventing premature band violations.
// Core SMA-MAD Framework
SMA_Value = ta.sma(close, SMA_Length)
Mean = ta.sma(close, MAD_Length)
Abs_Deviation = abs(close - Mean)
MAD_Value = ta.sma(Abs_Deviation, MAD_Length)
// Adaptive Bands
Upper_Band = SMA_Value + MAD_Factor * MAD_Value
Lower_Band = SMA_Value - MAD_Factor * MAD_Value
🔶 Intelligent Dual-Filter System
Features comprehensive trend validation using ADX strength measurement and slope analysis to eliminate low-conviction signals during ranging or consolidating markets. The system calculates normalized slope strength using ATR scaling and combines with ADX threshold analysis, generating filtered trend states that distinguish genuine trends from temporary price fluctuations.
🔶 Dynamic Trend Strength Engine
Implements sophisticated strength calculation combining slope intensity and ADX readings to produce normalized 0-100% strength scores with gradient colour intensity modulation. The system normalizes slope by minimum threshold and ADX by configurable level, multiplying factors to create composite strength measurement that drives visual feedback intensity across all indicator elements.
🔶 Super Trend-Style Direction Logic
Utilizes classic Super Trend methodology adapted for SMA-MAD bands, where trend direction flips occur on opposite band violations with persistent state maintenance. The system tracks previous band levels with ratcheting behaviour that adjusts bands only when price movement or new calculations warrant changes, preventing oscillation during normal volatility.
🔶 ATR-Based Ribbon Visualization
Provides dynamic ribbon overlay using ATR-scaled width around the trend line with opacity modulation based on trend strength for intuitive conviction assessment. The system creates upper and lower ribbon bounds at configurable ATR multiples, filling the channel with gradient-adjusted transparency that increases during strong trends and fades during weak conditions.
🔶 Multi-Dimensional Visual Architecture
Provides complete chart integration through trend line overlay, ATR ribbon fills, candle colouring, background glow, and transition signal labels with configurable visibility toggles. The system enables traders to customize display density from minimal (trend line only) to comprehensive (all visual elements) while maintaining consistent colour scheme and strength-based intensity across components.
🔶 Slope Strength Validation
Calculates ATR-normalized slope over configurable lookback periods to measure trend line momentum and filter sideways price action. The system compares absolute slope against minimum threshold requirements, preventing trend signals when price movement relative to the trend line lacks sufficient directional conviction regardless of band position.
🔶 Signal Generation Framework
Generates trend change signals when filtered direction state transitions from bearish to bullish or vice versa, with label placement and alert integration. The system implements state persistence that maintains previous trend until both ADX and slope filters confirm directional change, reducing whipsaw signals while capturing genuine reversals with minimal lag.
🔶 Performance Optimization Framework
Utilizes efficient calculation methods with optimized variable management and configurable parameters for balance between responsiveness and stability. The system includes intelligent state tracking with NA handling for initial bars and smooth gradient calculations that maintain performance across extended historical periods and real-time updates.
This indicator delivers sophisticated trend identification through Mean Absolute Deviation methodology combined with dual-strength filtering for superior signal quality. Unlike traditional Super Trend indicators that rely solely on ATR bands, the SMA-MAD approach uses statistical deviation measurement while incorporating ADX strength and slope validation to eliminate false signals during choppy conditions. The system's gradient-based visual feedback, ATR ribbon visualization, comprehensive dashboard, and multi-dimensional filtering make it essential for traders seeking reliable trend-following approaches with clear conviction measurement across cryptocurrency, forex, and equity markets. The combination of adaptive bands, strength-based transparency, and intelligent filtering creates an institutional-grade trend system suitable for systematic trading strategies.

Custom EMA/SMA Ribbon [TheScalpingAnt]Overview
Custom EMA/SMA Ribbon is a premium market trend framework designed to simplify trend recognition, improve timing, and provide clearer structure during both trending and corrective environments. Unlike traditional moving-average indicators, this ribbon focuses on visual clarity, hierarchy, and actionable interpretation — delivering institutional-style trend information directly on your chart.
It is engineered for traders who demand reliability, precision, disciplined decision support, and a clean visual experience without laggy oscillators or noisy signals.
Core Concepts
This indicator is built on three fundamental professional trading concepts:
Trend Structure
Multiple layered moving averages allow traders to instantly understand whether the market is aligned, compressing, transitioning, or breaking down.
Hierarchy & Visual Priority
Short-term MAs are always plotted in front of longer-term averages. This ensures decision-critical structures remain visible and readable, even during market volatility.
True Trend Validation (Not Slope Noise)
Color logic is based on structural dominance rather than temporary slope changes.
A line turns bullish only when it is above the next slower MA, and bearish when below it.
This prevents misleading color flips, maintains logical consistency, and improves confidence in interpretation.
Key Features
• Selectable EMA or SMA mode
• 6-layer ribbon trend architecture
• Correct priority stacking (MA1 always front → MA6 always back)
• Professional bullish / bearish dominance color logic
• Clean and readable premium visual design
• Works on crypto, forex, stocks, and indices, any market.
• Zero repainting
• Lightweight and highly efficient performance
This ensures instant clarity whether trading intraday or analyzing macro market structure.
Customization
Users retain full analytical power and flexibility without losing structure:
• Choose EMA or SMA
• Fully configurable MA lengths
• Individual line style (solid, dashed, dotted)
• Independent line thickness per MA
• Works seamlessly on any symbol and timeframe
This makes the ribbon suitable for swing traders, intraday traders, position traders, and strategy/system builders.
Usage Guidance
This ribbon functions as a market regime detector and structural trend guide, not a simple “buy/sell” tool.
Common professional use cases:
• Identify trend continuation vs structural breakdown
• Confirm market alignment before entering positions
• Validate pullbacks without losing macro perspective
• Avoid trading against dominant bias
• Detect accumulation, consolidation, and expansion phases
Interpretation logic
• Green alignment → structured bullish trend environment
• Red alignment → structural weakness / bearish regime
• Compression → potential volatility, transition, or trend shift area
Example Interpretation
Bearish → Bullish transition example:
• Shorter MAs recover first
• They cross back above slower averages
• Each line turns green only when structural control is truly regained
• A fully green staircase indicates confirmed bullish trend structure
During pullbacks:
Price may retrace, but if hierarchy remains intact, the ribbon stays green — preventing unnecessary panic exits.
Only when structural dominance truly breaks does the ribbon shift red, warning traders to reduce exposure, re-evaluate bias, or reposition.
Settings (Defaults & Logic)
Default optimized configuration:
• Lengths: 10 / 20 / 50 / 100 / 150 / 200
• Type: EMA
• Styles: Solid
• Thickness: 2
Users may customize thickness, style, and calculation type without losing conceptual integrity.
Conclusion
The Custom EMA/SMA Ribbon delivers:
• Higher clarity
• Reduced chart noise
• Stronger confidence in execution
• Superior trend comprehension
• A disciplined, structured trading perspective
Built for serious traders, this tool transforms raw market movement into clear structural intelligence.
Disclaimer
This indicator is a technical analysis tool for educational and analytical purposes only. It does not guarantee profits, does not constitute financial advice, and should not be used as the sole decision-making method. Trading involves risk; users remain responsible for their decisions.

ICT Precision Turtle Soup NuNi1. Identify the CRT Range (The Context)
Before looking for a trade, the indicator defines the Candle Range Theory (CRT) boundaries based on your lookback period.
CRT High (Red Line): Represents old buy-side liquidity.
CRT Low (Green Line): Represents old sell-side liquidity.
HTF Filter: The code ensures the higher timeframe trend (e.g., 4H) aligns with your direction. Only look for Buys if the HTF trend is bullish.
2. The Manipulation (Turtle Soup 🐢)
Wait for price to move outside the CRT boundaries.
The Trap: Price must sweep below the CRT Low or above the CRT High.
The Reclaim: A Turtle Body Soup (TBS) occurs when the candle body closes back inside the range, or a wick rejection happens.
Symbol: A 🐢 icon will appear on the chart. Do not entry yet. This is just a warning that a setup is forming.
3. The Shift & Momentum (The Trigger)
To ensure a high-probability entry, the indicator waits for two technical confirmations:
MSS (Market Structure Shift): Price must break the most recent swing high (for Buys) or swing low (for Sells).
Displacement: The breaking candle must be "displaced"—meaning it has a large, energetic body compared to previous candles. This proves that big banks/institutions are moving the price.
4. The Entry Execution
Once all conditions are met, the "⭐ PRECISION ENTRY" label will appear.
Execution: You can enter at the market price when the label appears.
Retest Entry: Alternatively, look for the price to return to the IFVG or Breaker Zone (the shaded box) drawn by the indicator for a more refined entry.

TP & SL Indicator [TheScalpingAnt]
Overview
TP & SL Levels Clean is a precision trade-management tool designed to instantly plot professional-grade Take Profit and Stop Loss levels directly on your chart. Whether you are scalping, swing trading, or managing high-risk execution, this indicator removes guesswork by automatically calculating your SL and up to three configurable TP targets, displaying them with clean price labels on the right side of the chart.
This tool is built for traders who demand clarity, discipline, and execution accuracy.
Core Concepts
This indicator is designed around three key trading principles:
• Risk Management First
A clearly defined Stop Loss is essential in every professional trading strategy. The indicator ensures your SL is always visible and precise.
• Structured Profit Taking
Instead of randomly exiting trades, the tool delivers predefined TP targets to support scaling out and disciplined exits.
• Clean Visual Execution
Levels are displayed with bold lines and price tags, ensuring immediate readability without cluttering the chart.
LONG and SHORT trading directions are fully supported, ensuring it fits any trading style and asset class.
Key Features
• Automatically plots:
o Entry price level
o Stop Loss level
o TP1 (mandatory)
o TP2 (optional)
o TP3 (optional)
• Works for:
o LONG & SHORT positions
• Adjustable percentages for:
o SL %
o TP1 %
o TP2 %
o TP3 %
• Toggle ON/OFF visibility for TP2 & TP3
• Clean professional design
• Smart decimal precision based on instrument price
• Stable drawing logic using only the latest bar (no historical clutter)
• Precise price labels aligned on the right side of the chart
• Customizable line width
• Lightweight, fast, and optimized for performance
Customization & Flexibility
The indicator allows full personalization to match your trading strategy:
• Manually set Entry Price or let the indicator auto-detect from current price
• Choose Trade Direction: LONG or SHORT
• Define your exact:
o Stop Loss %
o Take Profit % levels
• Enable or disable TP2 and TP3 depending on your strategy
• Adjust line thickness
• Automatically adjusts price label decimal formatting for Forex, Crypto, Indices, and Stocks
This gives you total flexibility to adapt the tool to scalping, day trading, swing trading, or long-term positioning.
How to Use
1. Apply the indicator to your chart
2. Set:
o Entry Price (or leave 0 for automatic detection)
o Trade Direction (LONG / SHORT)
3. Define SL %, TP1 %, and optionally TP2 & TP3 %
4. Enable TP2 / TP3 toggles if needed
5. The indicator instantly plots:
o Entry line
o Stop Loss line
o Take Profit levels
6. Trade with visual confidence knowing your execution levels are clearly defined
Example Use Case
A trader plans a LONG position at 1.20000.
They configure:
• SL = -1.20%
• TP1 = +0.90%
• TP2 = +0.90% (optional)
• TP3 = +0.90% (optional)
The indicator immediately displays:
• Entry Reference Level
• Stop Loss Zone
• Profit Targets
This gives the trader an instant, structured trading framework without manual calculations, improving discipline and execution speed.
Settings Breakdown
Inputs:
• Entry Price (0 = auto)
• Trade Direction (LONG / SHORT)
• Stop Loss %
• TP1 %
• TP2 %
• TP3 %
• Toggle ON / OFF TP2
• Toggle ON / OFF TP3
• Line Width
• Built-in intelligent decimal formatting
Visuals:
• Bold colored levels
• Clear labels with precise price values
• Transparent clean UI
• Optimal spacing for visibility
Conclusion
TP & SL Levels Clean is built for serious traders who understand that consistent profitability comes from structured execution, not emotions. By combining clarity, flexibility, and professional visualization, this indicator helps you manage trades with precision and confidence.
If you are looking to simplify your workflow, improve discipline, and present professional execution management on your charts, this tool is for you.
Disclaimer
This indicator does not provide financial advice or guaranteed profits. It is a technical tool designed to support trade planning and execution. Trading involves risk, and users should always conduct their own analysis and manage risk responsibly

Michael Mor - ATRMichael Mor -ATR is a clean, lightweight chart watermark that gives you key stock context at a glance — without cluttering your chart or covering price action.
It’s designed for traders who want essential fundamentals + recent performance visible directly on the chart, in a subtle, professional style.
What it shows
You can toggle each line on or off:
Company name (optional market cap: M / B / T)
Symbol & timeframe
Sector & industry
ATR (14) with percentage of price and a quick volatility indicator
🟢 low volatility
🟡 medium volatility
🔴 high volatility

Intraday Institutional Buy/Sell Detector (5 Min) + AlertsWorks with O=L daily 5 min candle within first 20 mins of market opening

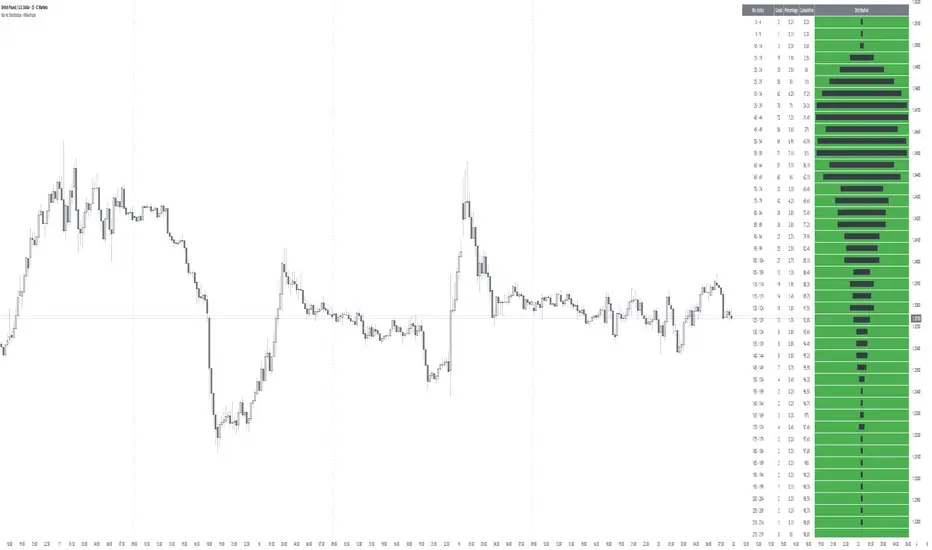
Bar HL Distribution - XWiseTradeBar HL Distribution - XWiseTrade
Analyze the distribution of High-Low ranges over the last N bars.
This indicator groups candle ranges (in ticks) into bins and displays:
• Count per bin
• Percentage and cumulative %
• Visual histogram bars
Perfect for understanding typical volatility, setting realistic targets/stops, and spotting unusual bar sizes.
Features:
• Adjustable lookback and bin size
• Clean table with truncation warning
• Lightweight and always up-to-date
More premium indicators and strategies coming soon at:
xwisetrade.com
Be Wise. Trade X.
CRT 4H-DAY (Candle Range Theory)CRT 4H-DAY (Candle Range Theory) is a clean, price-based analytical tool designed to help traders contextualize market structure across multiple time horizons.
The indicator highlights key reference levels derived from recent market ranges and visualizes them directly on the chart in a minimal, non-intrusive way.
Its purpose is to improve spatial awareness of price behavior rather than generate direct trading signals.
CRT Trading is built for discretionary traders who prefer to combine contextual levels with their own analysis, price action, and risk management rules.
Key characteristics:
Multi-timeframe contextual reference levels
Clean and customizable visual layout
Works across crypto, forex, indices, and stocks
Designed for intraday and swing analysis
No repainting
No buy/sell signals
No future data usage
This indicator does not provide financial advice and should be used strictly as a supplementary analytical tool.
This indicator is for educational and analytical purposes only.
It does not provide trading signals or investment advice.
All trading decisions remain the sole responsibility of the user.

Real VWAP - XWiseTradeTrue volume-weighted average price using aggregated lower timeframe data.
This indicator calculates a custom VWAP by aggregating any number of lower timeframe candles (e.g., 30 x 1min bars), providing a more responsive and accurate mean than standard session VWAP.
Features:
• Custom lower timeframe and aggregation count
• Selectable price source (HL2, HLC3, OHLC4)
• Weighted standard deviation bands (1-3σ)
• VWAP value label
Ideal for intraday mean reversion, deviation trading, and dynamic support/resistance.
More premium indicators and strategies coming soon at:
xwisetrade.com
Be Wise. Trade X.
