Smart Risk - Three Institutional Models📘 Smart Risk – Three Institutional Entry Models
A precision-engineered institutional framework that blends liquidity, structure, and multi-time-frame confirmation.
🧠 Concept Overview
The Smart Risk indicator models how institutional traders and algorithms engineer entries around liquidity, imbalance, and structural shifts .
It unifies t hree distinct institutional entry models —each built around core Smart Money Concepts (SMC)—and enhances them with a Multi-Time-Frame Confluence (MTF) engine for directional alignment.
This tool doesn’t simply merge indicators.
It connects l iquidity sweeps, order-block reactions, breaker validation, and fair-value-gap mitigation into one cohesive trading logic—filtering every setup through trend, structure, and volume confirmation.
⚙️ How It Works
Setup #1 – Liquidity Sweep + Order Block Revisit + FVG Mitigation
Identifies engineered stop-hunts where price sweeps external liquidity and returns to a prior Order Block or Fair Value Gap (FVG).
Signals reversal-style entries with high probability of mean-reversion or mitigation.
Setup #2 – Supply/Demand + Mitigation / Breaker / FVG Continuation
Captures continuation trades inside trending structure.
When trend bias (via moving-average context) aligns with breaker or mitigation blocks, signals confirm institutional continuation sequences.
Setup #3 – Sweep + Classic FVG Reaction
Tracks clean displacement gaps following a liquidity sweep—ideal for scalpers and intraday reversals where imbalances act as magnets for price.
Each setup can be independently enabled or disabled from the panel.
A built-in signal-cooldown prevents repetitive triggers on the same leg.
🕒 Multi-Time-Frame Confluence
The new MTF module aligns lower-time-frame precision entries with higher-time-frame market structure.
When enabled, each setup only validates if the HTF trend confirms the same directional bias as the LTF pattern—e.g. a 5-minute bullish FVG signal requires a bullish 1-hour structure.
This ensures institutional logic respects global liquidity flow and avoids counter-trend traps.
MTF Controls:
• ✅ Enable MTF Confluence toggle
• ⏱️ Lower Time-Frame (LTF) selector (default 5 min)
• ⏱️ Higher Time-Frame (HTF) selector (default 1 hour)
• 🔄 Automatic SMA-based HTF trend detection
🎨 Visualization & Dashboard
• Order Block / Supply–Demand Zones — highlight institutional footprints
• Fair Value Gaps (FVGs) — reveal displacement inefficiencies
• Liquidity Sweeps (X / $) — mark engineered stops
• BOS & CHoCH — confirm structure continuation or reversal
• Compact Dashboard — live “Armed” state for each setup and MTF bias
Color-coded background cues emphasize active trade phases without clutter.
🧩 Core Algorithm Highlights
• Dynamic swing and pivot structure detection
• Breaker / Mitigation / Volume confirmation filters
• Fair-Value-Gap logic with directional alignment
• Cooldown control for signal throttling
• Multi-Time-Frame bias filter for contextual precision
⸻
📈 How to Use
1. Apply indicator to any asset or timeframe.
2. Select which institutional setups you want active.
3. Optionally enable MTF Confluence (5 min → 1 hr recommended).
4. Wait for BOS/CHoCH confirmation + zone alignment before entry.
5. Use OB and FVG zones for entry/exit planning with risk management.
⸻
💡 Originality Statement
This script introduces a multi-layered institutional logic engine that merges liquidity, mitigation, and imbalance behavior into a unified framework—augmented with time-frame synchronization and signal-cooldown management.
All logic, calculations, and visualization structure were built from scratch for this model.
It is not a mash-up of existing public indicators and offers measurable analytical value through MTF-aware trade validation.
⸻
⚠️ Disclaimer
This tool is intended for educational and analytical purposes only.
It does not provide financial advice or guaranteed trading outcomes.
Always back-test, validate setups, and apply proper risk management.
Services Pine

Tide Aigo Labs SMCI'm not immediately familiar with "Tide Aigo Labs SMC." Could you provide more context about what you're looking for? For example:
Are you asking about a company or organization?
Is this related to a product, service, or technology?
Are you looking for contact information, company details, or something else?
What industry or field is this in?
With a bit more information, I'll be better able to help you find what you're looking for, or I can search the web if this is a specific entity you'd like me to research.

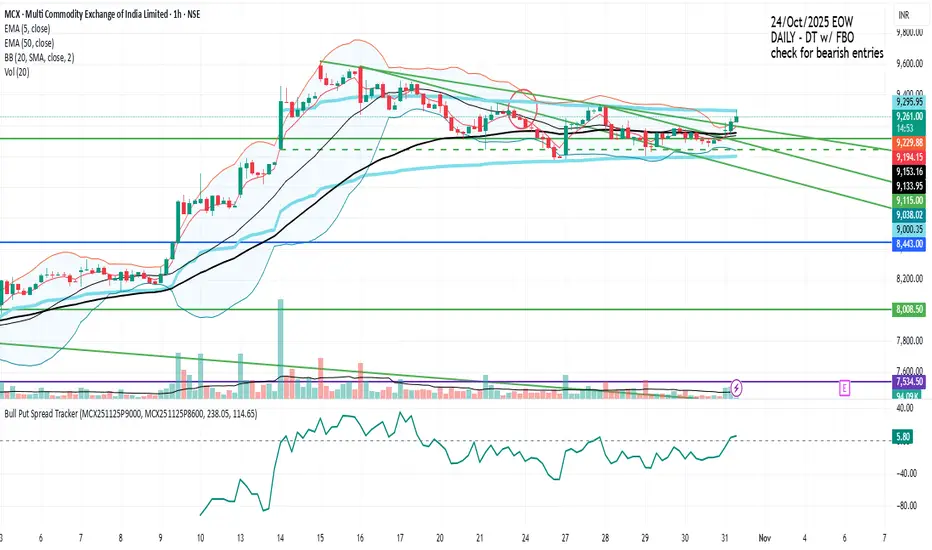
Bull Put Spread TrackerScript that will add an indicator (like MACD/RSI) to the chart.
Manually need to enter: Symbol names for the spread legs & the entry prices
Info Box⚙️ Purpose
Shows useful trade and event-related data such as:
% Distance from stop levels (D, DH)
Earnings countdown in bars
All displayed in a single floating info box (table) on the chart.
📋 Key Features
Customizable Display
Choose table position (Top Right, Bottom Center, etc.)
Choose table size (Auto, Large, Tiny, etc.)
Custom text and background colors
Metrics Shown
D: % Distance from stop (difference between close and low/high)
DH: % Distance from midpoint of the candle
Earnings Countdown: Number of bars until next earnings event
Conditional Styling
If earnings are within 3 bars, text color turns red as a warning.
Execution Conditions
Runs only on daily timeframe
Updates on last bar only (no historical clutter)
Output
Displays all selected metrics in one line, separated by “×”
e.g. → D: -2.1% × 5 × DH: 1.4%
🧩 Overall Function
Creates a clean, customizable “info box” showing trade distances and upcoming earnings countdown for quick decision-making directly on your TradingView chart.

Lot Size Calculator - Gold🥇 Lot Size Calculator for Gold (XAU/USD)
Description:
A professional and accurate lot size calculator specifically designed for Gold (XAU/USD) trading. This indicator helps traders calculate the optimal position size based on account balance, risk percentage, and stop loss distance, ensuring proper risk management for every trade.
Key Features:
Accurate Gold Calculations - Properly accounts for Gold pip values ($10 per pip for standard 100oz lots)
Multi-Currency Support - Works with USD, EUR, and GBP account currencies
Flexible Contract Sizes - Supports Standard (100 oz), Mini (10 oz), and Micro (1 oz) lots
Customizable Decimal Places - Display lot sizes with 2-8 decimal precision (no rounding)
Clean Visual Design - Modern, professional info panel with gold-themed styling
Adjustable Display - Position panel anywhere on chart with customizable colors and sizes
Real-Time Calculations - Instantly updates as you adjust your risk parameters
How It Works:
The calculator uses the standard forex position sizing formula optimized for Gold:
Lot Size = Risk Amount / (Stop Loss in Pips × Pip Value Per Lot)
For Gold (XAU/USD):
Standard Lot (100 oz): 1 pip = $10
Mini Lot (10 oz): 1 pip = $1
Micro Lot (1 oz): 1 pip = $0.10
Settings:
Account Settings:
Account Balance: Your trading capital
Account Currency: USD, EUR, or GBP
Risk Percentage: How much to risk per trade (default: 2%)
Contract Size: 100 oz (Standard), 10 oz (Mini), or 1 oz (Micro)
Display Currency: Choose how to display risk amounts
Trade Settings:
Stop Loss: Your SL distance in pips
Display Settings:
Label Position: Top/Bottom, Left/Right, Middle Right
Label Size: Tiny to Huge
Decimal Places: 2-8 decimals
Custom Colors: Background, text, and accent colors
Perfect For:
Gold (XAU/USD) day traders and swing traders
Position sizing and risk management
Traders using fixed percentage risk models
Anyone trading Gold CFDs or spot markets
Scalpers to long-term Gold investors
What Makes This Different:
Unlike generic lot size calculators, this tool correctly calculates Gold's pip values based on contract size. Many calculators get this wrong, leading to incorrect position sizing. This indicator ensures you're always trading the right lot size for your risk tolerance.
Example Usage:
Account Balance: $10,000
Risk: 1% = $100
Stop Loss: 60 pips
Contract Size: 100 oz (Standard)
Result: 0.1667 lots (exact, no rounding)
Perfect for maintaining consistent risk management in your Gold trading strategy!

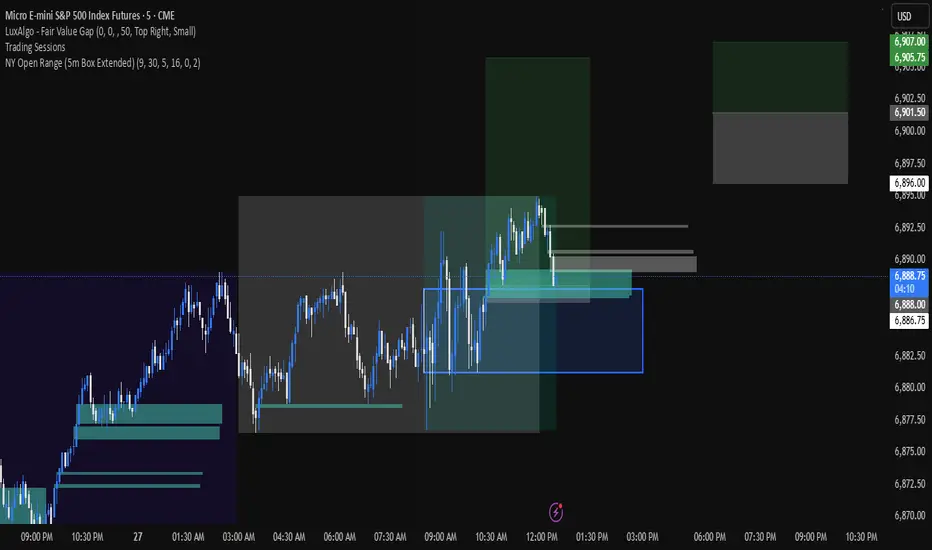
NY Open 5 minute Range (5m Box Extended)Draws a box around the first 5 minute candle for the New York session.
Auto Option Premium Viewer - csgnanamThat's a great idea! Clear documentation is key for anyone using your script. Since your selected code block is the dedicated space for documentation, I'll provide an explanation tailored for that context, covering the main features of your "Auto Option Premium Viewer" Canvas.
Here is a detailed explanation of the script's core functionality, which you can use in your Canvas description or in a separate document to help users understand it.
I will not edit the Canvas itself, as you requested a separate explanation.
***
### Explanation of the "Auto Option Premium Viewer" Canvas
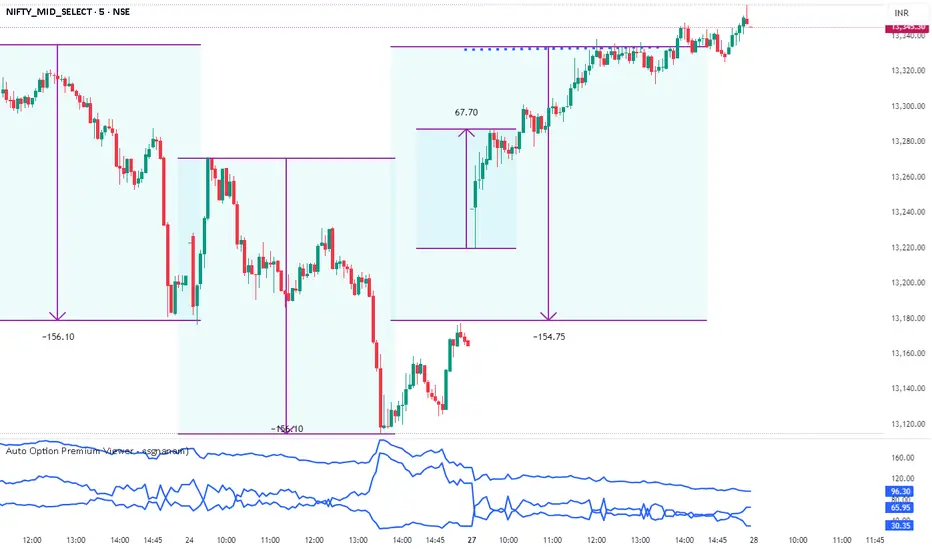
This Pine Script indicator, **"Auto Option Premium Viewer — Full Auto Symbols (NSE format, improved detection),"** is designed to automatically fetch and display the At-The-Money (ATM) Call and Put option premiums for major NSE indices (NIFTY, BANKNIFTY, MIDCPNIFTY, FINNIFTY) in real-time.
The primary goal is to provide a single, clean chart overlay showing the total premium (CE + PE) for the options closest to the current spot price, without requiring the user to manually enter strike prices or steps.
#### 1. Automatic Index Detection (`AUTO` Functionality)
* **Smart Underlying Detection:** The script attempts to automatically detect the index you are currently viewing (`activeUnderlying`). For example, if your chart is set to `BANKNIFTY`, the indicator automatically focuses on Bank Nifty options.
* **Spot Ticker Mapping (The Fix):** To accurately find the spot price, the script uses a helper function (`getSpotTicker`) to map the common index name (like `FINNIFTY`) to the specific underlying ticker required by TradingView (like `CNXFINANCE` or `NIFTY_MID_SELECT`). This ensures accurate price referencing for ATM calculation across all indices.
#### 2. Fully Automated Strike & Step Sizing
* **No Base Strike Inputs:** The script dynamically calculates the At-The-Money (ATM) strike price based on the live spot price of the underlying index.
* **Fixed Strike Steps:** The strike increment (`current_step`) is hardcoded based on market conventions:
* **100:** NIFTY, BANKNIFTY, FINNIFTY
* **50:** MIDCPNIFTY
* **Dynamic ATM Calculation:** The live spot price is rounded to the nearest valid strike based on the correct step size. This automatically determines the central strike (B), along with the adjacent strikes (A and C) to ensure the fetched data is always relevant.
#### 3. Data Fetching and Display
* **Symbol Construction:** The `buildSymbol` function creates the exact NSE option symbol string (e.g., `NSE:NIFTY251028C26000`) required by the `request.security` function.
* **Option Price Request:** The script uses `request.security` to fetch the closing price (`close`) of the Call and Put options for the three relevant strikes (A, B, C) on a fixed **5-minute** timeframe (`dataTF`).
* **Plots:** The indicator displays three lines on the chart's lower panel:
1. **ATM CE Premium:** The price of the Call option closest to ATM.
2. **ATM PE Premium:** The price of the Put option closest to ATM.
3. **ATM Total Premium:** The sum of CE + PE, often used as a proxy for the minimum expected range or implied volatility.
This automatic setup makes the Canvas extremely efficient for quick analysis without needing to manually adjust any numerical settings.
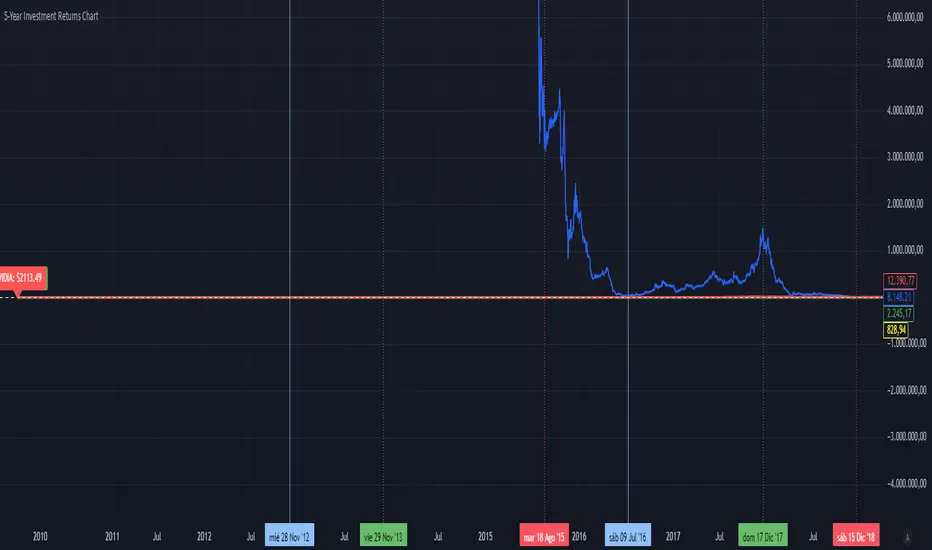
5-Year Returns Chart BTCvsSPXvsGOLDvsNVDACompare between thes 4 assets:
BTC
NVDA
SPX
GOLD
With an initial 1000$ investment in the last 5 years each return
Enhanced Level Breakout Strategy ProEnhanced Level Breakout Strategy Pro — Executive Summary
Level-driven breakout engine with single-position governance, three staged targets, and live USD/INR currency awareness. It operationalizes last session levels and swing structure to generate actionable entries only when price confirms and volume validates.
What it does
Surfaces breakouts of previous day and previous week high/low/open/close.
Confirms with optional volume expansion.
Enters one position at a time. Manages SL + TP1/TP2/TP3 and auto-expires after time.
Tracks outcomes and KPIs, including a rolling 30-day dashboard.
Auto-detects INR vs USD charts and handles live USD/INR conversion for capital displays.
How trades are found
Levels
Uses completed prior Daily and Weekly OHLC as reference rails.
Breakout up: close > prior high/open/close.
Breakout down: close < prior low/open/close.
Volume filter (optional)
Current volume > 20-SMA(volume) × threshold.
Swing context (visual only)
Marks most recent 3–4-bar swing high/low to show nearby structure.
Entry logic
Long if any daily/weekly upside breakout confirms on the closed bar and volume filter passes.
Short if any downside breakout confirms with the same gating.
Single-trade mode by default. You can allow new trades before completion if required.
Risk model and exits
Stop-loss
Long: min(low , low )
Short: max(high , high )
Targets
TP1 = 1.5R, TP2 = 2R, TP3 = 3R.
Hitting TP3 implies TP2 and TP1 are counted as achieved.
Time exit
Force close after 50 bars if no TP/SL.
Labels/lines
Entry, SL, TP1/2/3 plotted only while the trade is active.
Capital and currency enablement
Initial Capital and Risk % per trade drive the on-chart capital panel.
Auto-detects chart currency (INR for NSE/BSE tickers, else USD).
Live USD/INR pull with fallback to manual rate.
Shows position size (float units), investment amount, and risk amount in the selected display currency.
On-chart UX
Level rails
Daily levels on the left (custom color).
Weekly levels on the right (custom color).
Swing tags: SH / SL at the latest swing points.
Signal markers: Entry labels on the confirmation bar.
Two tables
Performance (top-right): trades, win rate, average P/L, TP1/2/3 hit counts and accuracies, 30-day counts and average TP profits, SL stats, configuration flags.
Capital (bottom-left): capital, risk/trade, position size, investment, stop distance, R:R set, conversion rate and source.
KPIs tracked
All-time: total trades, win rate, average P/L, TP1/TP2/TP3 accuracy and average profit, SL accuracy.
Last 30 days: number of trades hitting TP1/TP2/TP3 or SL, plus average TP1/TP2/TP3 profit across those hits.
Configuration levers
Currency: Auto / INR / USD, live or manual USD/INR rate.
Components: toggle daily/weekly levels and entry generation.
Swing: lookback 2–10, show/hide.
Risk: initial capital, risk % per trade.
Filters: volume on/off and threshold.
Display: TP/SL lines, labels, transparent tables, one-trade policy, wait-for-completion.
Styling: independent colors and thickness for daily/weekly/swing levels.
Governance and constraints
One active position unless you opt out.
Entries trigger on bar close to avoid repaint.
Level references are always previous completed sessions.
Arrays capped to manage memory; stats keep recent history efficiently.
Operating procedure
Select timeframe. Add to chart.
Set capital and risk %. Confirm currency mode.
Optional: enable volume filter and set threshold.
Monitor left/right level rails. Trade fires on confirmed breaches.
Manage optional discretion using swing markers and stop distance readout.
Review top-right KPIs for continuous improvement. Iterate thresholds as needed.
Tips
Use higher timeframes for fewer but higher-quality signals.
Keep volume filter on during trend days to avoid weak breaks.
For INR equities, prefer AUTO currency with Live conversion enabled for cleaner dashboards.
If you scale manually, keep single-trade mode enabled to avoid overlapping signals.

Support & Resistance Zones + FVG**Overview:**
This tool automatically identifies **key support and resistance levels** and highlights **Fair Value Gaps (FVGs)** on the chart. It helps traders of all levels **visualize important price areas**, spot potential market reactions, and make better-informed trading decisions.
Support and resistance zones are areas where price tends to **reverse, stall, or accelerate**, making them essential for entries, exits, and stop-loss placement. Fair Value Gaps represent rapid price movements that leave temporary imbalances, which often act as **future targets or reversal points**. Together, these features provide a **comprehensive view of market structure**.
---
## Features:
1. **Automatic Support & Resistance Detection:**
* Detects zones based on recent price action patterns:
* **Bull-to-Bear transitions** → resistance zones
* **Bear-to-Bull transitions** → support zones
* Dynamically calculates **zone heights** based on recent candle ranges, adapting to market volatility.
2. **Broken Zones & Proximity Alerts:**
* Highlights zones that have been broken, helping traders **focus on relevant levels**.
* Optional proximity alerts indicate broken zones that are **near the current price**, showing potential retests.
3. **Fair Value Gaps (FVGs):**
* Detects bullish and bearish gaps automatically.
* Options to **ignore narrow gaps** and **remove fully crossed FVGs**.
* Acts as a guide for potential **price targets or reversal areas**.
4. **Clean Chart & Customization:**
* Hides overlapping or invalid zones to reduce clutter.
* Fully adjustable inputs, including:
* Zone length
* Lookback range
* Zone height multiplier
* FVG extension
* Display and opacity settings
5. **Timeframe-Independent:**
* Works on **any chart interval**, from scalping to long-term swing charts.
---
## How It Helps Traders:
* **Identify Key Levels Automatically:**
Visualizes areas where the price has historically reacted. These zones act as **natural barriers** guiding entries and exits.
* **Spot Broken Zones:**
Broken zones may lose significance but could act as **future retest points**, helping assess trend continuation or reversal.
* **Visualize Price Gaps (FVGs):**
Gaps left by rapid price movement often act as **price magnets**, providing potential targets or reversal points.
* **Reduce Noise:**
Automatically hides overlapping or invalid zones for a **cleaner, easier-to-read chart**, highlighting only the most significant levels.
* **Adaptable to Any Trading Style:**
Useful for **swing trading, intraday trading, or scalping**, showing where buyers and sellers are most active.
---
## Practical Usage Guide:
1. **Enable Support & Resistance Zones:**
* Visualize critical price levels.
* Adjust **zone length, lookback range, and height multiplier** to fit your trading style and volatility.
2. **Enable FVGs:**
* Highlights gaps created by rapid price movements.
* Customize **minimum gap size, extension, and filtering options** to reduce chart noise.
3. **Observe Price Reactions:**
* **Bounce at support:** Potential buy opportunity.
* **Reversal at resistance:** Potential sell/short opportunity.
* **Breakout:** Watch for price breaking a zone for trend continuation trades.
4. **Risk Management:**
* Place stop-loss orders just outside zones to protect trades.
* Use broken zones as **profit targets** or areas to tighten stops.
5. **Trend Analysis:**
* Understand where buyers and sellers are concentrated.
* Identify strong trends by observing multiple zones being respected or broken.
6. **Multi-Timeframe Application:**
* Apply on different timeframes to **align short-term entries with longer-term structure**, improving trade probability.
---
## Key Inputs & Customizations:
* **Support & Resistance Zones:**
* Show/Hide Zones
* Zone Length Extend (bars)
* Loopback Range (bars)
* Zone Height Multiplier
* Hide Overlapped Zones
* Hide Broken Zones
* Ignore Last N Candles for Break Check
* Show Proximity Broken Zones
* Proximity Range for Broken Zones
* **Fair Value Gaps (FVGs):**
* Show/Hide FVGs
* Extend FVGs (bars)
* Minimum FVG Size
* Ignore Narrow FVGs
* Ignore Fully Crossed FVGs
* Up and Down Colors with Opacity
---
**Summary:**
This indicator saves **time, improves chart clarity, and highlights key market levels**. It is suitable for beginners who want to **understand market structure visually**, as well as experienced traders seeking **precise entry, exit, and target zones**. By combining support/resistance detection with Fair Value Gaps, it provides a **complete visual guide to price behavior**, helping traders make **more confident and informed decisions**.

Kelly Wave Position Matrix 20251024 V1 ZENYOUNGA simple table is designed for use when opening a position. It applies the Kelly formula to calculate a more scientific position size based on win rate and risk–reward ratio. At the same time, it displays 1.65× ATR stop-loss levels for both long and short positions to serve as a reference for comparing with existing stop-loss placements.
Additionally, the table back-calculates the corresponding position size based on a 2% total capital loss limit, using the actual loss ratio. It also shows the current wave trend status as a pre-filtering condition.
Overall, this table integrates the core elements of trading — trend (wave confirmation), win rate, risk–reward ratio, and position sizing — making it an effective checklist before entering a trade. Its purpose is to help achieve a probabilistic edge and ensure positive expected value in trading decisions.

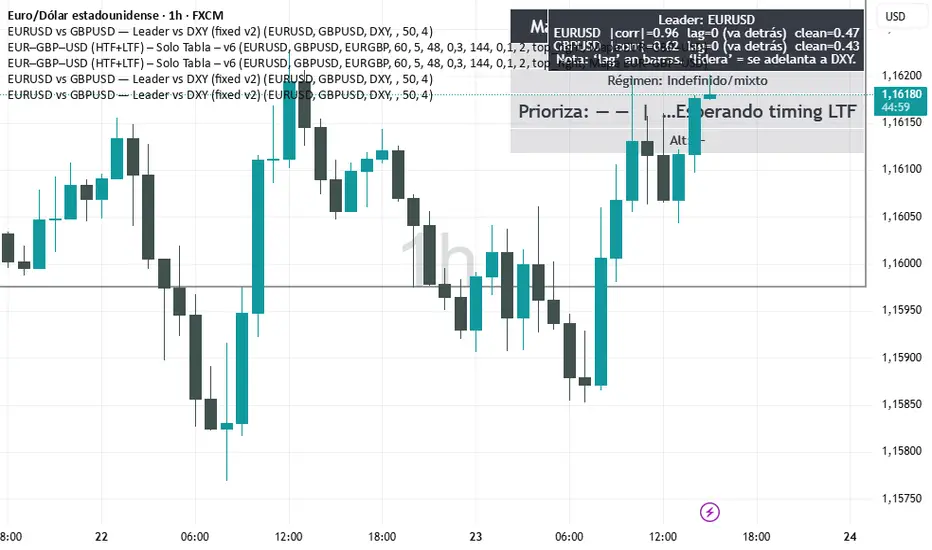
EURUSD vs GBPUSD — Alexio Script que muestra que par es más fuerte entre GBP y EUR vs USD en un rango determinado.
Name of tickerDescription:
This indicator displays the instrument’s ticker symbol and the current chart timeframe at the top center of the chart.
Features:
• Shows the ticker (e.g., BTCUSDT, AAPL, etc.).
• Displays the current timeframe (1m, 5m, 1H, 1D, etc.).
• Positioned at the top center of the chart for easy reference.
• Transparent background for minimal interference with price action.
• Lightweight and simple, no extra settings required.
Usage:
• Works with any instrument: stocks, crypto, futures.
• Useful for traders who want to always see the ticker and timeframe while analyzing the chart.
Settings:
• Text size can be adjusted in the script (text_size).
• Text and background colors can be customized (text_color, bgcolor).

Multi-Entry Position SizerMulti-Entry Position Sizer (with Risk, Margin & Tables)
This tool is designed for traders who manage multiple staggered entries (scaling in) with fixed risk allocation. It calculates position sizes, margin requirements, and liquidation levels for up to 5 custom entry points, based on a defined stop loss and wallet risk.
🔧 Features
Entry Management
Supports up to 5 entries.
Use 0 to ignore an entry, -1 to auto-use current price.
Valid entries are drawn as colored dashed lines.
Invalid entries (e.g., entry on wrong side of stop loss) are flagged with red dotted lines and labels.
Risk Control
Risk defined in Direct USDT or % of wallet size.
Risk automatically split across all valid entries.
Per-entry quantity and margin calculated dynamically.
Visualization
Stop loss line in red.
Liquidation levels drawn as faded dotted lines.
Entry labels show price and required margin in USDT.
Summary table (top-right) with symbol, side, risk, SL, leverage.
Entries table (bottom-right) listing each valid entry with:
Price
Quantity
Margin in USDT
Risk/entry in USDT
Liquidation level
Alerts
Alerts trigger when price touches a valid entry.
Separate alert for stop loss hit.
📊 How to Use
Select Side (Long or Short).
Enter your Wallet Size, Risk Parameters, and Leverage.
Define your Stop Loss Price.
Configure up to 5 Entry Points.
0 = disabled
-1 = current market price
Any positive value = custom entry price
Watch tables and chart update automatically:
Invalid entries turn red (ignored in sizing).
Valid entries show correct margin and liquidation prices.
✅ Who Is It For?
Traders who scale in with multiple orders.
Traders who want precise risk per trade.
Anyone who needs to see margin requirements and liquidation prices before placing orders.
⚠️ Disclaimer:
This script is for educational purposes. It does not place orders automatically and should not be considered financial advice. Always double-check calculations with your exchange before trading.

Major Trading Sessions IndicatorsThis indicator displays vertical lines on your chart to mark the opening times of the major global trading sessions (Tokyo, Shanghai/HK, London, and New York). As a crypto trader I want to find price action patterns after sessions open.
It's fully customizable and extendable (you could add closing time for sessions as well)
Works best on short timeframes.
Features:
6 configurable vertical lines (4 preset for major sessions + 2 custom)
Each line shows a customizable label (e.g., "Tokyo", "London")
Individual time and color settings for each line
UTC offset for each line to handle Daylight Saving Time
Option to fix all labels at a specific price level for cleaner appearance (need to set and save it for each chart, it becomes a mess if you don't). Default behavior and limit of Pine Script is that it will be attached to the price wick.
Default Sessions:
Tokyo: 00:00 UTC (midnight)
Shanghai/HK: 01:30 UTC
London: 08:00 UTC (winter) - adjust offset to +1 for summer
New York: 13:00 UTC (winter) - adjust offset to -4 for summer
DST Adjustments:
Simply change the UTC offset when daylight saving time begins/ends:
London: 0 (winter) or +1 (summer)
New York: -5 (winter) or -4 (summer)
Lines extend from top to bottom of the chart and appear precisely when each session opens.
My preferred configuration: shorten names and reduce opacity of colors to 20-30%.

Realtime RenkoI've been working on real-time renko for a while as a coding challenge. The interesting problem here is building renko bricks that form based on incoming tick data rather than waiting for bar closes. Every tick that comes through gets processed immediately, and when price moves enough to complete a brick, that brick closes and a new one opens right then. It's just neat because you can run it and it updates as you'd expect with renko, forming bricks based purely on price movement happening in real time rather than waiting for arbitrary time intervals to pass.
The three brick sizing methods give you flexibility in how you define "enough movement" to form a new brick. Traditional renko uses a fixed price range, so if you set it to 10 ticks, every brick represents exactly 10 ticks of movement. This works well for instruments with stable tick sizes and predictable volatility. ATR-based sizing calculates the average true range once at startup using a weighted average across all historical bars, then divides that by your brick value input. If you want bricks that are one full ATR in size, you'd use a brick value of 1. If you want half-ATR bricks, use 2. This inverted relationship exists because the calculation is ATR divided by your input, which lets you work with multiples and fractions intuitively. Percentage-based sizing makes each brick a fixed percentage move from the previous brick's close, which automatically scales with price level and works well for instruments that move proportionally rather than in absolute tick increments.
The best part about this implementation is how it uses varip for state management. When you first load the indicator, there's no history at all. Everything starts fresh from the moment you add it to your chart because varip variables only exist in real-time. This means you're watching actual renko bricks form from real tick data as it arrives. The indicator builds its own internal history as it runs, storing up to 250 completed bricks in memory, but that history only exists for the current session. Refresh the page or reload the indicator and it starts over from scratch.
The visual implementation uses boxes for brick bodies and lines for wicks, drawn at offset bar indices to create the appearance of a continuous renko chart in the indicator pane. Each brick occupies two bar index positions horizontally, which spaces them out and makes the chart readable. The current brick updates in real time as new ticks arrive, with its high, low, and close values adjusting continuously until it reaches the threshold to close and become finalized. Once a brick closes, it gets pushed into the history array and a new brick opens at the closing level of the previous one.
What makes this especially useful for debugging and analysis are the hover tooltips on each brick. Clicking on any brick brings up information showing when it opened with millisecond precision, how long it took to form from open to close, its internal bar index within the renko sequence, and the brick size being used. That time delta measurement is particularly valuable because it reveals the pace of price movement. A brick that forms in five seconds indicates very different market conditions than one that takes three minutes, even though both bricks represent the same amount of price movement. You can spot acceleration and deceleration in trend development by watching how quickly consecutive bricks form.
The pine logs that generate when bricks close serve as breadcrumbs back to the main chart. Every time a brick finalizes, the indicator writes a log entry with the same information shown in the tooltip. You can click that log entry and TradingView jumps your main chart to the exact timestamp when that brick closed. This lets you correlate renko brick formation with what was happening on the time-based chart, which is critical for understanding context. A brick that closed during a major news announcement or at a key support level tells a different story than one that closed during quiet drift, and the logs make it trivial to investigate those situations.
The internal bar indexing system maintains a separate count from the chart's bar_index, giving each renko brick its own sequential number starting from when the indicator begins running. This makes it easy to reference specific bricks in your analysis or when discussing patterns with others. The internal index increments only when a brick closes, so it's a pure measure of how many bricks have formed regardless of how much chart time has passed. You can match these indices between the visual bricks and the log entries, which helps when you're trying to track down the details of a specific brick that caught your attention.
Brick overshoot handling ensures that when price blows through the threshold level instead of just barely touching it, the brick closes at the threshold and the excess movement carries over to the next brick. This prevents gaps in the renko sequence and maintains the integrity of the brick sizing. If price shoots up through your bullish threshold and keeps going, the current brick closes at exactly the threshold level and the new brick opens there with the overshoot already baked into its initial high. Without this logic, you'd get renko bricks with irregular sizes whenever price moved aggressively, which would undermine the whole point of using fixed-range bricks.
The timezone setting lets you adjust timestamps to your local time or whatever reference you prefer, which matters when you're analyzing logs or comparing brick formation times across different sessions. The time delta formatter converts raw milliseconds into human-readable strings showing days, hours, minutes, and seconds with fractional precision. This makes it immediately clear whether a brick took 12.3 seconds or 2 minutes and 15 seconds to form, without having to parse millisecond values mentally.
This is the script version that will eventually be integrated into my real-time candles library. The library version had an issue with tooltips not displaying correctly, which this implementation fixes by using a different approach to label creation and positioning. Running it as a standalone indicator also gives you more control over the visual settings and makes it easier to experiment with different brick sizing methods without affecting other tools that might be using the library version.
What this really demonstrates is that real-time indicators in Pine Script require thinking about state management and tick processing differently than historical indicators. Most indicator code assumes bars are immutable once closed, so you can reference `close ` and know that value will never change. Real-time renko throws that assumption out because the current brick is constantly mutating with every tick until it closes. Using varip for state variables and carefully tracking what belongs to finalized bricks versus the developing brick makes it possible to maintain consistency while still updating smoothly in real-time. The fact that there's no historical reconstruction and everything starts fresh when you load it is actually a feature, not a limitation, because you're seeing genuine real-time brick formation rather than some approximation of what might have happened in the past.

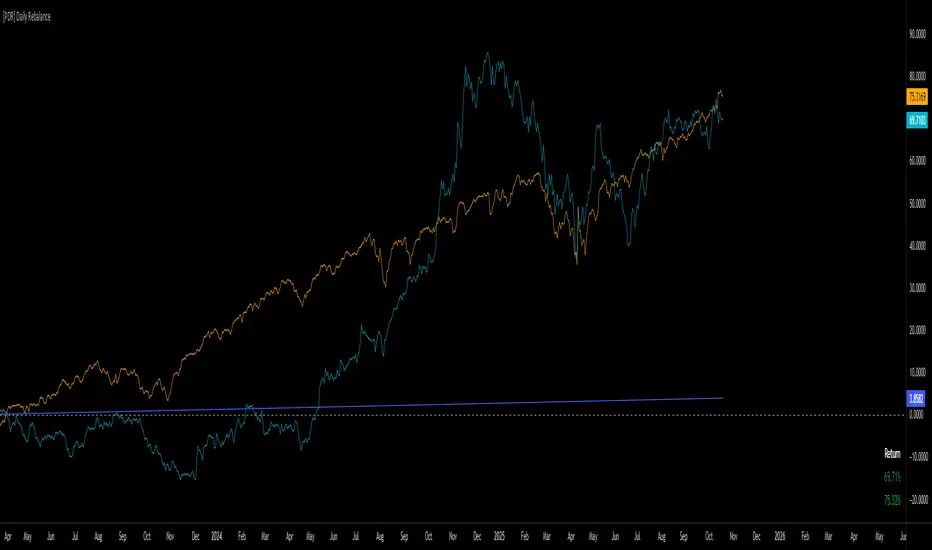
[PDR] Daily Rebalance█ OVERVIEW
This indicator is a powerful portfolio backtesting tool designed to simulate the performance of a static-weight, daily rebalancing strategy. It allows you to define a portfolio of up to 10 assets, set their target weights, and track its cumulative return against a user-defined benchmark and a risk-free rate.
The core of the script is its daily rebalancing logic, which calculates and logs every trade needed to bring the portfolio back to its target allocations at the close of each day. This provides a transparent and detailed view of how a static portfolio would have performed historically, including the impact of trading costs.
█ KEY FEATURES
Daily Rebalancing: Simulates a portfolio that is rebalanced at the close of every day to maintain target asset allocations.
Customizable Portfolio: Configure up to 10 different assets with specific weights. If all weights are left at 0, the script automatically creates an equal-weight portfolio from the selected assets.
Performance Comparison: Plots the portfolio's equity curve against a user-defined benchmark (e.g., SET:SET50 ) and a risk-free return, allowing for easy relative performance analysis.
Realistic Simulation: Accounts for trading costs like broker commission and minimum lot sizes for more accurate and grounded backtesting results.
Detailed Performance Metrics: An on-chart table displays real-time statistics, including Current Drawdown, Max Drawdown, and Total Return for both your portfolio and the benchmark.
Trade-by-Trade Logs: For full transparency, every rebalancing trade (BUY/SELL), including shares, price, notional value, and fees, is logged in the Pine Logs panel.
█ HOW TO USE
**Apply to a Daily Chart:** This script is designed to work exclusively on the daily ( 1D ) timeframe. Applying it to any other timeframe will result in a runtime error.
**Configure Settings:** Open the indicator's settings. Set your `Initial Capital`, `Start Time`, and the `Benchmark` symbol you wish to compare against.
**Define Your Assets:** In the 'Assets' group, check the box to enable each asset you want to include, select the symbol, and define its target `Weight (%)`.
**Set Trading Costs:** Adjust the `Broker Commission (%)` and `Minimal Buyable Lot` to match your expected trading conditions.
**Analyze the Results:** The performance curves are plotted in the indicator pane below your main chart. The key metrics table is displayed on the bottom-right of your chart.
**View Rebalancing Trades:** This is a crucial step for understanding the simulation. To see the detailed daily trades, you **must** open the **Pine Logs**. You can find this panel at the bottom of your TradingView window, next to the "Pine Editor" and "Strategy Tester" tabs. The logs provide a complete breakdown of every rebalancing action.
█ DISCLAIMER
This is a backtesting and simulation tool, not a trading signal generator. Its purpose is for research and performance analysis. Past performance is not indicative of future results. Always conduct your own research before making any investment decisions.
Blick Trades Position Size CalculatorThe Blick Trades Position Size indicator is a comprehensive Position Size Calculator designed for futures traders on TradingView. It automatically detects the asset type (Gold, Nasdaq, or ES futures - both regular and micro contracts) and calculates the optimal number of contracts to trade based on your risk amount and stop loss price.
The indicator features a "Maximize Risk" option that intelligently switches between regular and micro contracts to get as close as possible to your target risk amount, plus support for limit orders with custom entry prices. It displays visual elements on the chart including entry and stop loss lines with live risk calculations, and uses an asset-specific display system so you can control which charts show the indicator (preventing parameter confusion when switching between different futures contracts).
The calculator handles all the complex math automatically - just input your risk amount and stop loss, and it tells you exactly how many contracts to trade while showing your precise dollar risk in real-time.


N Order EMAThe exponential moving average is one of the most fundamental tools in technical analysis, but its implementation is almost always locked to a single mathematical approach. I've always wanted to extend the EMA into an n-order filter, and after some time working through the digital signal processing mathematics, I finally managed to do it. This indicator takes the familiar EMA concept and opens it up to four different discretization methods, each representing a valid way to transform a continuous-time exponential smoother into a discrete-time recursive filter. On top of that, it includes adjustable filter order, which fundamentally changes the frequency response characteristics in ways that simply changing the period length cannot achieve.
The four discretization styles are impulse-matched, all-pole, matched z-transform, and bilinear (Tustin). The all-pole version is exactly like stacking multiple EMAs together but implemented in a single function with proper coefficient calculation. It uses a canonical form where you get one gain coefficient and the rest are zeros, with the feedback coefficients derived from the binomial expansion of the pole polynomial. The other three methods are attempts at making generalizations of the EMA in different ways. Impulse-matched creates the filter by matching the discrete-time impulse response to what the continuous EMA would produce. Matched z-transform directly maps the continuous poles to the z-domain using the exponential relationship. Bilinear uses the Tustin transformation with frequency prewarping to ensure the cutoff frequency is preserved despite the inherent warping of the mapping.
Honestly, they're all mostly the same in practice, which is exactly what you'd expect since they're all valid discretizations of the same underlying filter. The differences show up in subtle ways during volatile market conditions or in the exact phase characteristics, but for most trading applications the outputs will track each other closely. That said, the bilinear version works particularly well at low periods like 2, where other methods can sometimes produce numerical artifacts. I personally like the z-match for its clean frequency-domain properties, but the real point here is demonstrating that you can tackle the same problem from multiple mathematical angles and end up with slightly different but equally valid implementations.
The order parameter is where things get interesting. A first-order EMA is the standard single-pole recursive filter everyone knows. When you move to second-order, you're essentially cascading two filter sections, which steepens the roll-off in the frequency domain and changes how the filter responds to sudden price movements. Higher orders continue this progression. The all-pole style makes this particularly clear since it's literally stacking EMA operations, but all four discretization methods support arbitrary order. This gives you control over the aggressiveness of the smoothing that goes beyond just adjusting the period length.
On top of the core EMA calculation, I've included all the standard variants that people use for reducing lag. DEMA applies the EMA twice and combines the results to get faster response. TEMA takes it further with three applications. HEMA uses a Hull-style calculation with fractional periods, applying the EMA to the difference between a half-period EMA and a full-period EMA, then smoothing that result with the square root of the period. These are all implemented using whichever discretization method you select, so you're not mixing different mathematical approaches. Everything stays consistent within the chosen framework.
The practical upside of this indicator is flexibility for people building trading systems. If you need a moving average with specific frequency response characteristics, you can tune the order parameter instead of hunting for the right period length. If you want to test whether different discretization methods affect your strategy's performance, you can swap between them without changing any other code. For most users, the impulse-matched style at order 1 will behave almost identically to a standard EMA, which gives you a familiar baseline to work from. From there you can experiment with higher orders or different styles to see if they provide any edge in your particular market or timeframe.
What this really highlights is that even something as seemingly simple as an exponential moving average involves mathematical choices that usually stay hidden. The standard EMA formula you see in textbooks is already a discretized version of a continuous exponential decay, and there are multiple valid ways to perform that discretization. By exposing these options, this indicator lets you explore a parameter space that most traders never even know exists. Whether that exploration leads to better trading results is an empirical question that depends on your strategy and market, but at minimum it's a useful reminder that the tools we take for granted are built on arbitrary but reasonable mathematical decisions.

NY Session Range Box with Labeled Time MarkersShows opening time ny session by timing with lines to inform traders to avoid 11:30am to 1:30pm for choppy sessions and mark early and power hour .

Colocar Ordens Fácil!This eases the process of creating limit orders on Trading View, when using the smarphone.
For that, the user inputs the given price range, the desired fibonacci entry level, and trade direction. The tools gives visual snap-to objects that can be used to lock long/short position tools, from which the option "create limit order" can be used to directly create the orders.
