Ta StrategyHello guys
This script follows traditional technical indicators
MACD, ADX, RSI and pivot points
If the price is above the resistance and the MACD has crossover ,and the RSI 14 is above 50
ADX is higher than 20, and DI+ is higher than DI-. This is a buy signal and vice versa for a sell signal
The script moves the stop loss to the entry price after the first target is reached
You can specify the quantity you want to sell when the price reaches the first target
There are also options like if you want the script to entry long or short, or both
you can reverse the strategy if it does not work well
If you want to inquire about any details, please let me know in the comments
Points pivots

Basic PRISM Algorithm [ByteBoost]The Basic ByteBoost PRISM strategy is designed to operate in various market conditions by leveraging the concept of brownian motion theory, which refers to the unpredictable movement of particles suspended in a fluid. This characteristic of random motion can be effectively utilized for analyzing time series data, such as market candles. Based on this notion, we are making the following assumptions regarding the market.
The stock price exhibits characteristics of Brownian motion.
The stock price is distributed in a log-normal pattern.
Volatility remains constant over time.
Options can only be exercised upon expiration.
Risk-free interest does not fluctuate over time.
There are no random or arbitrary opportunities present in the market.
Development Notes
This Strategy was developed with the PineScript language, version 5. This indicator, and most of the descriptions below, were derived largely from the TradingView reference manual. Feedback and suggestions for improvement are more than welcome, as well as recommended input settings and best practices to assist and guide new users effectively.
Features
The ByteBoost PRISM indicator is capable of analyzing multiple aspects of market behavior simultaneously such as:
Detection of potential trend reversals.
Assessment of trend strength and market sentiment.
Identification of stop loss levels.
Discovery of potential entry and exit points.
Ensuring compatibility and effectiveness with other indicators.
Visualization of strategy using historical data.
Strategy Description
PRISM is an all in one strategy that allows the visualization of entry and exit points as well as the historical performance for every set of parameters. PRISM is a slow paced indicator recommended for the 1h timeframe, because it operates on the belief that markets move in a Brownian motion, for which it leaves enough space and time for the market to decide a trend and catch it at the right time as well as finding appropriate exits given the trend.
PRISM can exist in either an uptrend or downtrend state, but it does not necessarily imply that it reflects the true trend being observed. Instead, it emphasizes capturing significant movements and capitalizing on them by utilizing oscillator levels and exit points calculated based on oversold or overbought values, along with the volatility associated with these movements.
Usage
To use this strategy it is first needed to select a correct set of inputs that correspond to the market you are using, the extra, win difference and oscillator length are dependent on the current market and the average price it manages, so these inputs need to be modified for every pair of assets used.
The long and short tags signify the opportune moment to initiate a new position in the market, whether it's a long or short position, respectively. The exit tags indicate when these positions should be closed. If no exits occur before a new long or short position emerges, it is essential to conclude the existing position and commence a new one in the opposite direction.
Regarding exits, up to two exits can be executed for each movement. The user has the flexibility to determine how these exits are utilized. In the input section, a specific percentage of equity can be selected to be sold during the first exit. If set to 100%, only a single exit will be presented. Otherwise, the remaining equity will be sold during the second exit or at the next trend reversal depending on which action occurs first.
In case the user requires additional exits beyond the initial two, the alternative exits option can be activated in the inputs. This will provide access to supplementary exits, although they may be less advisable compared to the primary exits.
Inputs / Settings
Capital - If using any leverage multiply the amount of money to invest by the leverage, else input the amount to be invested in every trade.
Start date - The date from which the strategy should begin its analysis. Leave unchanged to start from the earliest available date based on your account's plan.
End date - The date until which the strategy should conduct its analysis. Leave unchanged to continue until the current date.
Extra - The minimum gain required in the market to trigger an exit opportunity. It can be a negative number to allow exits at a loss, potentially minimizing losses.
First exit % - If an exit is decided to be partial, it is very likely that there will be a second exit, this parameter determines the percentage of equity to be sold at the first exit. Note that a second exit may not always be applicable.
Win difference - The minimum difference between the entry point and the first exit to determine whether it should be a full exit or a partial exit, as the exit price approaches the entry price, the probability of a trend reversal increases, a full exit is beneficial.
Oscillator - Enables or disables the main oscillator, which helps determine entry points. Not all assets may benefit from this parameter.
Oscillator length - Specifies the number of candles considered for the entry points oscillator.
Highlighter - Applies a light color between the trend and average price of each bar.
Labels - Displays all the labels on the chart indicating trends, positions and exits.
Candle color - Color codes the inside of the candles with the current signal.
Oscillator points - Adds visual dots to indicate when the oscillator has changed its trend.
Color uptrend - Determines the color scheme for identifying uptrend movements.
Color downtrend - Determines the color scheme for identifying downtrend movements.
Color long - Sets the color scheme for a new long position.
Color short - Sets the color scheme for a new short position.
Color exit - Decides the color scheme for the exit tag and cross shown.
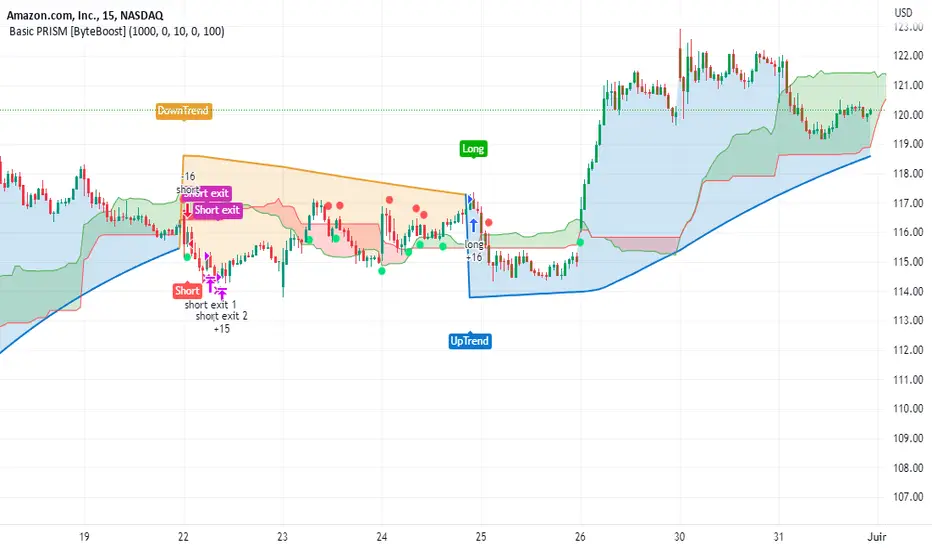
Indicator Visuals
The strategy plots the direction of the trend on the chart and changes its color based on this. It also plots shapes on the chart to denote potential buy (Long) and sell (Short) points, where the signals of short and long will appear as well as exit points which can be found as three different,
Exit 1 - A partial exit which sells the previously selected percentage of equity.
Exit 2 - A second exit that can only happen after an Exit 1 has happened, and sell the remaining amount of equity.
Exit Full - A full exit is executed when the price at the exit point is lower than the entry price plus the win difference value. This condition indicates that it is more advantageous to take a single exit rather than waiting for a second exit.
Strategy Alerts
The strategy does not include built-in alerts. However, alerts can be added using the TradingView interface based on the strategy's buy and sell conditions. This way you will be able to receive notifications on your computer or phone when a new signal goes out.
Details
Repainting: It is important to mention that the strategy can mark false long or short signals, as the oscillator is allowed to repaint on the same candle. So users must make sure the candle has closed on buy/sell conditions.
Excessive capital issue: If you configure the strategy with a big amount of capital (+$1,000,000 for example) it is possible that it will completely stop calculating exit signals, as they will be too big for TradingView’s engine to process.
Conclusion
The ByteBoost PRISM strategy empowers traders by providing comprehensive market analysis, clear entry and exit signals, and the ability to visualize strategy performance using historical data. It is a superior algorithm that maximizes profit potential and minimizes risks, making it the preferred choice for traders seeking a competitive edge in the financial markets.
Disclaimer
This strategy is provided as-is, with no guarantee of profits or responsibility for losses. Trading involves risk, and you should only trade with money you can afford to lose. Always conduct your own research and consider your financial situation before engaging in trading.
Premium PRISM Algorithm [ByteBoost]The ByteBoost PRISM strategy is designed to operate in various market conditions by leveraging the concept of brownian motion theory, which refers to the unpredictable movement of particles suspended in a fluid. This characteristic of random motion can be effectively utilized for analyzing time series data, such as market candles. Based on this notion, we are making the following assumptions regarding the market.
The stock price exhibits characteristics of Brownian motion.
The stock price is distributed in a log-normal pattern.
Volatility remains constant over time.
Options can only be exercised upon expiration.
Risk-free interest does not fluctuate over time.
There are no random or arbitrary opportunities present in the market.
Development Notes
This Strategy was developed with the PineScript language, version 5. This indicator, and most of the descriptions below, were derived largely from the TradingView reference manual. Feedback and suggestions for improvement are more than welcome, as well as recommended input settings and best practices to assist and guide new users effectively.
Features
The ByteBoost PRISM indicator is capable of analyzing multiple aspects of market behavior simultaneously such as:
Detection of potential trend reversals.
Assessment of trend strength and market sentiment.
Identification of stop loss levels.
Discovery of potential entry and exit points.
Ensuring compatibility and effectiveness with other indicators.
Visualization of strategy using historical data.
Customization options available.
Strategy Description
PRISM is an all in one strategy that allows the visualization of entry and exit points as well as the historical performance for every set of parameters. PRISM is a slow paced indicator recommended for the 1h timeframe, because it operates on the belief that markets move in a Brownian motion, for which it leaves enough space and time for the market to decide a trend and catch it at the right time as well as finding appropriate exits given the trend.
PRISM can exist in either an uptrend or downtrend state, but it does not necessarily imply that it reflects the true trend being observed. Instead, it emphasizes capturing significant movements and capitalizing on them by utilizing oscillator levels and exit points calculated based on oversold or overbought values, along with the volatility associated with these movements.
Usage
To use this strategy it is first needed to select a correct set of inputs that correspond to the market you are using, the extra, win difference and oscillator length are dependent on the current market and the average price it manages, so these inputs need to be modified for every pair of assets used.
The long and short tags signify the opportune moment to initiate a new position in the market, whether it's a long or short position, respectively. The exit tags indicate when these positions should be closed. If no exits occur before a new long or short position emerges, it is essential to conclude the existing position and commence a new one in the opposite direction.
Regarding exits, up to two exits can be executed for each movement. The user has the flexibility to determine how these exits are utilized. In the input section, a specific percentage of equity can be selected to be sold during the first exit. If set to 100%, only a single exit will be presented. Otherwise, the remaining equity will be sold during the second exit or at the next trend reversal depending on which action occurs first.
In case the user requires additional exits beyond the initial two, the alternative exits option can be activated in the inputs. This will provide access to supplementary exits, although they may be less advisable compared to the primary exits.
Inputs / Settings
Capital - If using any leverage multiply the amount of money to invest by the leverage, else input the amount to be invested in every trade.
Start date - The date from which the strategy should begin its analysis. Leave unchanged to start from the earliest available date based on your account's plan.
End date - The date until which the strategy should conduct its analysis. Leave unchanged to continue until the current date.
Extra - The minimum gain required in the market to trigger an exit opportunity. It can be a negative number to allow exits at a loss, potentially minimizing losses.
First exit % - If an exit is decided to be partial, it is very likely that there will be a second exit, this parameter determines the percentage of equity to be sold at the first exit. Note that a second exit may not always be applicable.
Win difference - The minimum difference between the entry point and the first exit to determine whether it should be a full exit or a partial exit, as the exit price approaches the entry price, the probability of a trend reversal increases, a full exit is beneficial.
Limit length - Specifies the number of candles to consider for the overbought and oversold market calculation.
Low limit - Sets the minimum value of the limit to decide a short exit.
High limit - Sets the maximum value of the limit to decide a long exit.
Band length - Determines the number of candles to consider for the volatility analysis.
Band height - Sets the multiplication factor of the band to set the maximum and minimum height.
Increment - Determines the rate at which trend reversals occur. A higher value brings the line closer to the current price faster.
Candles exit - Specifies the minimum number of candles required to pass for an exit to become available after initiating a new position.
Oscillator - Enables or disables the main oscillator, which helps determine entry points. Not all assets may benefit from this parameter.
Oscillator length - Specifies the number of candles considered for the entry points oscillator.
Highlighter - Applies a light color between the trend and average price of each bar.
Trend Labels - Displays labels indicating an uptrend or downtrend.
Signal Labels - View the labels indicating a new long or short position.
Exit Labels - Displays the labels indicating exit points.
Candle color - Color codes the inside of the candles with the current signal.
Cloud - Visualize the average price cloud to determine trend direction.
Oscillator points - Adds visual dots to indicate when the oscillator has changed its trend.
Oscillator line - Displays the values of the oscillator to indicate upcoming trend changes.
Alternative exits - Shows additional exits to the ones we recommend, useful if the user missed an exit or needs to have more than two.
Color uptrend - Determines the color scheme for identifying uptrend movements.
Color downtrend - Determines the color scheme for identifying downtrend movements.
Color long - Sets the color scheme for a new long position.
Color short - Sets the color scheme for a new short position.
Color exit - Decides the color scheme for the exit tag and cross shown.
Color alternative exit - Changes the color scheme for the alternative exit cross.
Color oscillator line - Determines the color scheme used for the oscillator line.
Indicator Visuals
The strategy plots the direction of the trend on the chart and changes its color based on this. It also plots shapes on the chart to denote potential buy (Long) and sell (Short) points, where the signals of short and long will appear as well as exit points which can be found as three different,
Exit 1 - A partial exit which sells the previously selected percentage of equity.
Exit 2 - A second exit that can only happen after an Exit 1 has happened, and sell the remaining amount of equity.
Exit Full - A full exit is executed when the price at the exit point is lower than the entry price plus the win difference value. This condition indicates that it is more advantageous to take a single exit rather than waiting for a second exit.
Strategy Alerts
The strategy does not include built-in alerts. However, alerts can be added using the TradingView interface based on the strategy's buy and sell conditions. This way you will be able to receive notifications on your computer or phone when a new signal goes out.
Details
Repainting: It is important to mention that the strategy can mark false long or short signals, as the oscillator is allowed to repaint on the same candle. So users must make sure the candle has closed on buy/sell conditions.
Excessive capital issue: If you configure the strategy with a big amount of capital (+$1,000,000 for example) it is possible that it will completely stop calculating exit signals, as they will be too big for TradingView’s engine to process.
Conclusion
The ByteBoost PRISM strategy empowers traders by providing comprehensive market analysis, clear entry and exit signals, and the ability to visualize strategy performance using historical data. It is a superior algorithm that maximizes profit potential and minimizes risks, making it the preferred choice for traders seeking a competitive edge in the financial markets.
Disclaimer
This strategy is provided as-is, with no guarantee of profits or responsibility for losses. Trading involves risk, and you should only trade with money you can afford to lose. Always conduct your own research and consider your financial situation before engaging in trading.

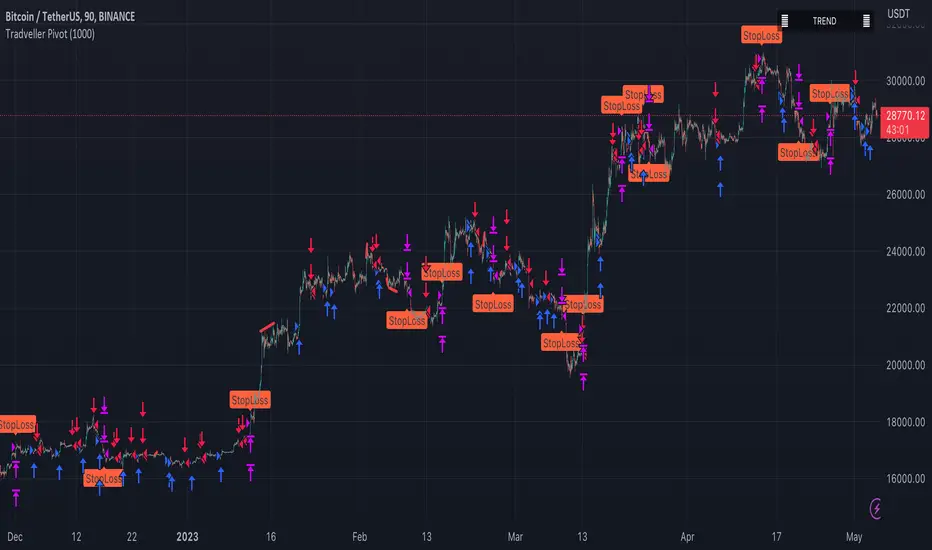
Tradveller PivotA pivot strategy is a trading technique that involves identifying key price levels, called pivot points, where a financial instrument is likely to experience a change in direction. Pivot points serve as potential support and resistance levels, which can help traders make informed decisions on when to enter or exit positions, set stop-loss or take-profit orders, and gauge market sentiment.
The pivot point itself is calculated using the high, low, and closing prices of the previous trading period (usually daily, but it can be applied to any timeframe). Once the pivot point is determined, additional support and resistance levels can be calculated around it. There are several methods to calculate these levels, with the most common being the classic, Woodie's, Camarilla, and Fibonacci methods.
A pivot strategy usually involves the following steps:
Calculate the pivot point and support and resistance levels using one of the methods mentioned above.
Observe the market price action and identify if the price is trading above or below the pivot point. If the price is above the pivot point, it indicates bullish sentiment, while trading below the pivot point suggests bearish sentiment.
Use the support and resistance levels to identify potential entry and exit points. Traders might consider buying when the price approaches a support level and selling when it approaches a resistance level.
Set stop-loss orders and take-profit targets based on the calculated levels, ensuring proper risk management.
Pivot strategies can be used in various market conditions and timeframes, and they often work well in combination with other technical analysis tools and indicators. However, like any trading strategy, it's essential to use proper risk management techniques and understand that no strategy guarantees success in every trade.
SPY 4 Hour Swing TraderThe purpose of this script is to spot 4 hour pivots that indicate ~30 trading day swings. As VIX starts to drop options trading will get more boring and as we get back on the bull and can benefit from swing trading strategy. Swing trading doesn't make a whole lot of sense when VIX is above 28. Seems to get best results on 4 hour chart for this one. This indicator spots a go long opportunity when the 5 ema crosses the 13 ema on the 4 hour along with the RSI > 50 and the ADX > 20 and Stoichastic values (smoothed line < 80 or line < 90) and close > last candle close and the True Range < 6. It also spots uses a couple different means to determine when to exit the trade. Sell condition is primarily when the 13 ema crosses the 5 ema and the MACD line crosses below the signal line and the smoothed Stoichastic appears oversold (greater than 60) and slop of RSI < -.2. Stop Losses and Take Profits are configurable in Inputs along with ability to include short trades plus other MACD and Stoichastic settings. If a stop loss is encountered the trade will close. Also once twice the expected move is encountered partial profits will taken and stop losses and take profits will be re-established based on most recent close. Also a VIX above 28 will trigger any open positions to close. If trying to use this for something other than SPXL it is best to update stop losses and take profit percentages and check backtest results to ensure proper levels have been selected and the script gives satisfactory results.

SPY 1 Hour Swing TraderThe purpose of this script is to spot 1 hour pivots that indicate ~5 to 6 trading day swings. Results indicate that swings are held approximately 5 to 6 trading days on average, over the last 6 years. This indicator spots a go long opportunity when the 5 ema crosses the 13 ema on the 1 hour along with the RSI > 50. It also spots uses a couple different means to determine when to exit the trade. Sell condition is primarily when the 13 ema crosses the 5 ema and the MACD line crosses below the signal line and the smoothed Stoichastic appears oversold (greater than 60). Stop Losses and Take Profits are configurable in Inputs along with ability to include short trades plus other MACD and Stoichastic settings. If a stop loss is encountered the trade will close. Also once twice the expected move is encountered partial profits will taken and stop losses and take profits will be re-established based on most recent close. Once long trades are exited, short trades will be initiated if recent conditions appeared oversold and input option for short trading is enabled. If trying to use this for something other than SPXL it is best to update stop losses and take profit percentages and check backtest results to ensure proper levels have been selected and the script gives satisfactory results.

X48 - Strategy | BreakOut & Consecutive (11in1) + Alert | V.1.2================== Read This First Before Use This Strategy ==============
*********** Please be aware that this strategy is not a guarantee of success and may lead to losses.
*********** Trading involves risk and you should always do your own research before making any decisions.
================= Thanks Source Script and Explain This Strategy ===================
► Description
Write a detailed and meaningful description that allows users to understand how your script is original, what it does, how it does it and how to use it
This Strategy Are Combine Strategy and Indicators Alert Function For Systematic Trading User.
Strategy List, Thanks For Original Source Script , From Tradingview Build-in Script From fmzquant Github
// Channel BreakOut Strategy : Calculate BreakOut Zone For Buy and Sell.
// Consecutive Bars UP/Down Strategy : The consecutive bars up/down strategy is a trading strategy used to identify potential buy and sell signals in the stock market. This strategy involves looking for a series of bars (or candles) that are either all increasing or all decreasing in price. If the bars are all increasing, it can be a signal to buy, and if the bars are all decreasing, it can be a signal to sell. This strategy can be used on any timeframe, from a daily chart to an intraday chart.
// 15m Range Length SD : Range Of High and Low Candle Price and Lookback For Calculate Buy and Sell.
Indicators Are Simple Source Script (Almost I'm Chating With CHAT-GPT and Convert pinescript V4 to V5 again for complete almost script and combine after)
// SwingHigh and SwingLow Plot For SL (StopLoss by Last Swing).
// Engulfing and 3 Candle Engulfing Plot.
// Stochastic RSI for Plot and Fill Background Paint and Plot TEXT For BULL and BEAR TREND.
// MA TYPE MODE are plot 2 line of MA Type (EMA, SMA, HMA, WMA, VWMA) for Crossover and Crossunder.
// Donchian Fans MODE are Plot Dot Line With Triangle Degree Bull Trend is Green Plot and Bear Trend is Red Plot.
// Ichimoku Cloud Are Plot Cloud A-B For Bull and Bear Trend.
// RSI OB and OS for TEXT PLOT 'OB' , 'OS' you will know after OB and OS, you can combo with other indicators that's make you know what's the similar trend look like?
// MACD for Plot Diamond when MACD > 0 and MACD < 0, you can combo with other indicators that's make you know what's the similar trend look like?
Alert Can Alert Sent When Buy and Sell or TP and SL, you can adjust text to alert sent by your self or use default setting.
========== Let'e Me Explain How To Use This Strategy =============
========== Properties Setting ==========
// Capital : Default : 1,000 USDT For Alot Of People Are Beginner Investor = It's Capital Your Cash For Investment
// Ordersize : Default Are Setting 5% / Order We Call Compounded
========== INPUT Setting ==========
// First Part Use Must Choose Checkbox For Use of Strategy and Choose TP/SL by Swing or % (can choose both)
// In Detail Of Setting Are Not Too Much, Please Read The Header Of Setting Before Change The Value
// For The Indicator In List You Want To Add Just Check ✅ From MODE Setting, It's Show On Your Chart
// You Can Custom TP/SL % You Want
========== ##### No trading strategy is guaranteed to be 100% successful. ###### =========
For Example In My Systematic Trading
Select 1/3 Strategy Setting TP/SL % Match With Timeframe TP Long Are Not Set It's Can 161.8 - 423.6% but Short Position Are Not Than 100% Just Fine From Your Aset
Choose Indicators For Make Sure Trend and Strategy are the same way like Strategy are Long Position but MACD and Sto background is bear. that's mean this time not open position.
Donchian Fans is Simple Support and Ressistant If You Don't Know How To Plot That's, This indicator plot a simple for you ><.
Make Sure With Engulfing and 3 Candle Engulfing If You Don't Know, What's The Engulfing, This Indicator are plot for you too ><.
For a Big Trend You can use Ichimoku Cloud For Check Trend, Candle Upper Than Cloud or Lower Than Cloud for Bull and Bear Trend.

Minervini Pullback Strategy_Trend-Template QualifierGeneral Description and Unique Features of this Script
Introducing the ultimate trend-following (long-only) strategy that offers a unique feature you won't find anywhere else!
1. Our script/strategy utilizes Mark Minervini's Trend-Template as a qualifier for identifying stocks and other financial securities in confirmed uptrends. Mark Minervini, a 3x US Investment Champion, developed the Trend-Template, which covers eight different and independent characteristics that can be adjusted and optimized in this trend-following strategy to ensure the best results. The strategy will only trigger buy-signals in case the optimized qualifiers are being met.
2. Our strategy is based on supply/demand balance in the market, making it timeless and effective across all timeframes. Whether you're day trading using 1- or 5-min charts or swing-trading using daily charts, this strategy can be applied and works very well.
3. We also incorporate technical indicators such as RSI and MACD to identify low-risk pullback entries in the context of confirmed uptrends. By doing so, the risk profile of this strategy and drawdowns are being reduced to an absolute minimum, giving you peace of mind while trading.
Minervini’s Trend-Template and the ‘Stage-Analysis’ of the Markets
This strategy is a so-called 'long-only' strategy. This means that we only take long positions, short positions are not considered.
The best market environment for such strategies are periods of stable upward trends in the so-called stage 2 - uptrend.
In stable upward trends, we increase our market exposure and risk.
In sideways markets and downward trends or bear markets, we reduce our exposure very quickly or go 100% to cash and wait for the markets to recover and improve. This allows us to avoid major losses and drawdowns.
This simple rule gives us a significant advantage over most undisciplined traders and amateurs!
'The Trend is your Friend'. This is a very old but true quote.
What's behind it???
• 98% of stocks made their biggest gains in a Phase 2 upward trend.
• If a stock is in a stable uptrend, this is evidence that larger institutions are buying the stock sustainably.
• By focusing on stocks that are in a stable uptrend, the chances of profit are significantly increased.
• In a stable uptrend, investors know exactly what to expect from further price developments. This makes it possible to locate low-risk entry points.
The goal is not to buy at the lowest price – the goal is to buy at the right price!
Each stock goes through the same maturity cycle – it starts at stage 1 and ends at stage 4
Stage 1 – Neglect Phase – Consolidation
Stage 2 – Progressive Phase – Accumulation
Stage 3 – Topping Phase – Distribution
Stage 4 – Downtrend – Capitulation
This strategy focuses on identifying stocks in confirmed stage 2 uptrends. This in itself gives us an advantage over long-term investors and less professional traders.
By focusing on stocks in a stage 2 uptrend, we avoid losses in downtrends (stage 4) or less profitable consolidation phases (stages 1 and 3). We are fully invested and put our money to work for us, and we are fully invested when stocks are in their stage 2 uptrends.
But how can we use technical chart analysis to find stocks that are in a stable stage 2 uptrend?
Mark Minervini has developed the so-called 'trend template' for this purpose. This is an essential part of our JS-TechTrading pullback strategy. For our watchlists, only those individual values that meet the tough requirements of Minervini's trend template are eligible.
The Trend Template
• 200d MA increasing over a period of at least 1 month, better 4-5 months or longer
• 150d MA above 200d MA
• 50d MA above 150d MA and 200d MA
• Course above 50d MA, 150d MA and 200d MA
• Ideally, the 50d MA is increasing over at least 1 month
• Price at least 25% above the 52w low
• Price within 25% of 52w high
• High relative strength according to IBD.
We have developed an algorythm (for TradingView) that uses Minervini’s trend template as a qualifier. This means that the strategy only generates trading signals in case the selected elements of the trend template are being met. The user is fully flexible to adjust the requirements of this Trend-Template qualifier:
This strategy is normally applied to the daily chart ideal for selecting individual stocks for trend-following strategies. Nevertheless, Minervini’s principles are timeless and this alogrithmic strategy with the Trend-Template qualifier can also be applied to any other timframe.
The qualifier #9 (RS-Ratings) can be modified and optimized in the strategy’s settings to fit your individual needs.
In general, it should be noted that ideally all 8/8 trend template criteria are met. Stocks or other securities that meet only some of these 8 criteria can also be very promising candidates for this strategy, provided that backtesting yields good results.
The Pullback Strategy
For the JS-TechTrading pullback strategy, only stocks and other financial instruments that meet the selected criteria of Mark Minervini's trend template are considered. If not, the strategy will not generate any signals.
Further prerequisites for generating a buy signal is that the individual value is in a short-term oversold state (RSI).
When the selling pressure is over and the continuation of the uptrend can be confirmed by the MACD after reaching a price low, a buy signal is issued by the pullback strategy.
Stop-loss limits and profit targets can be set variably.
Relative Strength Index (RSI)
The Relative Strength Index (RSI) is a technical indicator developed by Welles Wilder in 1978. The RSI is used to perform a market value analysis and identify the strength of a trend as well as overbought and oversold conditions. The indicator is calculated on a scale from 0 to 100 and shows how much an asset has risen or fallen relative to its own price in recent periods.
The RSI is calculated as the ratio of average profits to average losses over a certain period of time. A high value of the RSI indicates an overbought situation, while a low value indicates an oversold situation. Typically, a value > 70 is considered an overbought threshold and a value < 30 is considered an oversold threshold. A value above 70 signals that a single value may be overvalued and a decrease in price is likely , while a value below 30 signals that a single value may be undervalued and an increase in price is likely.
For example, let's say you're watching a stock XYZ. After a prolonged falling movement, the RSI value of this stock has fallen to 26. This means that the stock is oversold and that it is time for a potential recovery. Therefore, a trader might decide to buy this stock in the hope that it will rise again soon.
Moving Average Convergence Divergence (MACD)
The MACD (Moving Average Convergence Divergence) is a technical indicator used in both short-term and long-term trading strategies. The indicator was developed by Gerald Appel and is one of the most well-known indicators for the stock market.
The MACD consists of two lines calculated by the difference between two moving averages. The first line is a fast moving average that targets a short period of time. The second line is a slow moving average that targets a longer period of time. In addition, a trigger line is calculated, which consists of another moving average of the MACD line.
The MACD line is the difference between the fast and slow moving average.
The greater the difference between the two lines, the more likely a subsequent price increase. The lower the difference, the more likely a subsequent price drop is.
If the MACD line crosses upwards over the trigger line, this is a buy signal that signals a potential price increase. If the MACD line crosses down below the trigger line, this is a sell signal that signals a potential price weakening.
This strategy is applicable to all timeframes and the relevant parameters for the underlying indicators (RSI and MACD) can be adjusted and optimized as needed.
Backtesting
Backtesting give outstanding results on all timeframes and drawdowns can be reduced to a minimum level. Swing-Traders (daily charts) will see that the strategy does not give any buy signals during market corrections and bear markets.
Settings for backtesting are:
- Period from Jan 2000 until now
- Starting capital 100k USD
- Position size = 25% of equity
- 0.01% commission = USD 2.50.- per Trade
Other comments
• This strategy has been designed to identify the most promising, highest probability entries and trades for each stock or other financial security.
• The trend-template qualifier is highly selective and filters out the most promising swing-trading entries. As a result, you will normally only find a single-digit number of trades for each stock or other financial security per year in case you apply this strategy for the daily charts. Shorter timeframes will result in a higher number of trades / year.
• As a result, traders need to apply this strategy for a full watchlist rather than just one financial security.

Heikin Ashi SupertrendAbout this Strategy
This supertrend strategy uses the Heikin Ashi candles to generate the supertrend but enters and exits trades using normal candle close prices. If you use the standard built in Supertrend indicator on Heikin Ashi candles, it will produce very unrealistic backtesting results because it uses the Heikin Ashi prices instead of the real prices. However, by signaling the supertrend reversals using Heikin Ashi while using standard candle close prices for the entries and exits, it corrects the backtesting errors and gives you a more realistic equity curve. You should set the chart to use standard candles and then hide them (the strategy creates the candles).
This strategy includes:
Plotting of Heikin Ashi candles
Heikin Ashi Supertrend
Long and Short Entry Signals
Move stop loss after trade is X% in profit
Profit Target
Stop Loss
Built in Alertatron automation
Alertatron Trade Automation Integration
For Alertatron integration, be sure to configure the strategy settings and "Enable Webhook Messages" before creating an alert with {{strategy.order.alert_message}} in the body of your alert message. Be sure to enable webhooks and point it to your Incoming Alertatron webhook URL.
Notes
While this strategy does pretty well during trending markets, It's worth noting that the Buy and Hold ROI is much better during peak times of the bull market
Not financial advice. Do not risk more than you can afford to lose.

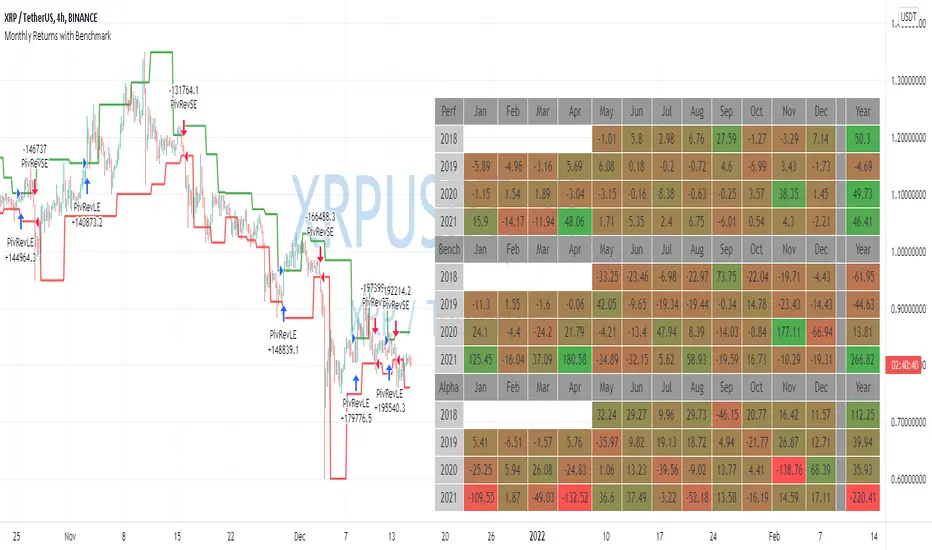
Monthly Returns of a Strategy in a ChartIt's a simple example of how you can present your strategy's monthly performance in a chart.
You maybe know that there is no support of these kind of charts in TradingView so this chart is actually a table object under the hood.
Table visual appearance is customizable, you can change:
Location
Bar Width / High
Colors
Thanks to @MUQWISHI for hard work, for helping me coding it.
It's not about the strategy itself but the way you display returns on your chart. So pls don't critique my choice of the strategy and its performance 🙂
Disclaimer
Please remember that past performance may not be indicative of future results.
Due to various factors, including changing market conditions, the strategy may no longer perform as well as in historical backtesting.
This post and the script don’t provide any financial advice.

IPB_JPMUPS_2022Introduction :
This indicator serves two purposes
a) It is a multi dimensional floor pivot indicator, which takes its concepts from Secrets of Pivot Boss book of Frank Ochoa. Most of the indicators suggested in the book are packed in one indicator.
b) It also has an inbuilt intraday strategy which identifies trend, direction and momentum based on CPR (Central Pivot Range) concepts and accordingly comes up with trading signals.
How this indicator is different from the published ones :
A). Role as an indicator
This indicator has all the CPR (Central Pivot Range) indicators packed together which provides a ready made solution for CPR based trading. The following are the salient features of this indicator :
1) This indicator plots daily CPR using previous day high, low and close. It also plots Support and Resistance levels based on floor pivots formula.
Moreover, it also plots developing CPR which is based on current day's high, low and close. Apart from that it also plots CPR for next day session as well which is useful for EOD analysis.
2) This indicator plots weekly CPR using previous week high, low and close. It also plots developing CPR which is based on current week's high, low and close.
3) This indicator plots monthly CPR using previous month high, low and close. It also plots developing CPR which is based on current month's high, low and close.
4) This indicator plots pivot EMA which is called PEMA. It uses three different EMAs which are customisable and uses them to plot a moving average web based on pivot points of each candle, which is called as PEMA. This also facilitates PEMA plotting for higher time frame (daily time frame) as well.
5) This indicator plots daily time frame moving average in intraday chart which can be used as a key zone during trading. The period is customisable.
B) Role as a strategy
This indicator also functions as an intraday trading strategy called JPMUPS (JP stands for author's nickname. MUPS stands for Manoj Ultimate Pivot Strategy). This strategy attempts to identify trend, direction and momentum and when all these three align together it gives buy and sell signals. The concepts are as under:
Trend identification :
Whenever a trend is established, the developing CPR starts to widen. Hence this strategy uses the width of the developing CPR and compares it with the MA of the width to identify the trend. If the width of the developing CPR crosses the 34 period MA (can be customised), it assumes a trend is developing.
Direction identification:
Whenever a direction is established, the CPR components, namely BC and TC shifts its position. Hence this strategy uses this concept to identify the direction. It computes MACD sort of histogram of the BC and TC difference and whenever the histogram slops upwards, it assumes bullish direction and vice versa.
Momentum identification :
Whenever momentum is established, the developing CPR starts sloping upwards. Hence this strategy uses this concept to identify the momentum. It computes RSI of the developing CPR and if the RSI is above the 34 period MA (can be customised) of RSI , it assumes momentum is establishing and vice versa.
When all the above are aligned together, it gives buy or sell signals suitably.
How to use it :
a) Indicator usage :
1) CPR zones are key zones which predominantly acts as support and resistance zones. Looking at the price action at these zones, one can look for trading opportunities in live market.
2) Developing CPR acts as pull back zones and is very useful in live trading and also EOD analysis for spotting opportunities by combining price action.
b) Strategy usage :
1). Strategy signals are only indicative. Users are strongly advised not to use the strategy blindly. Users are advised to go though the CPR concepts thoroughly and use this strategy signals only as a supplement for further decision making / analysis.
Markets meant for :
1). This indicator and Strategy is predominantly designed for I ndian stock markets . However it can be customised for other markets as well by changing the timings of the markets in the parameters.
Market conditions meant for :
1). This indicator is meant for all types of market conditions as its predominant role is to plot the key support and resistance zones using CPR concepts.
2). The strategy is mainly found to be effective in trending markets and predominantly indices like Nifty and Bank Nifty . Hence Users are advised to use this only as an indicative feature and not blindly trade based on signals. The strategy is found to be less effective in lower time frames like 1min / 3min, etc. 15 min time frame provides fair performance. However it doesnt mean that it will continue to perform in the same manner in the future.

CamPivot + Ichimoku IrvineCamPivot + Ichimoku Irvine CamPivot + Ichimoku IrvineCamPivot + Ichimoku Irvine

Steven Primo's bollinger bands strategyHi, this strategy is taken from a video made by Steven Primo. You can look it up on YouTube if you want to know about it.
It is a mean-reversion strategy based on the Bollinger Bands, in which we wait for 5 consecutive closes above the upper band, and for a short-term top. Once it happens, we place an entry order on this top, with a stop at the nearest bottom before the movement started, and use the difference from the stop and entry point to determine the target. For shorting, it's the same process, but for the downside. From my testing, only long orders were profitable, but you can configure whichever you want.
It works well for directional markets with a low level of noise, as you can see with the BTCUSD chart. One of its caveats is the short number of occurrences, and the long stop loss and target. You can enable a trailing stop, but from my testings, it just made the results worse.
I made some modifications, like removing the MA requirement, since the entry point was above it almost all the time, and I forced the BB to use a log version of the prices, so that discrepancies are eliminated. You'll also notice that you can't select an extension that is lower than 100, and that is intentional, since you're not supposed to enter a trade in which you can lose more than what you can earn.
I chose not to implement any kind of risk management, but I might do that in the future. You can leave your suggestions in the comments.

Nabz-BBMACD-2022-V1.1I have tried to make script which triggers indicators on combination of different feedback including Bollinger bands and MACD. Also used some of my logic by trial and error, It gave 744%+ profit on back-testing on coin RUNE/USDT from Jan 2021. It is my first script, I am happy to help the community. Please share your feedback.

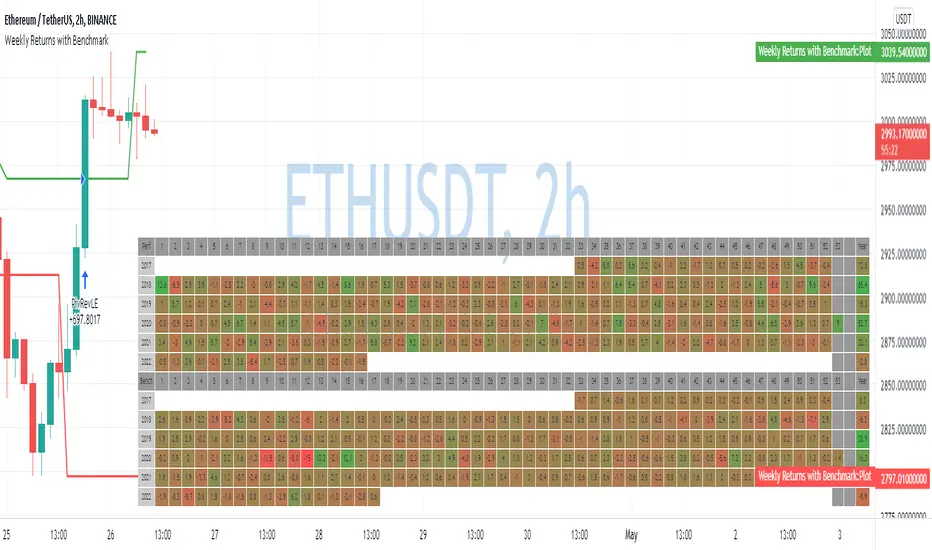
Weekly Returns with BenchmarkSome time ago I published Monthly returns table. Now It's time for weekly one.
To get it work you need a pretty big screen, but I hope it will be useful for some of you.
Features of this table includes:
Display weekly returns of your strategy, benchmark, and alpha over this benchmark.
Select benchmark to be another instrument
Select the date from which you want to compute monthly returns
Show/hide benchmark and alpha
Choose colors for gradient for gain/loss values
Use it with any type of strategy
Use it with replay
Thanks to @MUQWISHI to help me coding it.
It's not about the strategy itself but the way you display returns on your chart. So pls don't critique my choice of the strategy and its performance 🙂
Disclaimer
Please remember that past performance may not be indicative of future results.
Due to various factors, including changing market conditions, the strategy may no longer perform as well as in historical backtesting.
This post and the script don’t provide any financial advice.
Pivot Moving Average steteggythis Pivot Moving Average steteggy works best on a chart --->>Above 100$ crypto
Sniper is very profitable in terms of% good trades
It will perform very well on 1-5X Leverage (Solid leverage, not variable depending on the volume )
TP: 0.9 %
SL : 5.5 %

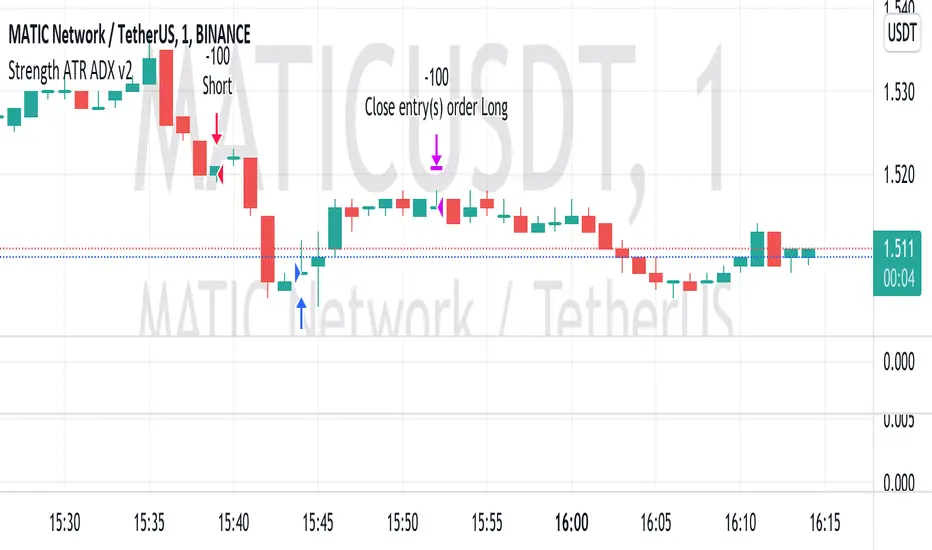
Strength ATR ADX v2This strategy looks for strong price movements with a high chance of a reversal on the difference in the rates of 6 currency pairs. A combination of ADX DI- and ATR is used for confirmation.
Added the ability to close trades by TP and SL to the strategy. (off by default)
Built-in martingale and reverse martingale (off by default)
The lot size is set in the strategy settings themselves!!!
The best results were obtained on XAUUSD 5M and on 1M cryptocurrency pairs.
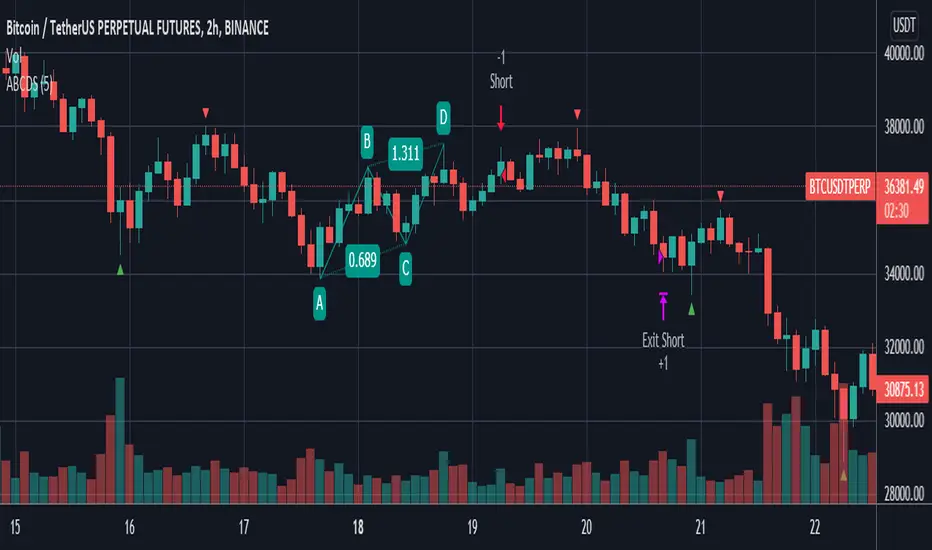
ABCD StrategyOne from many harmonic pattern that consists of two equivalent price legs. The ABCD pattern that helps traders predict when the price is about to change direction.
Tracing And Calculation
This code using pivot high and pivot low built-in method and calculate with Fibonacci Retracement.
Limitation
To find ABCD pattern is very difficult, just coming up a few from thousand candle. That why this code using little bit tolerance ratio to get more pattern.
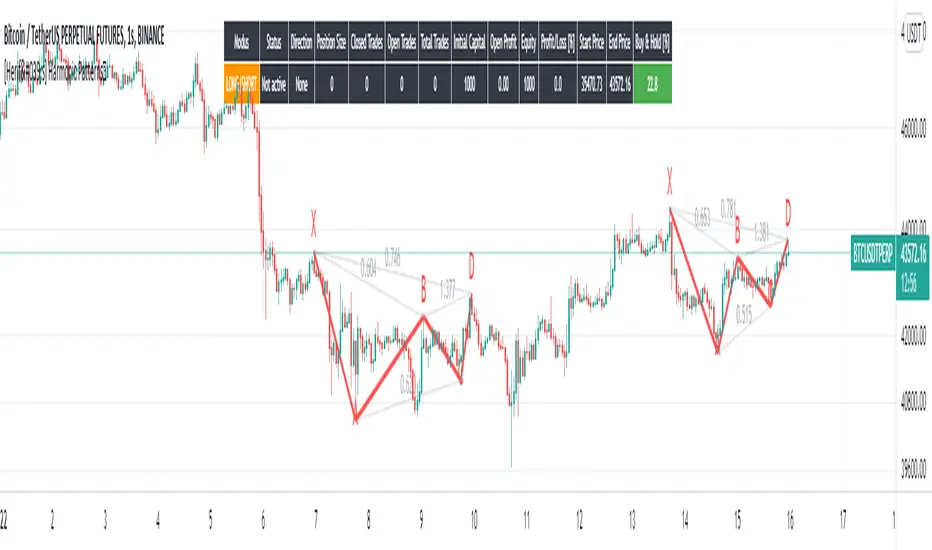
[Herif's] Harmonic PatternsFollowing things are displayed by default on the chart with harmonic patterns strategy. It can be use with automate trading platforms 3commas, zignally, frostybot, alertatron, wunderbit etc...
Bullish and bearish 5-point patterns are based on various Fibonacci retracement levels and signify potential reversal zones (PRZ).
As they become 80% complete, the dashed-line pattern will appear, displaying the PRZ and giving you time to prepare for a reversal.
Different combinations of specific fib retracements and extensions result in different patterns, and each is named for identification.
Bullish patterns signify a potential turn to the upside are colored green.
Bearish patterns signify a potential turn to the downside are colored red.
1- Live harmonic patterns which are still in trade with XABCD and ratio with labels.
2- Position Entry, Stop and Target levels on chart for all patterns.
3- Trades Stat table - Waves stat tables
in Settings:
Error Percent - This is error tollerance for matching pattern ratios. Cannot expect price ratios to be exactly as per books. Hence, adding few error tolerance will help identify patterns better.
When there are multiple patterns on chart, Entry, Stop, and Target labels and lines are created with specific distance from each other to provide clarity to the users.
Trailing and Targets
1-Trailing Start Stage - Defines when to start trailing stop-loss. It is recommended to set this value to either Target 1 or Target 2. Disabling the trailing or setting too far away may lead to being in trade on ranging market for too long. This may also result in drawing errors related to distance from current bar.
2- Custom Target Levels - Target and stop levels are set to optimal values based on individual patterns. If you want to override these levels, use the available input option to override targets and chose your custom Target1, Target2, Target3 and Target4
All Patterns you can enable or disable
Classic Patterns : Gartley, Bat, Butterfly, Crab, Deep Crab, Cypher, Shark, Nenstar
Anti Patterns: Anti Nenstar, Anti Shark, Anti Cypher, Anti Crab, Anti Butterfly, Anti Bat, Anti Gartley, Navarro 200
I will plan some updates and i will post some screen shots for settings as soon as possible.
Pivot Point BreakoutThis is a strategy taken from Perry Kaufman's book, Trading Systems and Methods.
Just like the title says, it's a breakout strategy. It works by buying when the current high is higher than the last pivot high, and selling when the low is lower than the last pivot low.
It does not have a good success probability, and relies on the good reward to risk ratio. Definitely not recommended for someone with weak hands.

[AXSUSDT] Multi signal Autotrade Binance* Commission: 0.06 and Autotrades Binance setting:
* Risk: 1%/trades and Stoploss moving formular:
1. H4 timeframe: Supertrend indicator
...Uptrend when closes candles is above the green line.
...Downtrend when closes candles is below the red line.
2. Pivot H/L:
- UPTREND:
... HH (Higher High) - HL (Higher Low)
... HH (Đỉnh sau cao hơn) - LH (Đáy sau cao hơn)
- DOWNTREND:
... LL (Lower Low) - LH (Lower High)
... LL (Đáy sau thấp hơn) - LH (Đỉnh sau thấp hơn)
3. Keltner Channels for detemined a trend & open trades: No repainting by checking previous closes candles.
* KELTNER BASIS = EMA(50)
- Zone for UPTREND: closes candle crossover Keltner Channels Upper 1, 2, 3
- Zone for DOWNTREND: closes candle crossunder Keltner Channels Lower 1, 2, 3
- Zone for opentrades: Keltner Channels Lower 1, Basis, Upper 1.
a. Open trades at Basis:
b. Open trades at Upper 1/Lower 1:
c. Open trades at SELL Upper 1/ BUY Lower 1:

[Crypto] Dow theory strategy - Commission: 0.06 = Binance future fee.
- Autotrade by webhook to Binance future options:
1. Trend Identification:
a. UPTRENDTREND:
- HH_Trend: Higher High trend.
- HL_Trend: Higher Low trend.
b. DOWNTREND:
- LL_Trend: Lower Low trend.
- LH_Trend: Lower Low trend.
2. Open trades conditions:
a. LONG OPEN CONDITION: Điều kiện MUA.
- HH_E: Higher High entries.
- HL_E: Higher Low entries.
b. SHORT OPEN CONDITION: Điều kiện BÁN.
- LL_E: Lower Low entries.
- LH_E: Lower Low entries.
3. Stop loss and Take profit:
Stoploss, Profit = Entry Price +- ATR(20) * 5
4. Summary every year:
- 2021 to 15 Dec, 2021
- 2020 to 2021:
- 2019 to 2020:
- 2018 to 2019:
- 2017 to 2018:
- 2016 to 2017:
- 2015 to 2016:
- 2014 to 2015:
- 2013 to 2014:
5. Summary long-range:
- 2019 to 15 Dec, 2021:
- 2016 to 2019:
- 2013 to 2016:
6. List of other pairs:

Monthly Returns with BenchmarkI keep working on trying to make TradingView strategies look fancier.
A few months ago I published the first version of the Monthly Returns for Strategies in Pine Script. I received quite a lot of good feedback and quite a lot of requests to update it.
This is a more advanced version of the Monthly Returns, in it, you can:
Display monthly returns of your strategy, benchmark, and alpha over this benchmark.
Select benchmark to be another instrument
Select the date from which you want to compute monthly returns
Show/hide benchmark and alpha
Choose colors for gradient for gain/loss values
Use it with any type of strategy
Use it with replay
I hope it will be useful for you.
It's not about the strategy itself but the way you display returns on your chart. So pls don't critique my choice of the strategy and its performance 🙂
Disclaimer
Please remember that past performance may not be indicative of future results.
Due to various factors, including changing market conditions, the strategy may no longer perform as well as in historical backtesting.
This post and the script don’t provide any financial advice.